Copyright
©2009 The WJG Press and Baishideng.
World J Gastroenterol. Aug 7, 2009; 15(29): 3603-3610
Published online Aug 7, 2009. doi: 10.3748/wjg.15.3603
Published online Aug 7, 2009. doi: 10.3748/wjg.15.3603
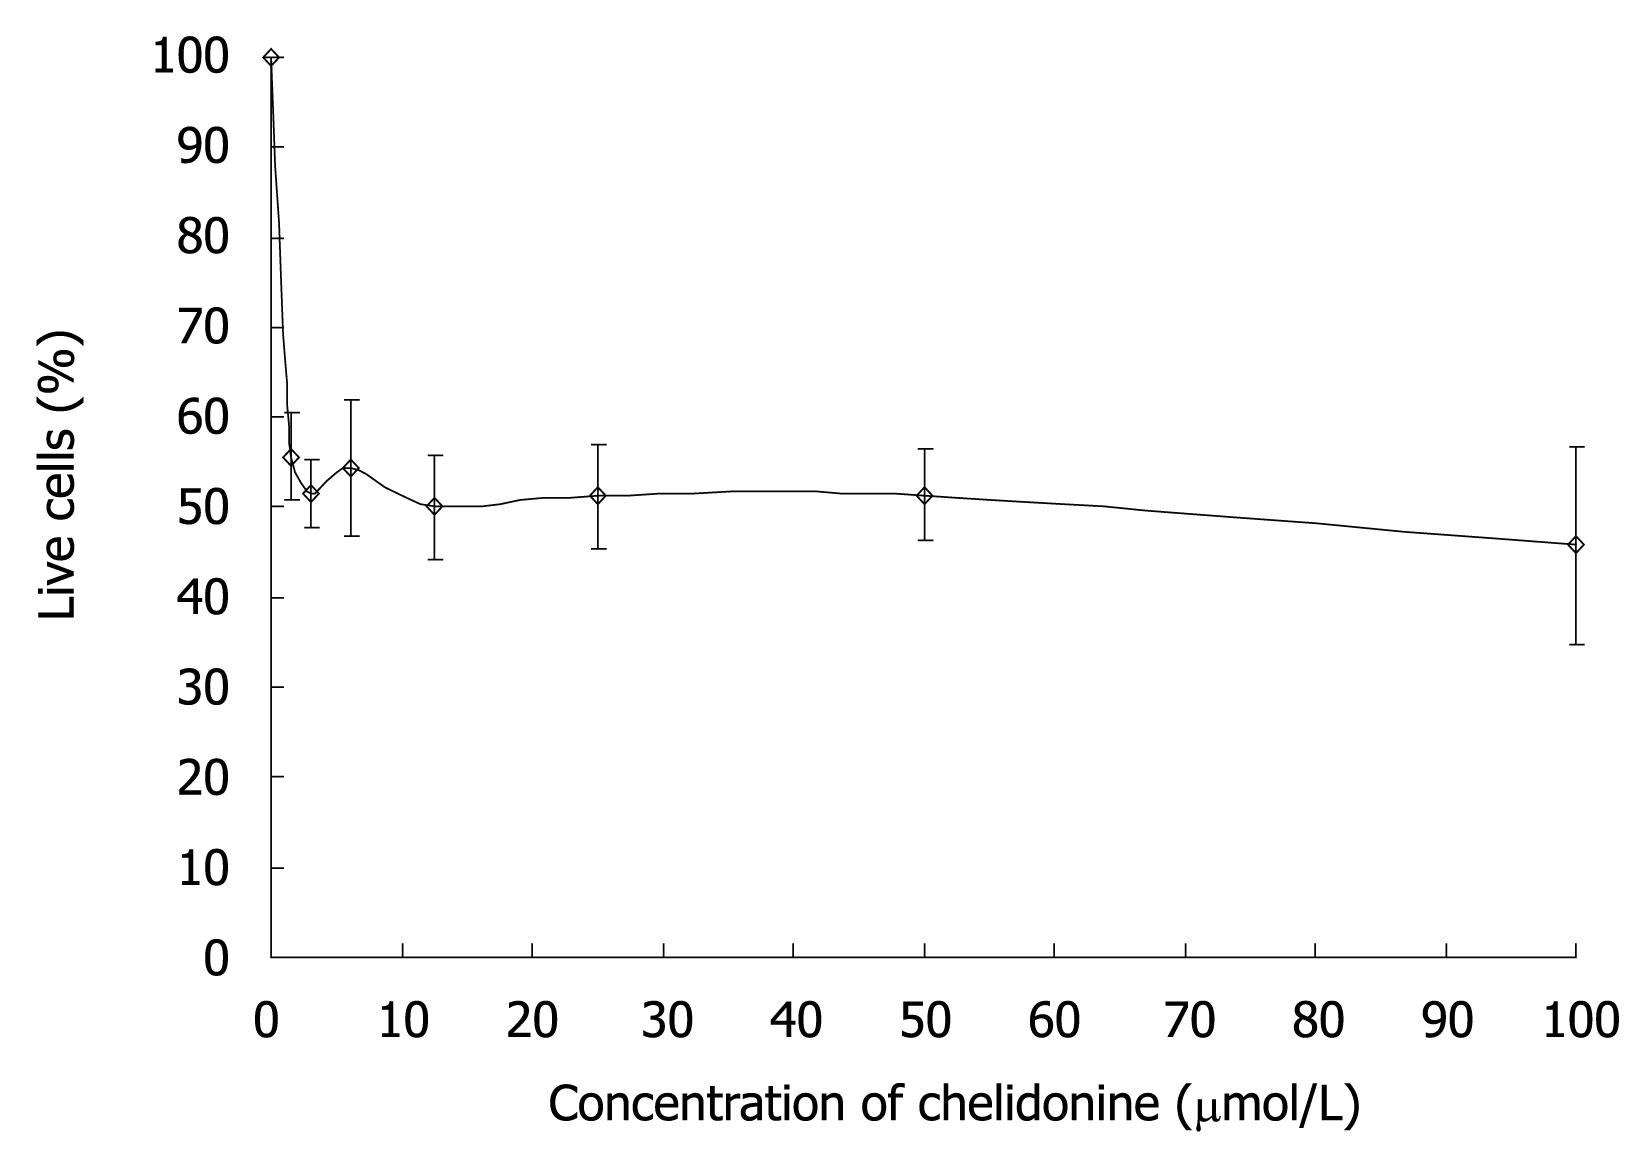
Figure 1 The effect of chelidonine on the growth of HepG2 cells after 48 h exposure.
Viability of cells at each concentration of chelidonine was evaluated by neutral red uptake test and is expressed as a percentage relative to untreated control cells. The values presented are the mean ± SD of six repeats each one in triplicate.
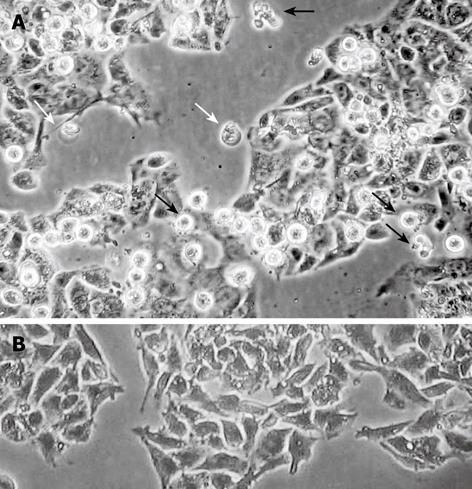
Figure 2 Morphological changes in HepG2 cells after 48 h treatment with 12 &mgr;mol/L chelidonine (LD50) visualized by phase contrast microscopy.
A: Apoptotic cells (black arrows) and a few cells undergoing blister cell death (white arrows) are clearly seen; B: Untreated control HepG2 cells.
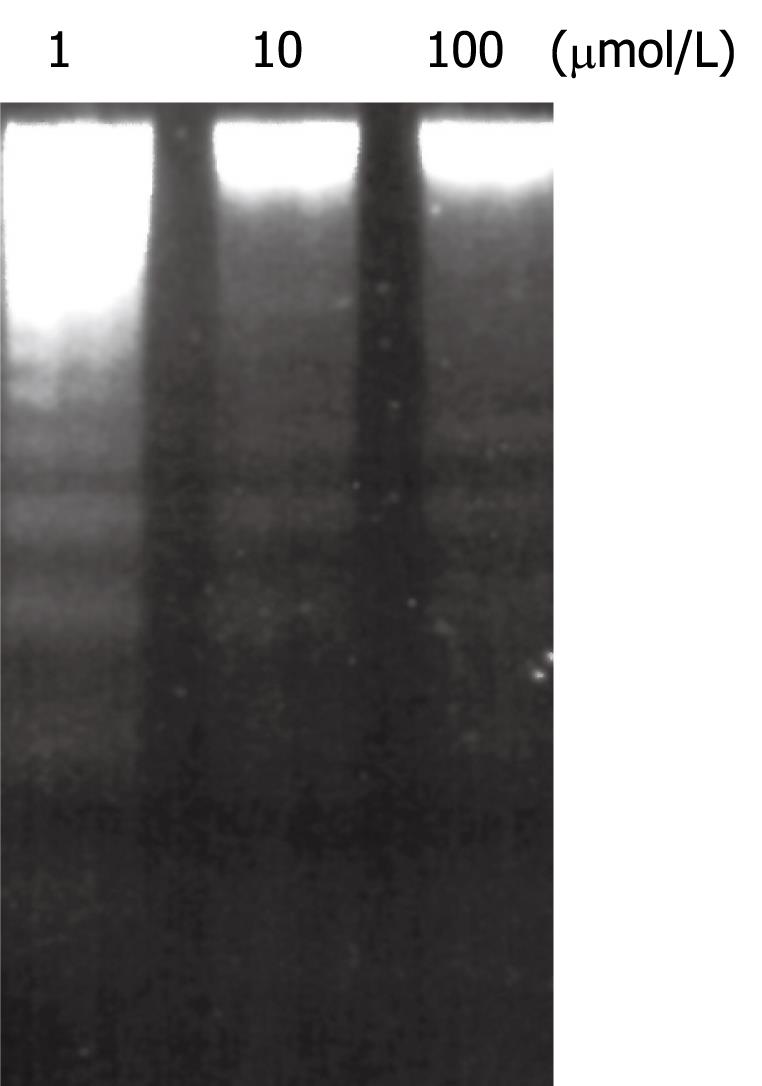
Figure 3 Induction of DNA fragmentation in HepG2 cells after 48 h treatment with different concentrations of chelidonine.
The concentration of chelidonine is indicated at the top of each well.
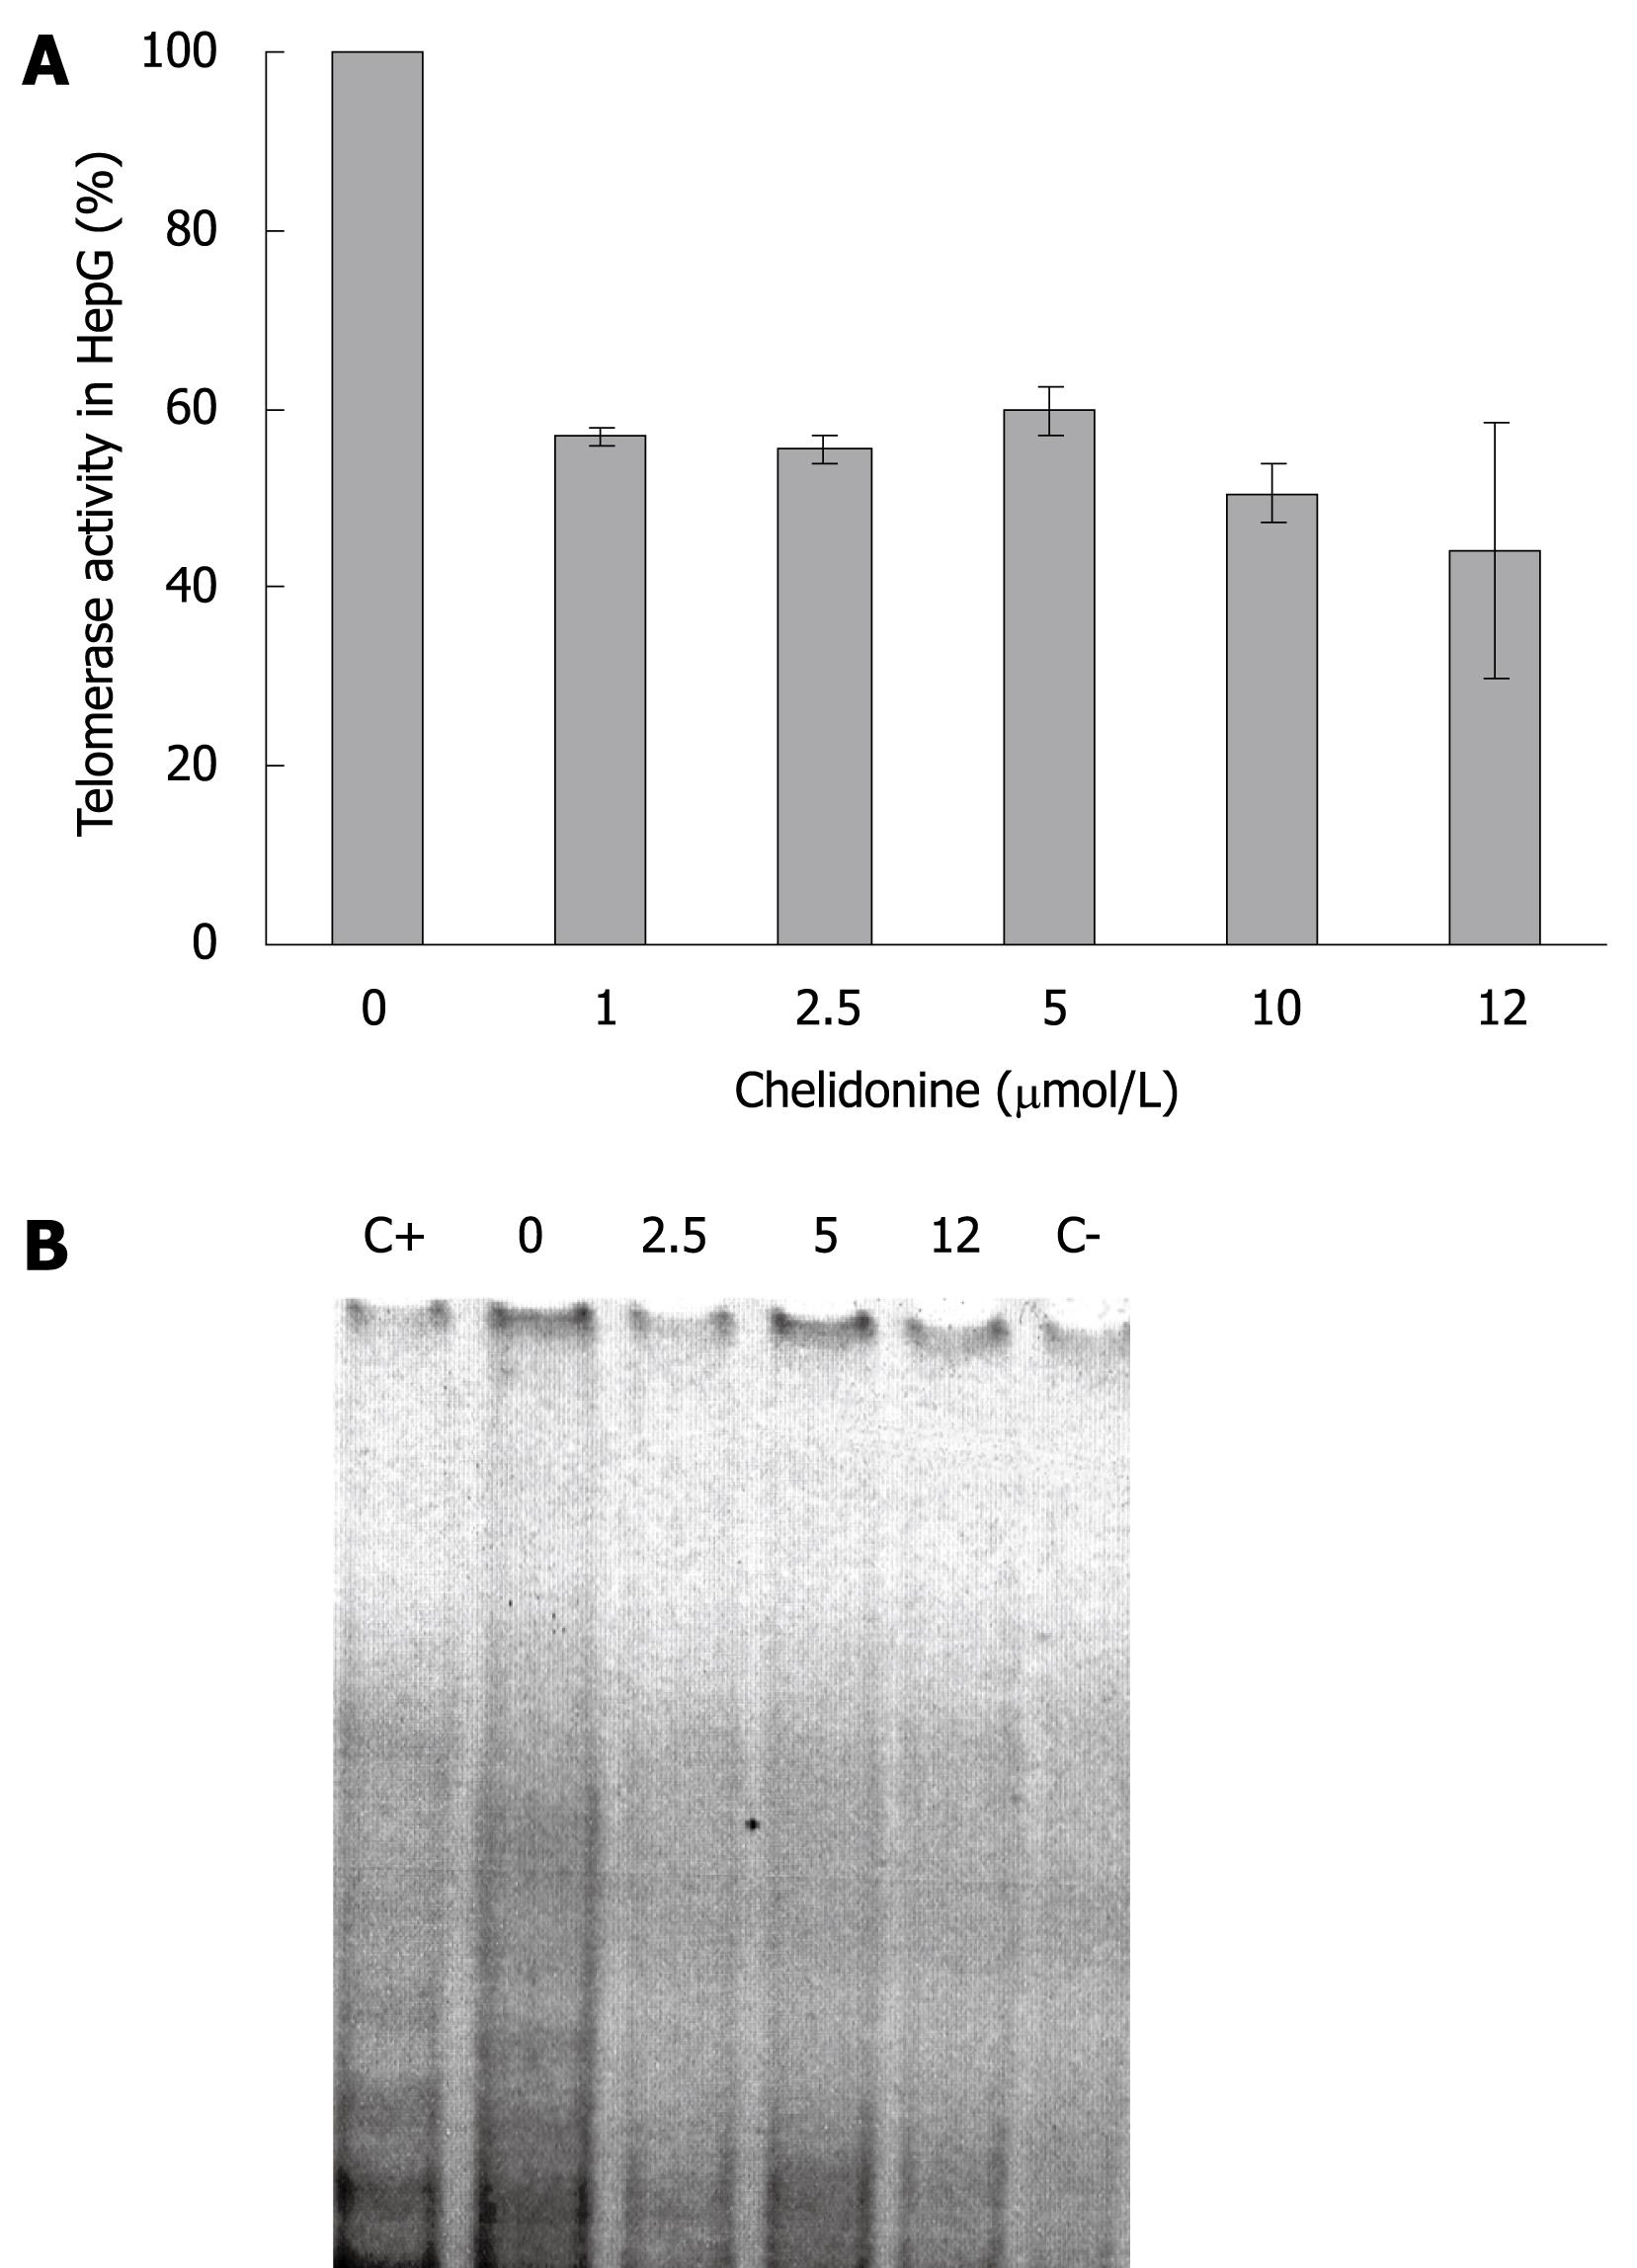
Figure 4 Telomerase activity using TRAP assay in HepG2 control and 48 h treated cells with different concentration of chelidonine up to LD50.
A: The relative activity of treated cells against untreated control cells are indicated as mean ± SD; B: TRAP products resolved on non-denaturing PAGE and stained with SYBR Green. The concentration of chelidonine is indicated on top of each well in μmol/L. C+: Positive control; C-: Negative control.
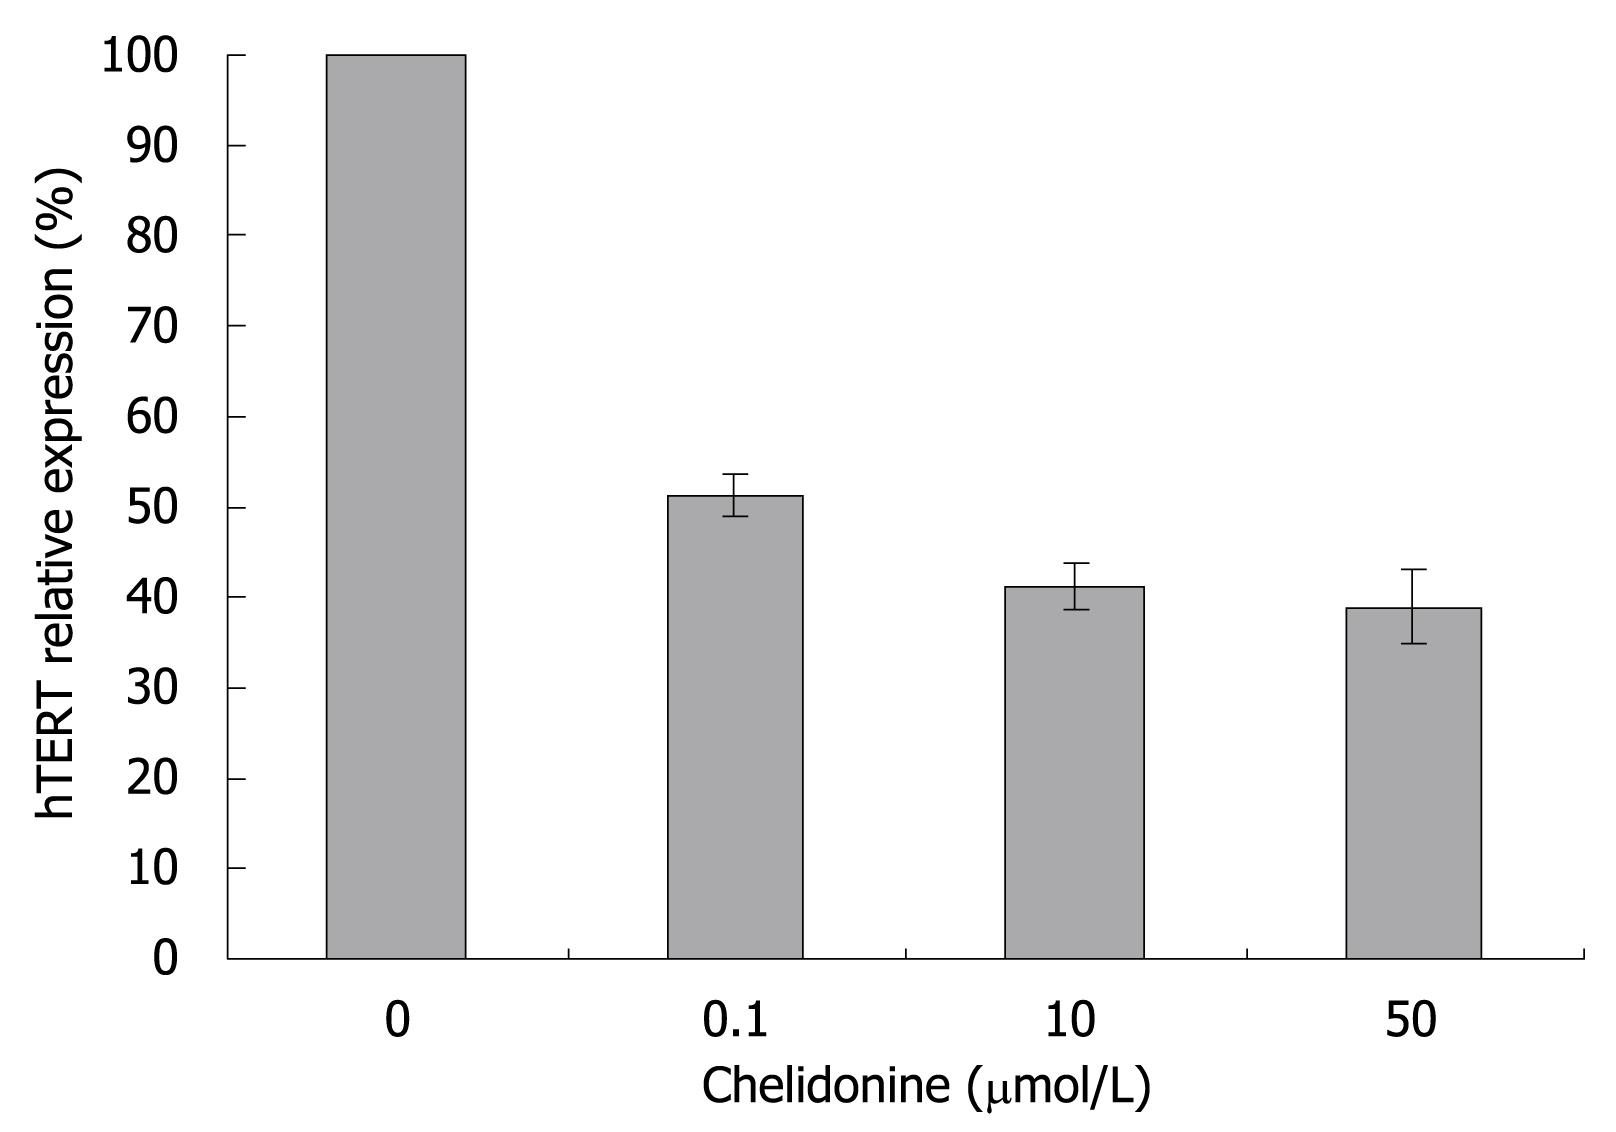
Figure 5 HepG2 cells were treated for 48 h with medium supplemented with solvent (ethanol, not exceeding 0.
1%) or 0.1, 10 and 50 &mgr;mol/L chelidonine. Relative hTERT gene expression as measured by real-time RT-PCR which was calibrated with the constitutive expression of β2-microglobulin gene. hTERT level in control samples was considered as 100%. The values indicated as mean ± SD (n ≥ 6).
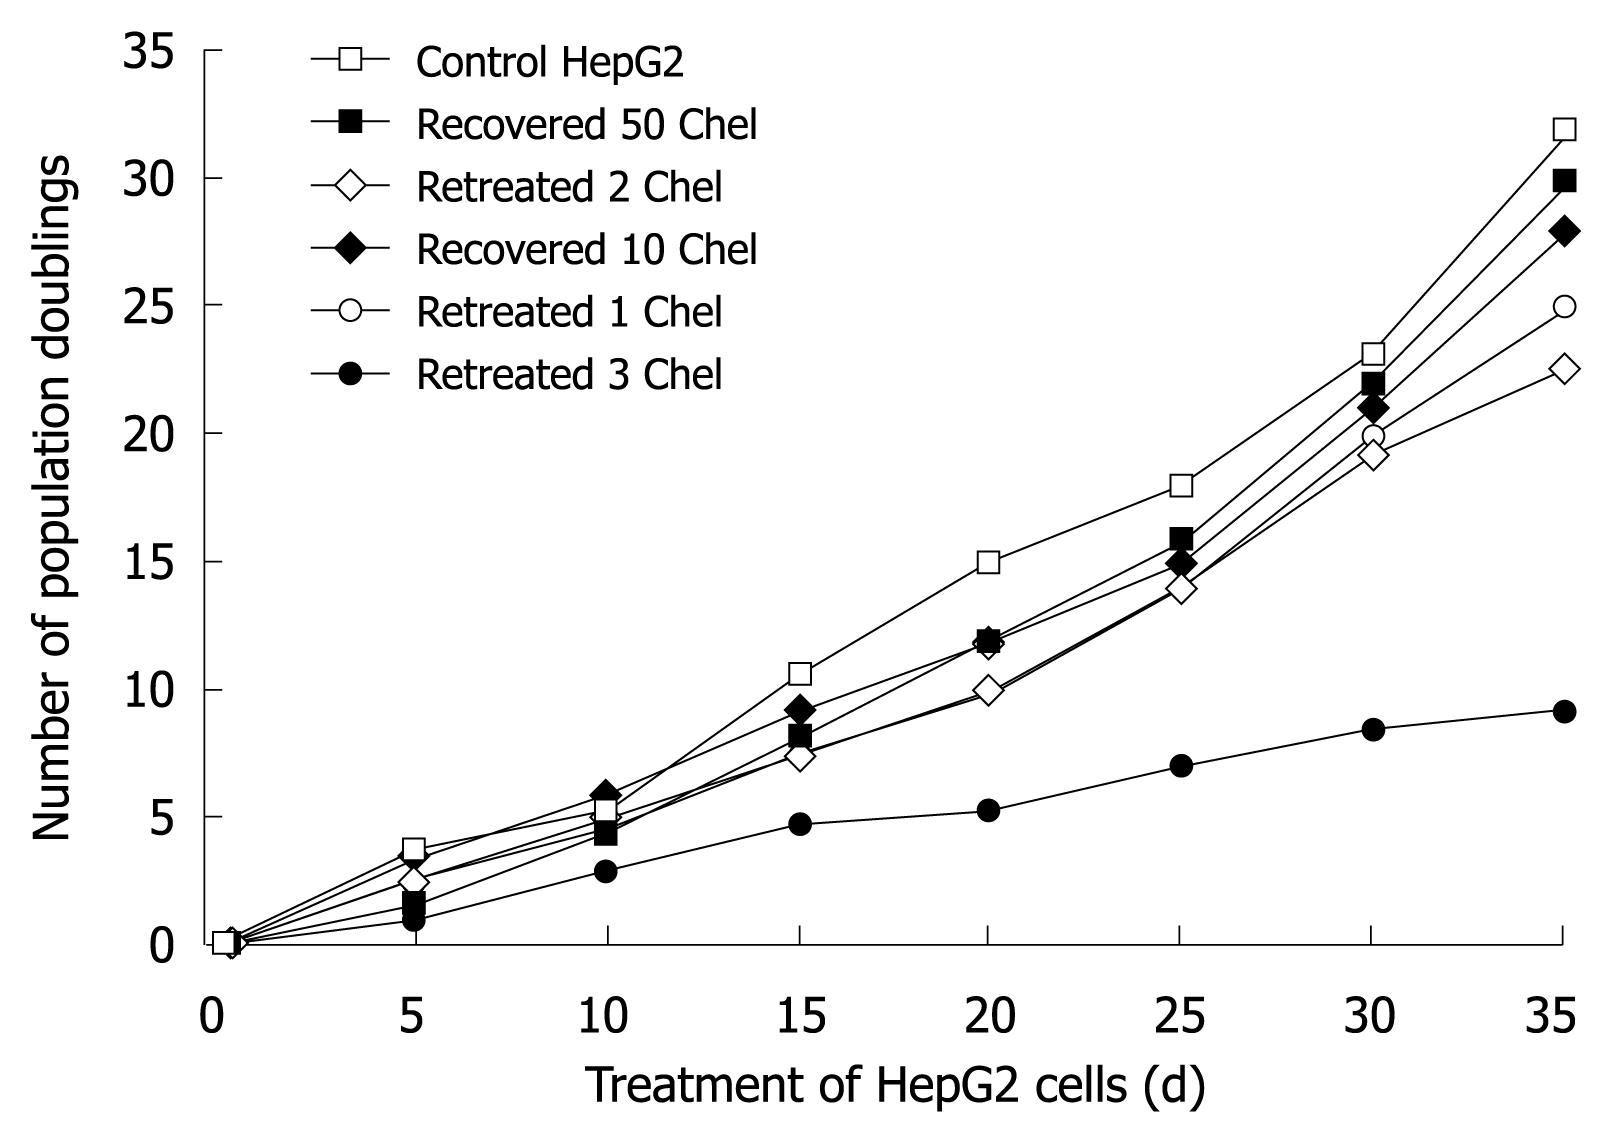
Figure 6 Number of population doublings after long-term treatment with a sub-apoptotic dose of chelidonine (0.
1 &mgr;mol/L) or recovered cells after 48 h exposure to LD50 concentration of chelidonine in comparison with control HepG2 cells. In re-treatment experiments (long-term treatment) HepG2 cells were exposed to 0.1 &mgr;mol/L only 48 h in each passage and followed by recovery with normal medium devoid of chelidonine. Each point indicates the mean value of a duplicated experiment.
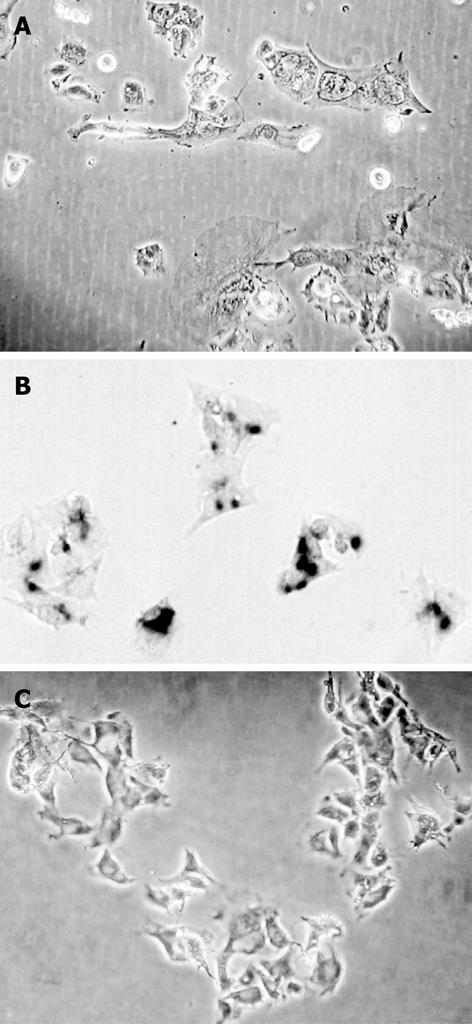
Figure 7 The morphological changes and induction of senescence in HepG2 cells in a long-term treatment experiment.
A: HepG2 cells after treatment five times with 0.1 &mgr;mol/L chelidonine; B: Cells retreated five times stained for β-galactosidase activity; C: Stained control cells.
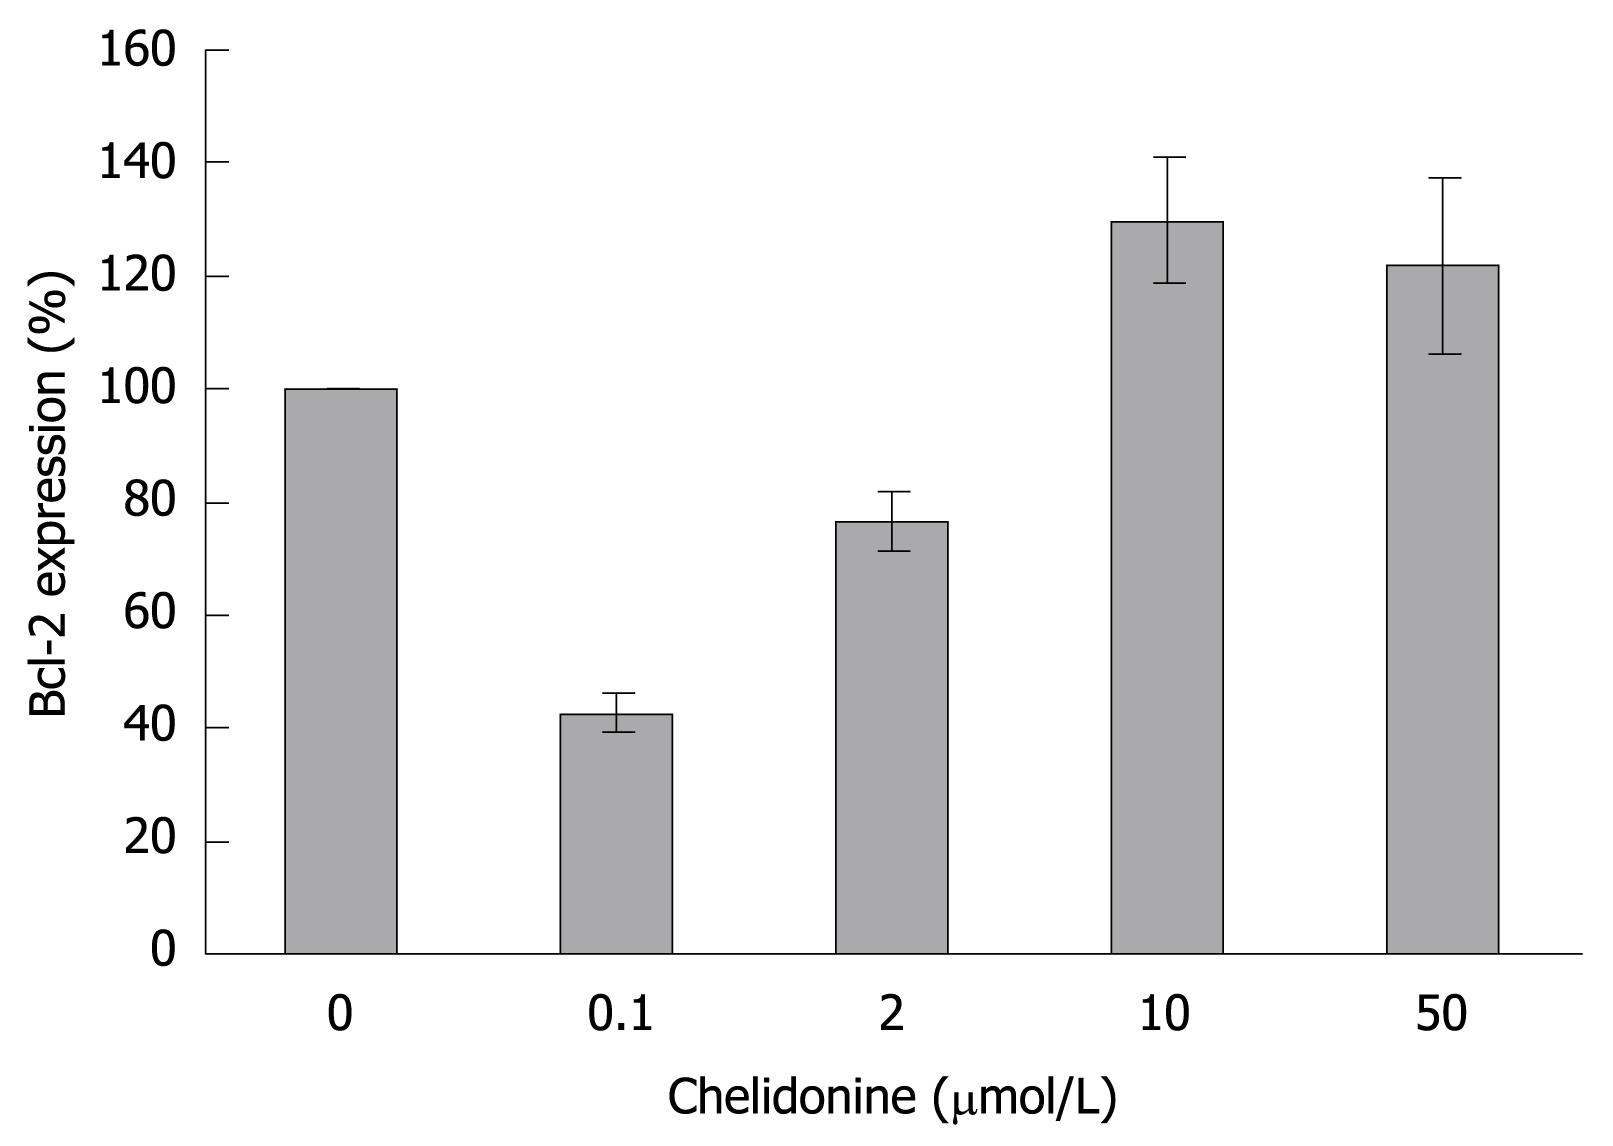
Figure 8 Relative expression of Bcl-2 gene in HepG2 cells after 48 h treatment with different concentrations of chelidonine in relation to untreated control cells assessed by real-time RT-PCR and calibrated with β2-microglobulin gene expression.
The expression level of Bcl-2 in control cells was considered as 100%. mean ± SD are indicated (n = 3).
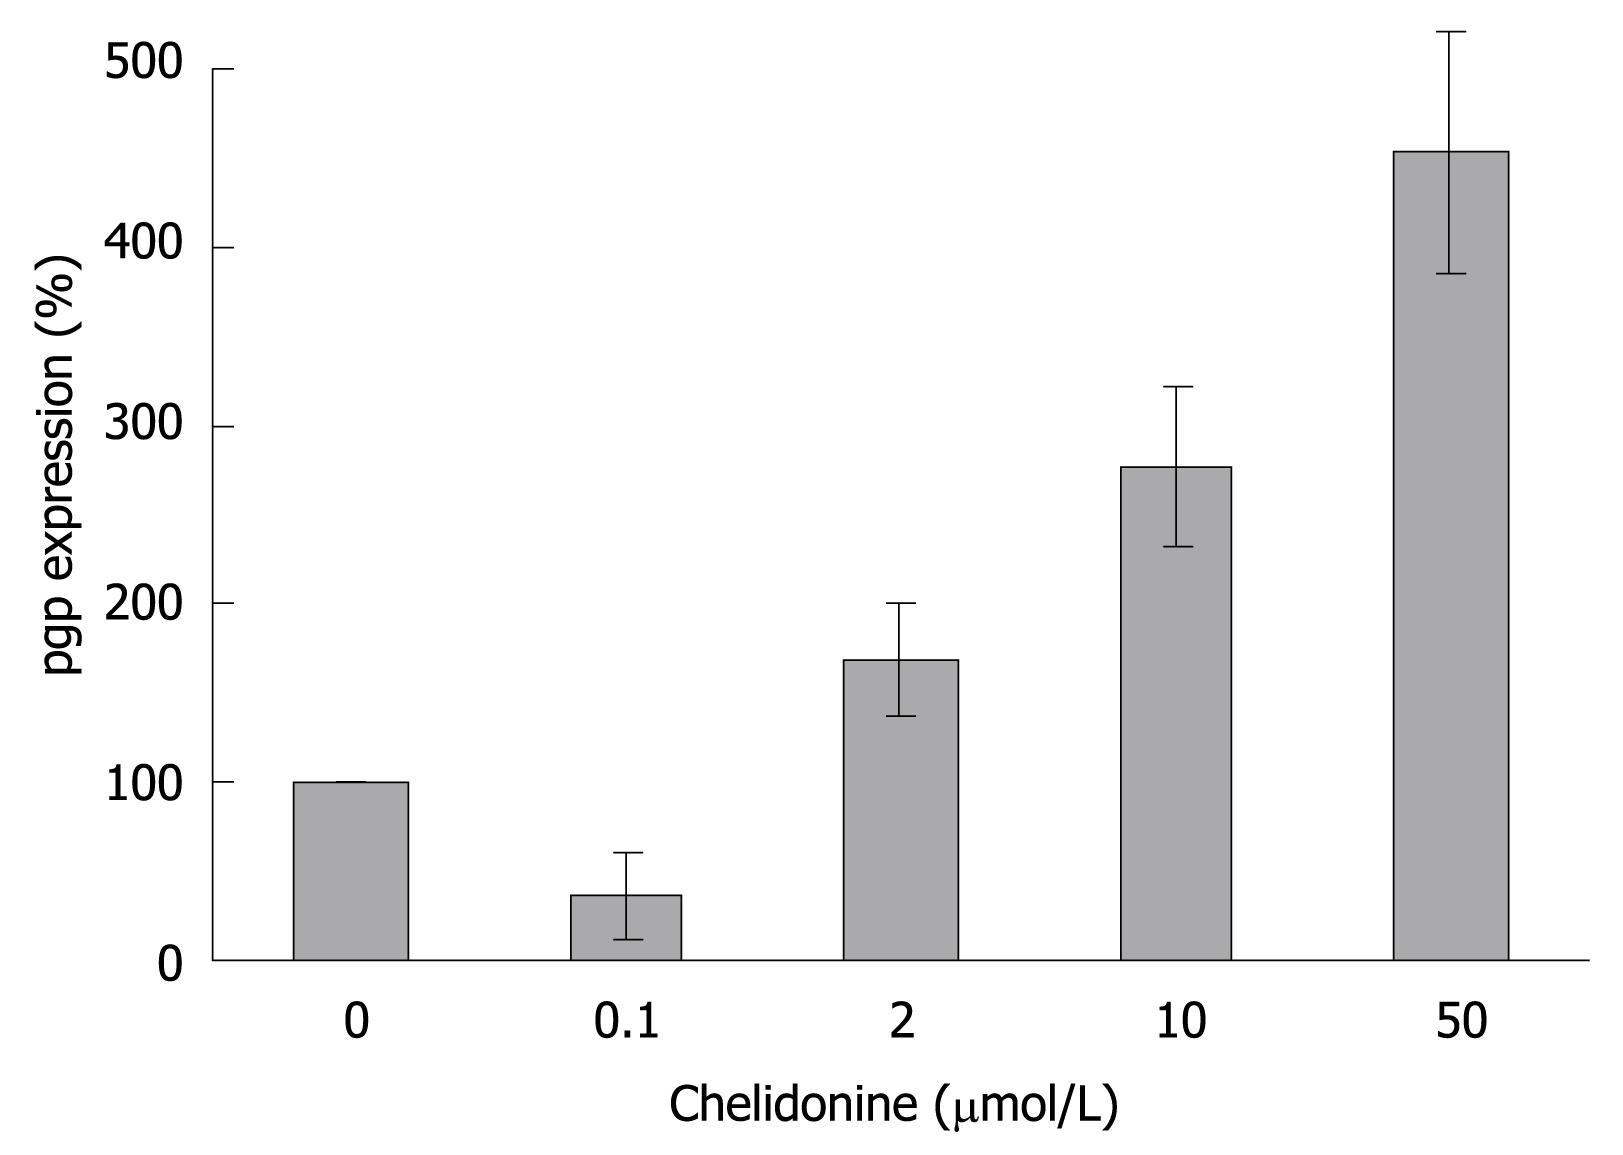
Figure 9 Relative expression level of P-glycoprotein in HepG2 cells 48 h after treatment with different concentrations of chelidonine.
Each bar indicates the mean ± SD (n = 3).
- Citation: Kazemi Noureini S, Wink M. Transcriptional down regulation of hTERT and senescence induction in HepG2 cells by chelidonine. World J Gastroenterol 2009; 15(29): 3603-3610
- URL: https://www.wjgnet.com/1007-9327/full/v15/i29/3603.htm
- DOI: https://dx.doi.org/10.3748/wjg.15.3603


