Copyright
©2009 The WJG Press and Baishideng.
World J Gastroenterol. Jul 21, 2009; 15(27): 3355-3366
Published online Jul 21, 2009. doi: 10.3748/wjg.15.3355
Published online Jul 21, 2009. doi: 10.3748/wjg.15.3355
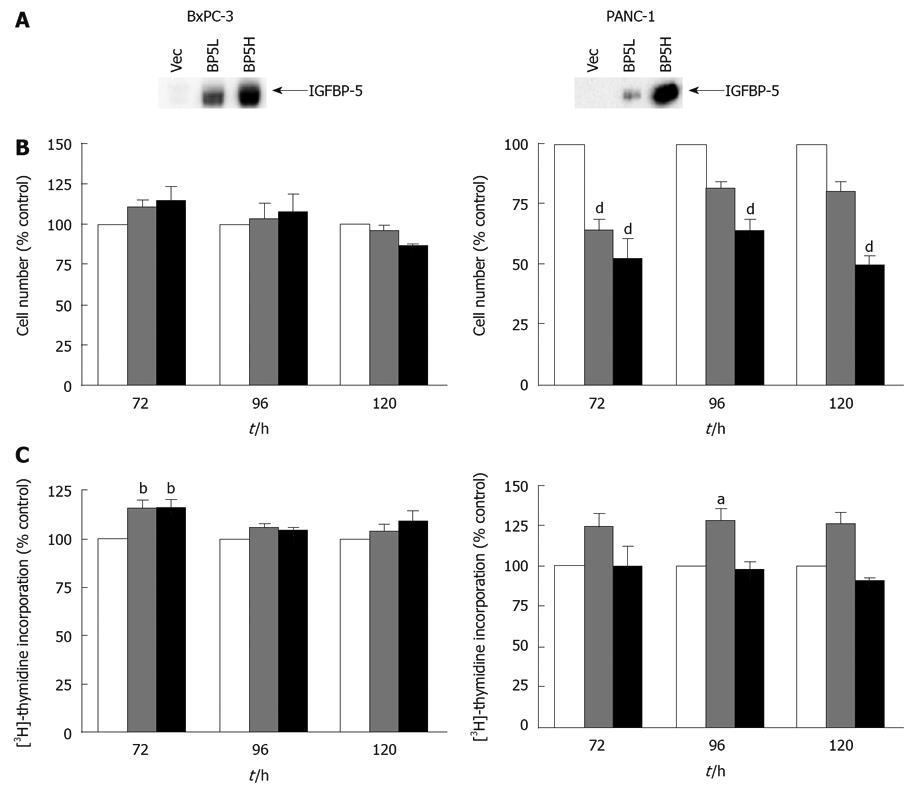
Figure 1 Effect of IGFBP-5 expression on PaC cells grown in the presence of serum.
Stable transfectants (empty vector /Vec-white bar, low /IGFBP-5L-gray bar, high/IGFBP-5H-black bar) were seeded in growth media. (A) IGFBP-5 expression was verified by immunoblot analysis of secreted IGFBP-5 after 24 h growth in SFM and concentration of conditioned medium. Cell counts (B) and thymidine incorporation (C) were determined at 72, 96 and 120 h post-seeding. Data shown represent the mean ± SE of IGFBP-5-transfected cell growth relative to vector-transfected controls (100%) from 3-5 separate experiments performed in duplicate. aP < 0.05, bP < 0.01, dP < 0.001.
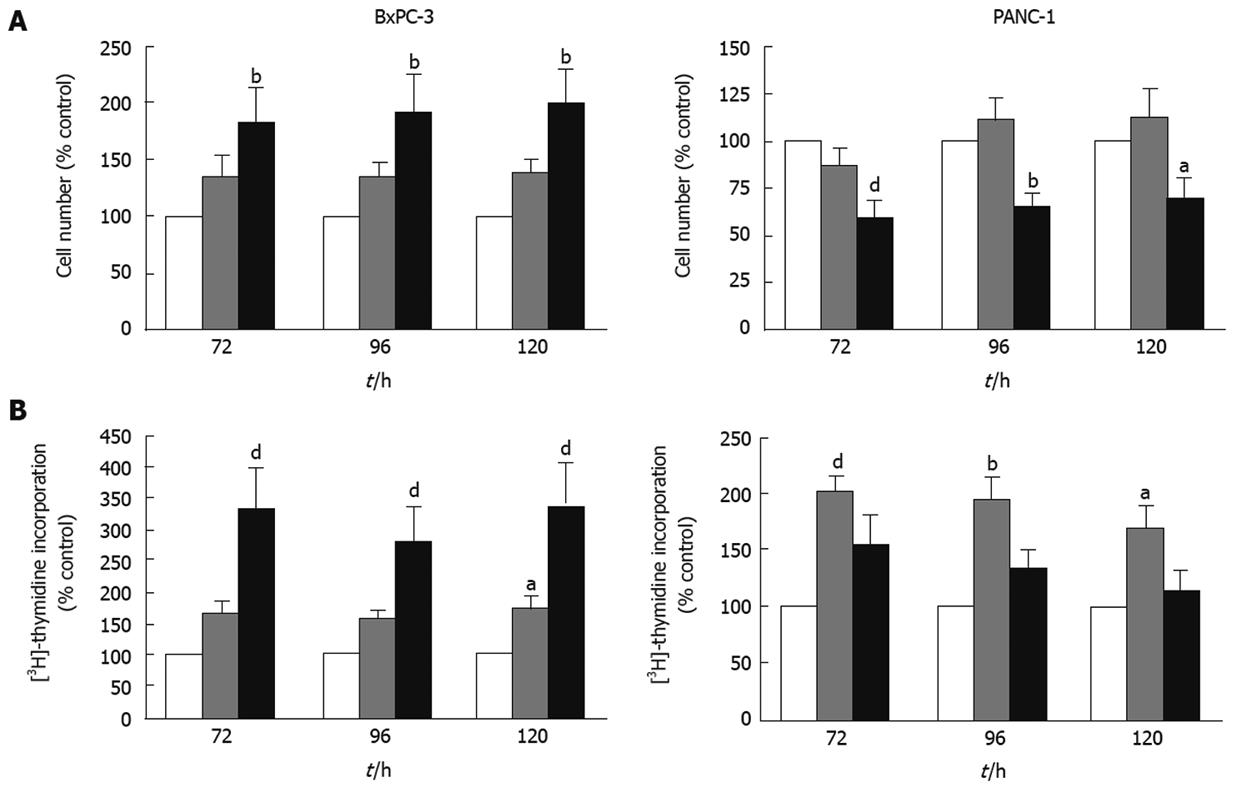
Figure 2 Effect of IGFBP-5 expression on PaC cells grown in the absence of serum.
Stable transfectants (empty vector/Vec-white bar, low/IGFBP-5L-gray bar, high/IGFBP-5H-black bar) were seeded in growth media for 24 h then switched to serum-free medium (SFM) for the remainder of the growth period. Cell counts (A) or thymidine incorporation (B) were determined at 72, 96 and 120 h post-seeding. Data shown represent the mean ± SE of IGFBP-5-transfected cell growth relative to vector-transfected controls (100%) from 3-5 separate experiments performed in duplicate. aP < 0.05, bP < 0.01, dP < 0.001.
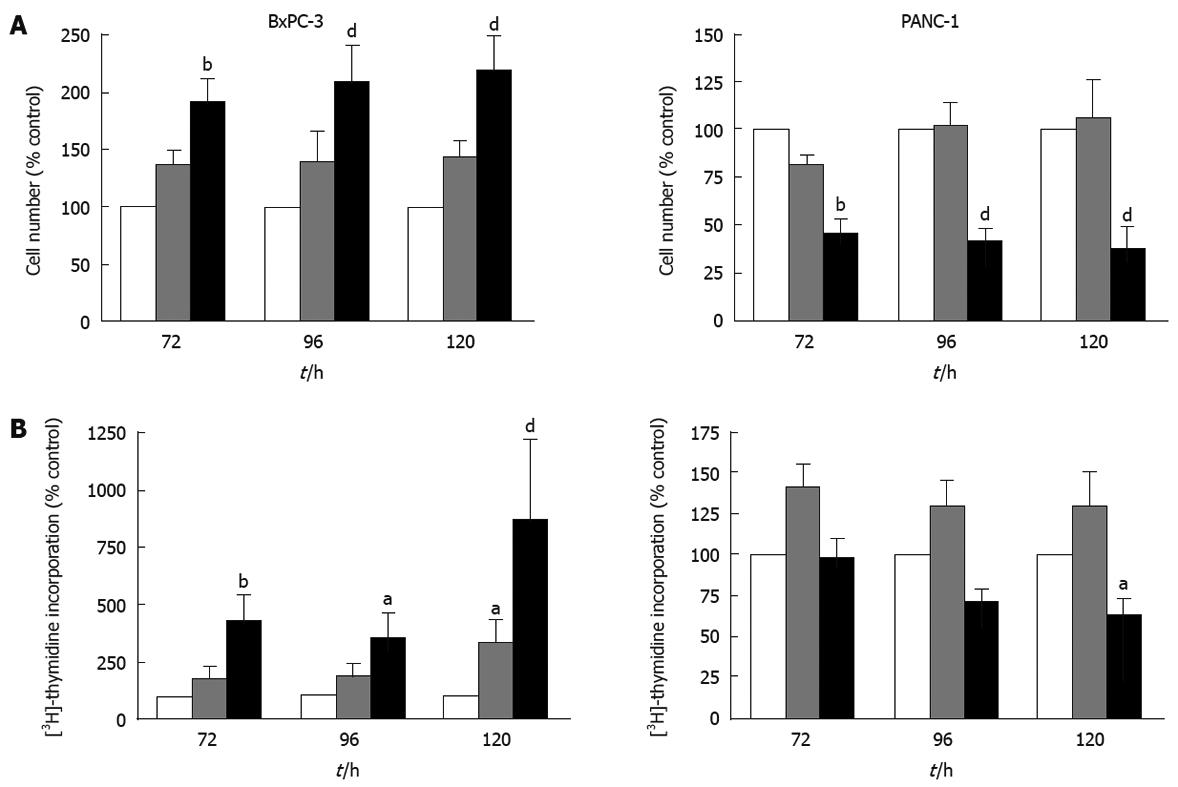
Figure 3 Effect of IGFBP-5 expression on PaC cells grown with daily changes of SFM.
Stable transfectants (empty vector/Vec-white bar, low/IGFBP-5L-gray bar, high/IGFBP-5H-black bar) were seeded in growth media for 24 h and switched to SFM, which was replaced every 24 h for the remainder of the growth period. Cell counts (A) and thymidine incorporation (B) were determined at 72, 96 and 120 h post-seeding. Data shown represent the mean ± SE of IGFBP-5-transfected cell growth relative to vector-transfected controls (100%) from 3-5 separate experiments performed in duplicate. aP < 0.05, bP < 0.01, dP < 0.001.
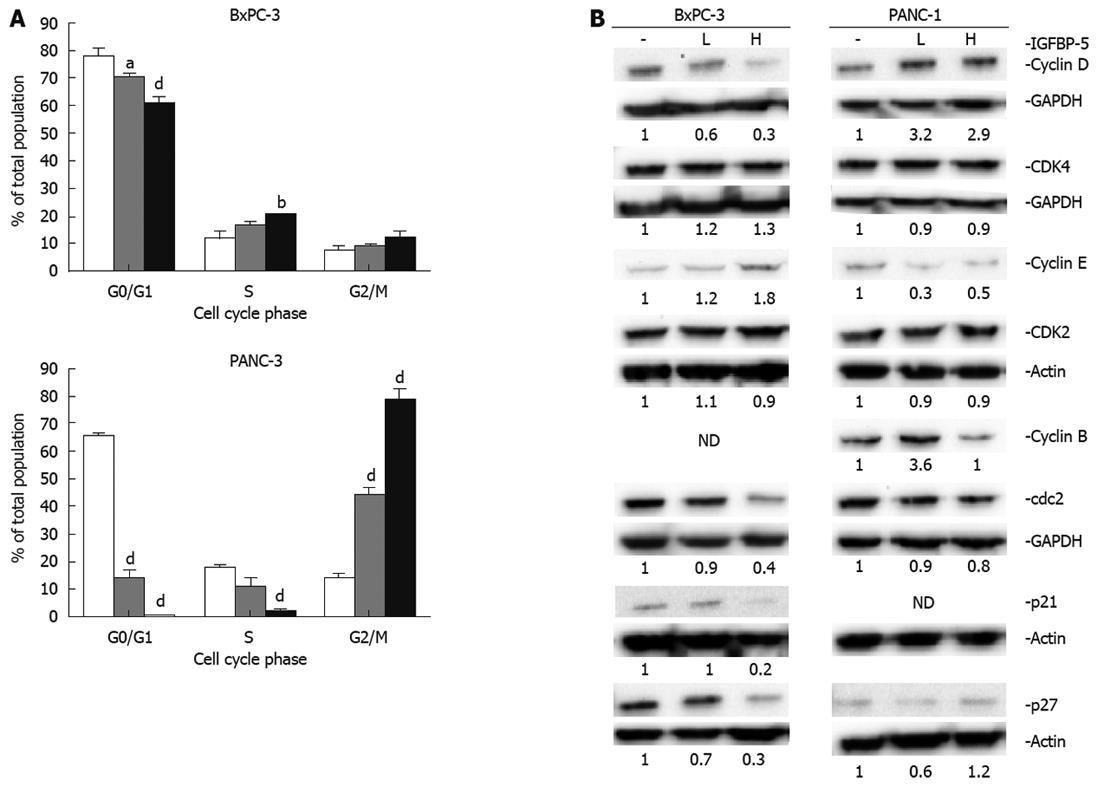
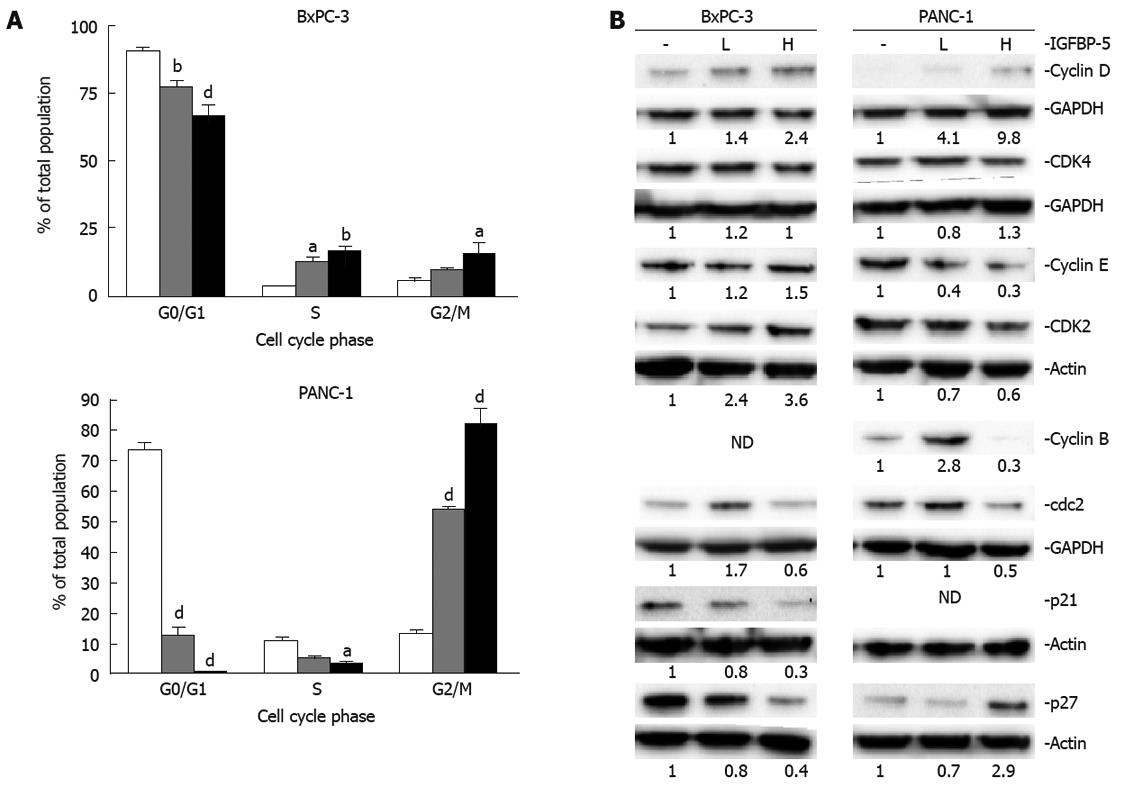
Figure 4 Cell cycle distribution of PaC cells that overexpress IGFBP-5 grown in the presence of serum.
Stable transfectants (empty vector/Vec-white bar, low/IGFBP-5L-gray bar, high /IGFBP-5H-black bar) were seeded in growth media. After 24 h, the medium was removed and replaced with fresh growth media for 48 h. (A) Cell cycle distribution was determined by propidium iodide staining and FACS analysis. Data shown represent the mean ± SE from 3 experiments performed in duplicate. (B) Cell lysates were prepared for immunoblot analysis of cell cycle regulators and their expression was detected using the appropriate antisera. Membranes were subsequently stripped and reprobed for actin or GAPDH as a load control. Analyses of cyclin E/cdk2 and cyclin B/cdc2 expression were performed simultaneously, therefore, only a single load control, actin or GAPDH, respectively, is shown for each pair. Quantitation of band density represents the level of IGFBP-5-associated expression relative to vector-transfected controls (1.0) normalized to the expression level of actin. ND: Not detected. The results are representative of 3 experiments. aP < 0.05, bP < 0.01, dP < 0.001.
Figure 5 Cell cycle distribution of PaC cells that overexpress IGFBP-5 grown in the absence of serum.
Stable transfectants (empty vector/Vec-white bar, low/IGFBP-5L-gray bar, high /IGFBP-5H-black bar) were seeded in growth media. After 24 h, the medium was changed to SFM for 48 h; A: Cell cycle distribution was determined by propidium iodide staining and FACS analysis. Data shown represent the mean ± SE from 3 separate experiments performed in duplicate. B: Cell lysates were prepared for immunoblot analysis of cell cycle regulators and their expression was detected using the appropriate antisera. Membranes were subsequently stripped and reprobed for actin or GAPDH as a load control. Analyses of cyclin E/cdk2 and cyclin B/cdc2 expression were performed simultaneously, therefore, only a single load control, actin or GAPDH, respectively, is shown for each pair. Quantitation of band density represents the level of IGFBP-5 associated expression relative to vector-transfected controls (1.0) normalized to the expression level of actin. ND: Not detected. The results are representative of 3 experiments. aP < 0.05, bP < 0.01, dP < 0.001.
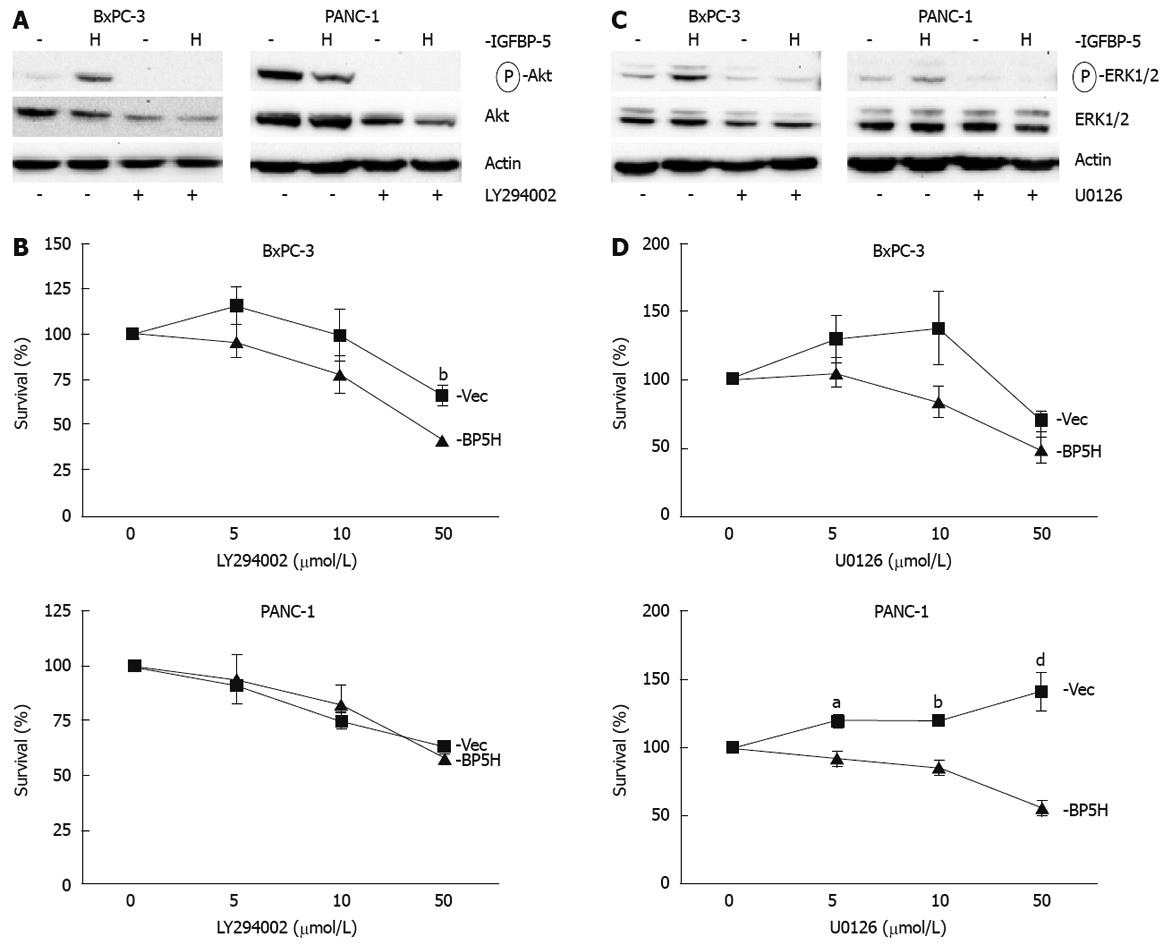
Figure 6 PI3K or MEK1/2 inhibition decreases IGFBP-5-enhanced growth of serum-starved PaC cells.
Stable transfectants (empty vector/Vec-closed square or high /BP5H-closed triangle) were seeded in growth media. The serum-containing medium was changed to SFM 24 h post-seeding. After 24 h in serum-free conditions, a PI3K inhibitor (LY294002, A and B) or MEK1/2 inhibitor (U0126, C and D) was added to the medium. After 48 h, an MTT assay (B and D) was performed to assess cell viability. Cell lysates were prepared at this time for immunoblot analysis of Akt or ERK1/2 activation (A and C, respectively) using phospho-specific antibodies. For immunoblots, cells were treated with 25 &mgr;mol/L LY294002 or 10 &mgr;mol/L U0126, as indicated. Membranes were subsequently stripped and reprobed for total Akt or ERK1/2 (A and C, respectively). Actin level was monitored to normalize protein loading. Data shown represent the mean ± SE from 4 separate experiments performed in triplicate. The percentage of viable cells was determined relative to control-treated cells (100%). aP < 0.05, bP < 0.01, dP < 0.001.
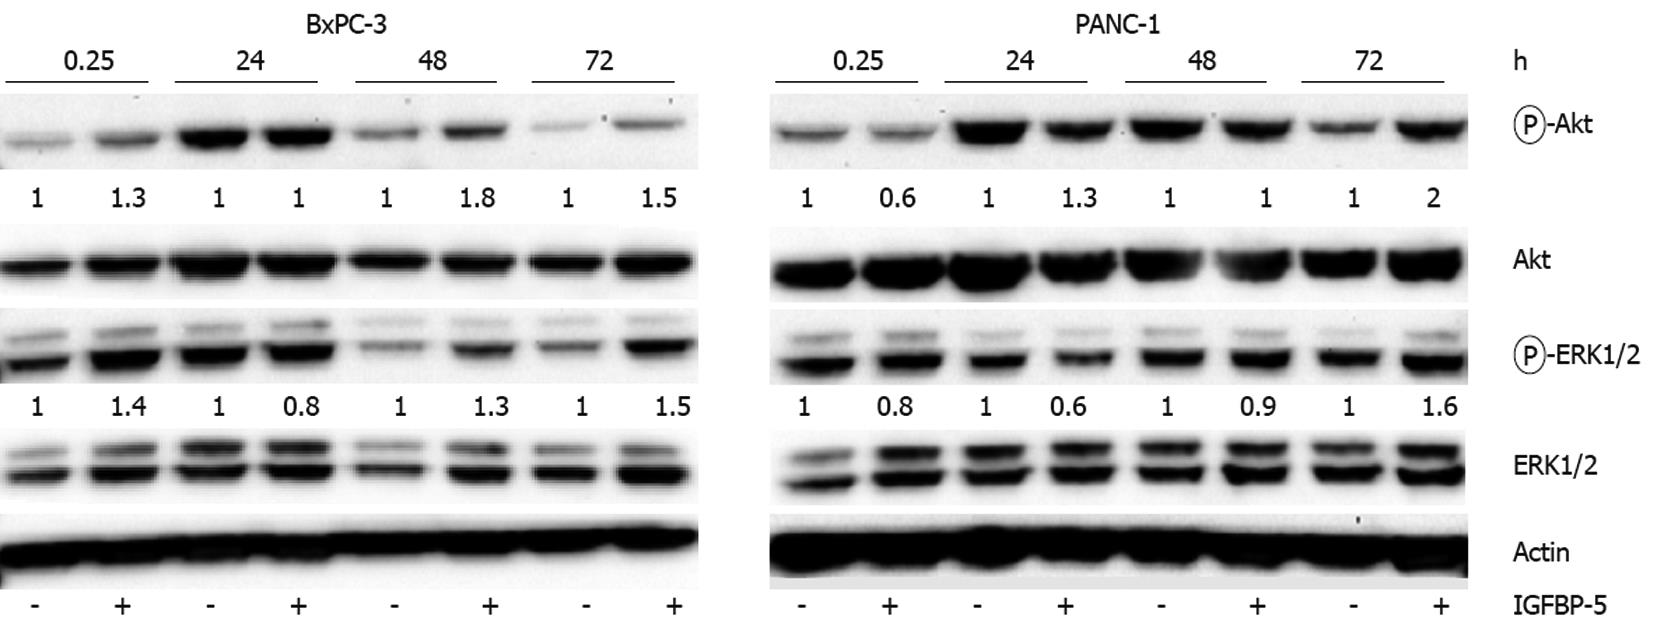
Figure 7 IGFBP-5-conditioned medium enhances activation of Akt and ERK1/2 in PaC cells.
IGFBP-5- (+) or vector-transfected (-) control cells were grown for 48 h in SFM. Conditioned medium was collected and applied to BxPC-3 or PANC-1 cells for indicated times. Cell lysates were prepared and immunoblot analysis of phosphorylated Akt or ERK1/2 was performed. Membranes were subsequently stripped and reprobed for total Akt or ERK1/2. Actin level was monitored to normalize protein loading. Quantitation of band density represents the level of IGFBP-5-associated expression relative to vector-transfected controls (1.0) normalized to the expression level of total Akt or ERK1/2. Results are representative of three independent experiments.
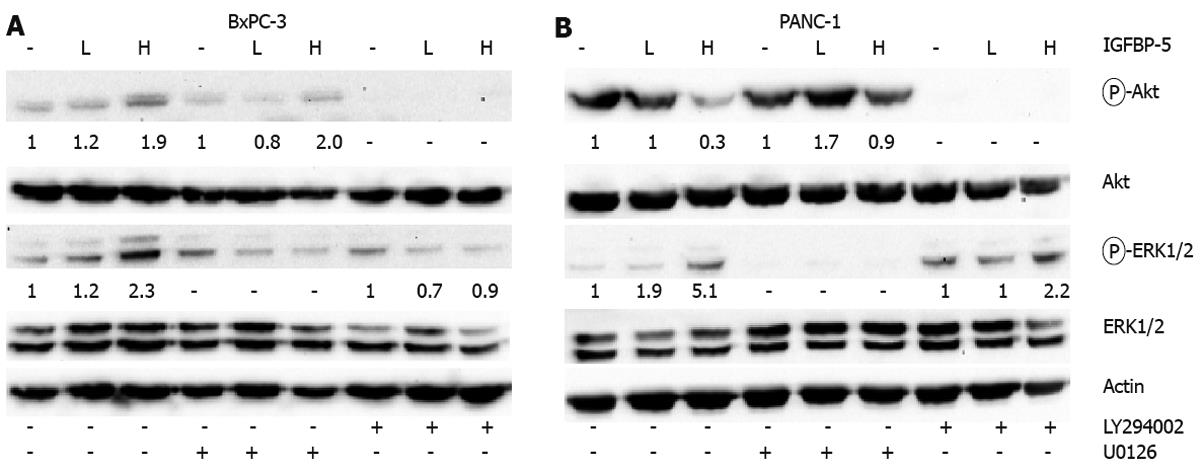
Figure 8 Effect of IGFBP-5 on signaling in serum-starved PaC cells.
BxPC-3 (A) and PANC-1 (B) stable transfectants [empty vector- (-), low IGFBP-5-L, or high IGFBP-5-H] were deprived of serum for 24 h then incubated in the presence of vehicle (DMSO), LY294002, or U0126 (10 &mgr;mol/L) for an additional 48 h. Cell lysates were prepared for immunoblot analysis of Akt or ERK1/2 activation using phospho-specific antibodies. Membranes were subsequently stripped and reprobed for total Akt or ERK1/2. Actin level was monitored to normalize protein loading. Quantitation of band density represents the level of IGFBP-5-associated expression relative to vector-transfected controls (1.0) normalized to the expression level of total Akt or ERK1/2. Results are representative of three independent experiments.
- Citation: Johnson SK, Haun RS. Insulin-like growth factor binding protein-5 influences pancreatic cancer cell growth. World J Gastroenterol 2009; 15(27): 3355-3366
- URL: https://www.wjgnet.com/1007-9327/full/v15/i27/3355.htm
- DOI: https://dx.doi.org/10.3748/wjg.15.3355


