Copyright
©2009 The WJG Press and Baishideng.
World J Gastroenterol. Jun 28, 2009; 15(24): 2987-2994
Published online Jun 28, 2009. doi: 10.3748/wjg.15.2987
Published online Jun 28, 2009. doi: 10.3748/wjg.15.2987
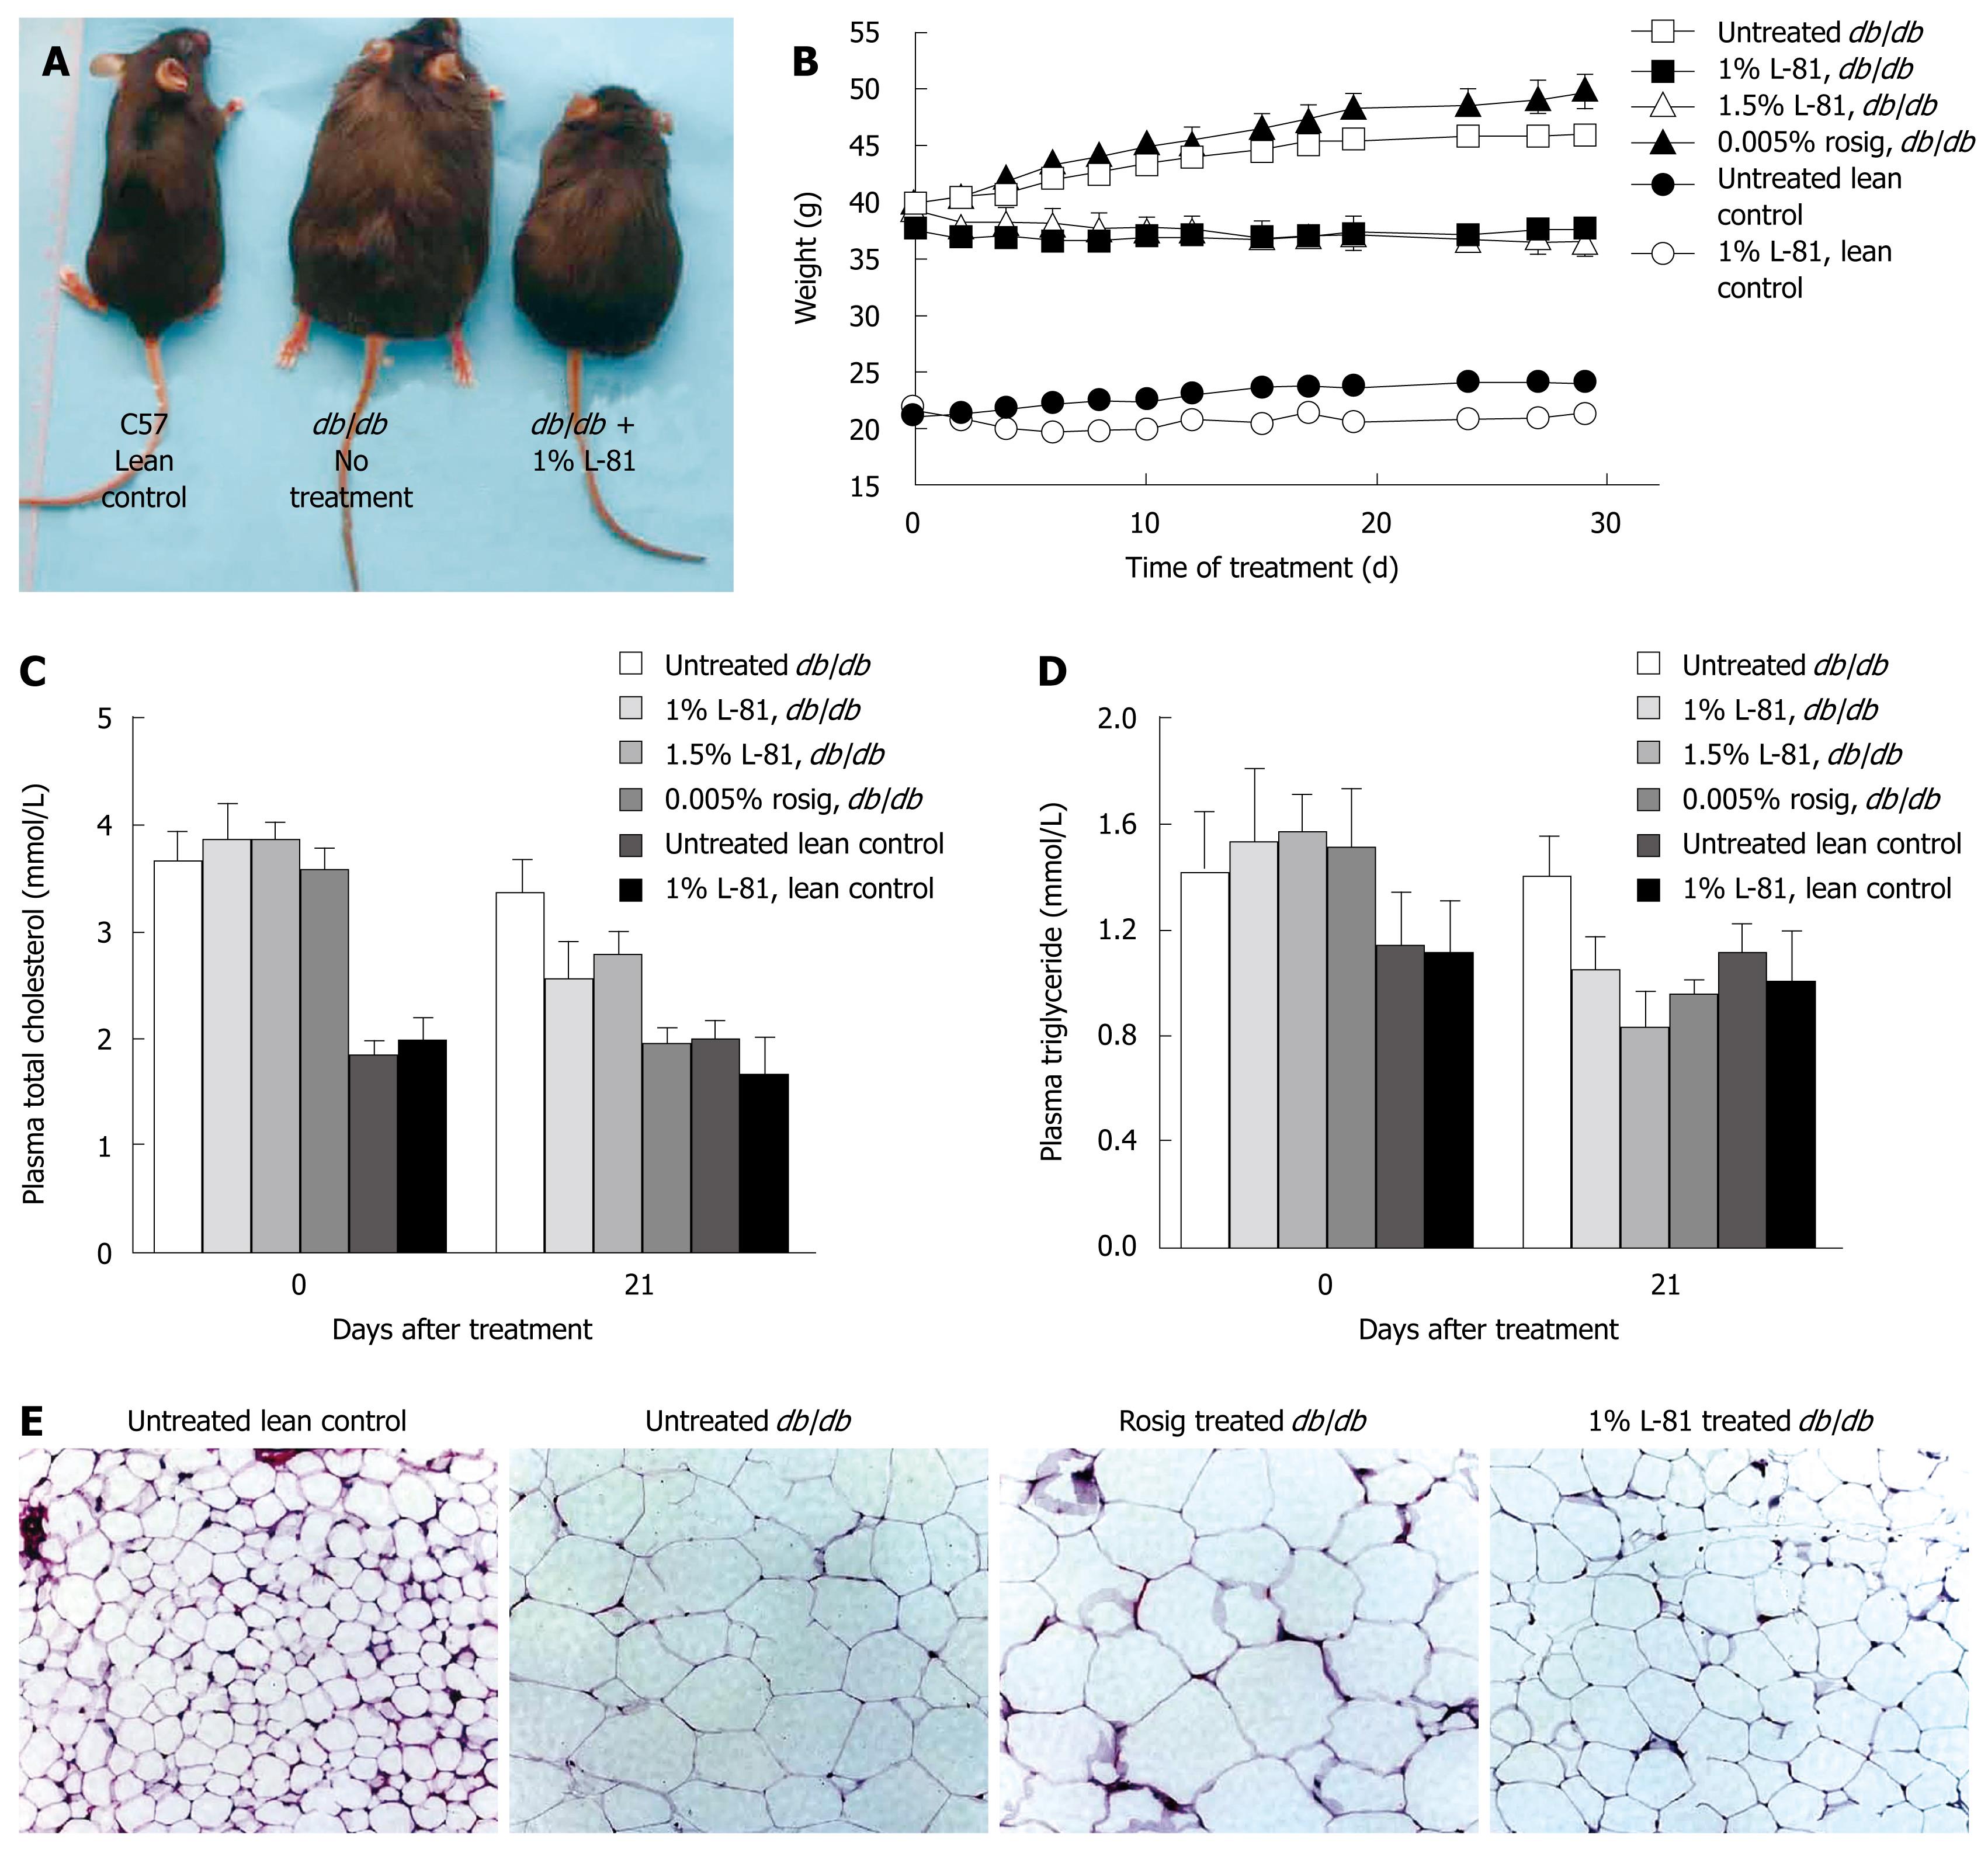
Figure 1 L-81 reduced obesity.
A: Body appearances of lean control (left), untreated db/db (middle), and db/db mice fed with chow sprayed with 1% L-81 (right); B: Weight of db/db mice or lean control mice receiving different drug treatments over an observation period of 30 d (n = 3 in each group); C: Plasma total cholesterol and (D) plasma triglyceride level of mice treated with the indicated drugs; E: The size of adipocytes in epididymal fat pads of mice treated with the indicated drugs as observed under 100 × magnification.
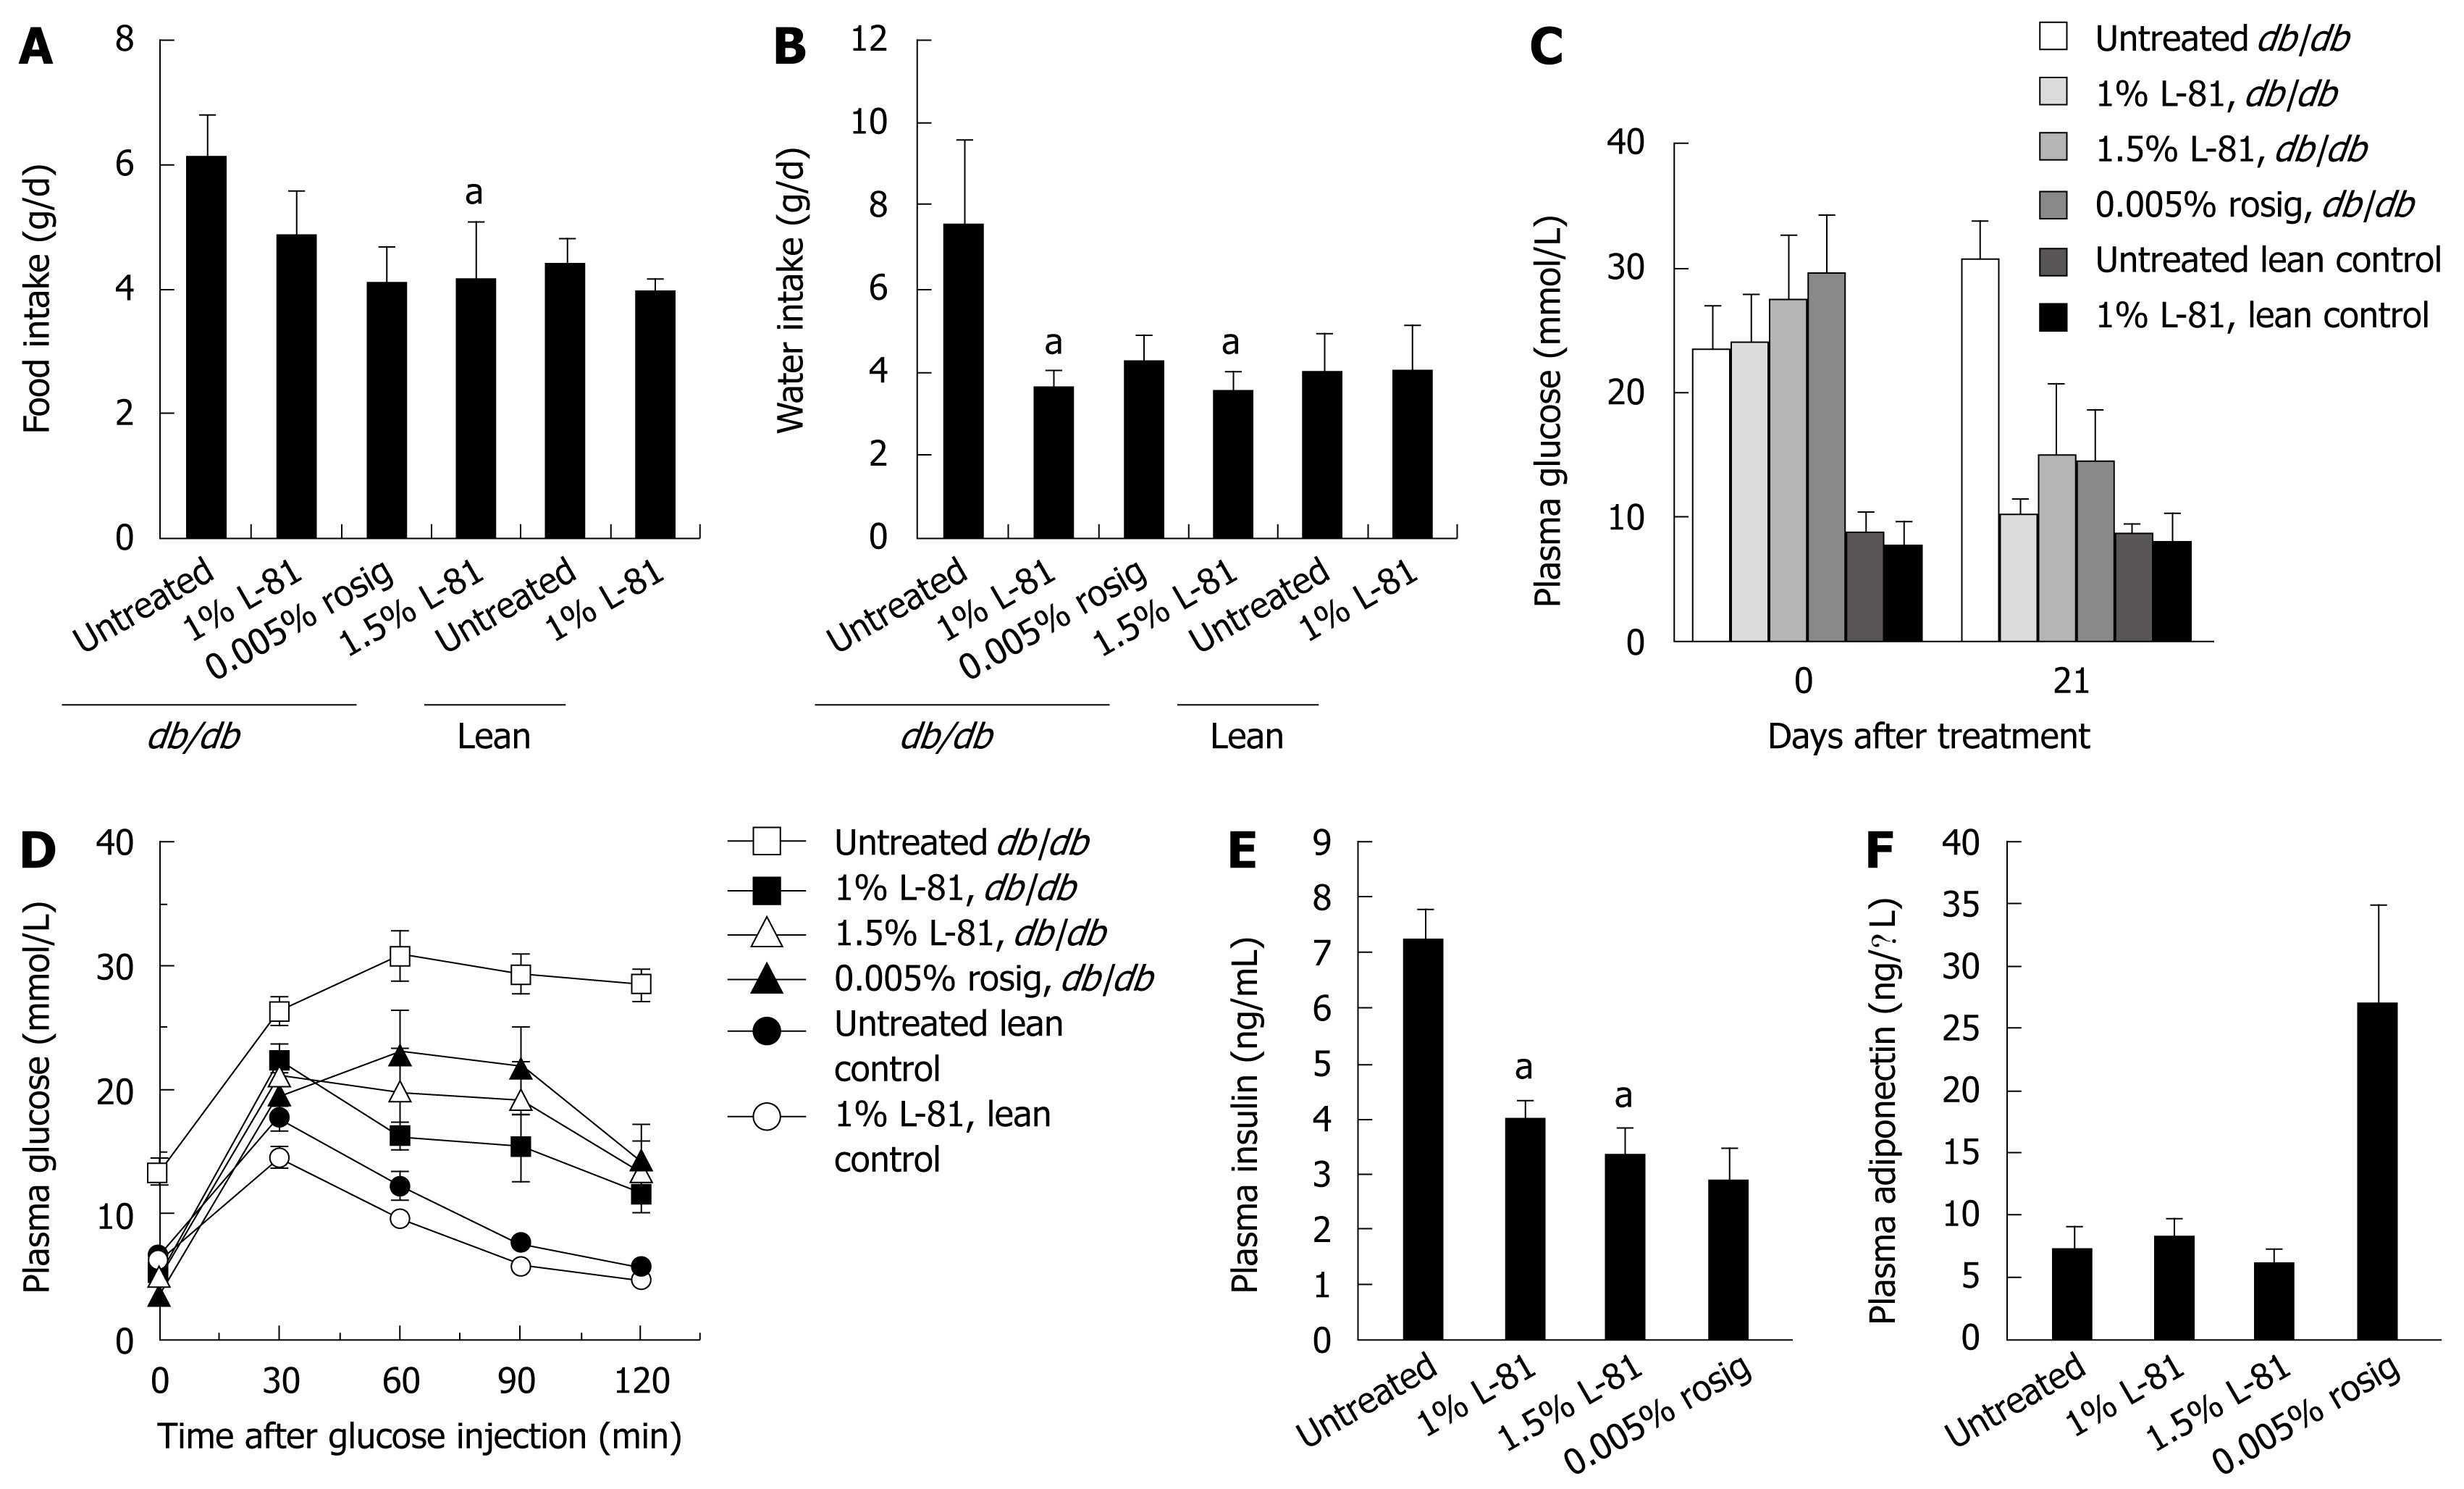
Figure 2 L-81 ameliorated diabetes.
A: Food intake and (B) water intake of mice fed on a chow diet, with or without the indicated drugs (n = 3 in each group). C: Fasting plasma glucose levels of lean control mice or db/db mice treated with L-81 or rosig before and after a 21 d treatment of the indicated drugs; D: Glucose tolerance of mice treated with the indicated drugs. Mice injected with glucose had their blood glucose level monitored by Onetouch Ultra Blood Glucose Monitoring system. E: Plasma insulin level of db/db mice treated with the indicated drugs for 4 wk; F: Plasma adiponectin level of db/db mice treated with the indicated drugs for 4 wk. aP < 0.05 compared with untreated control.
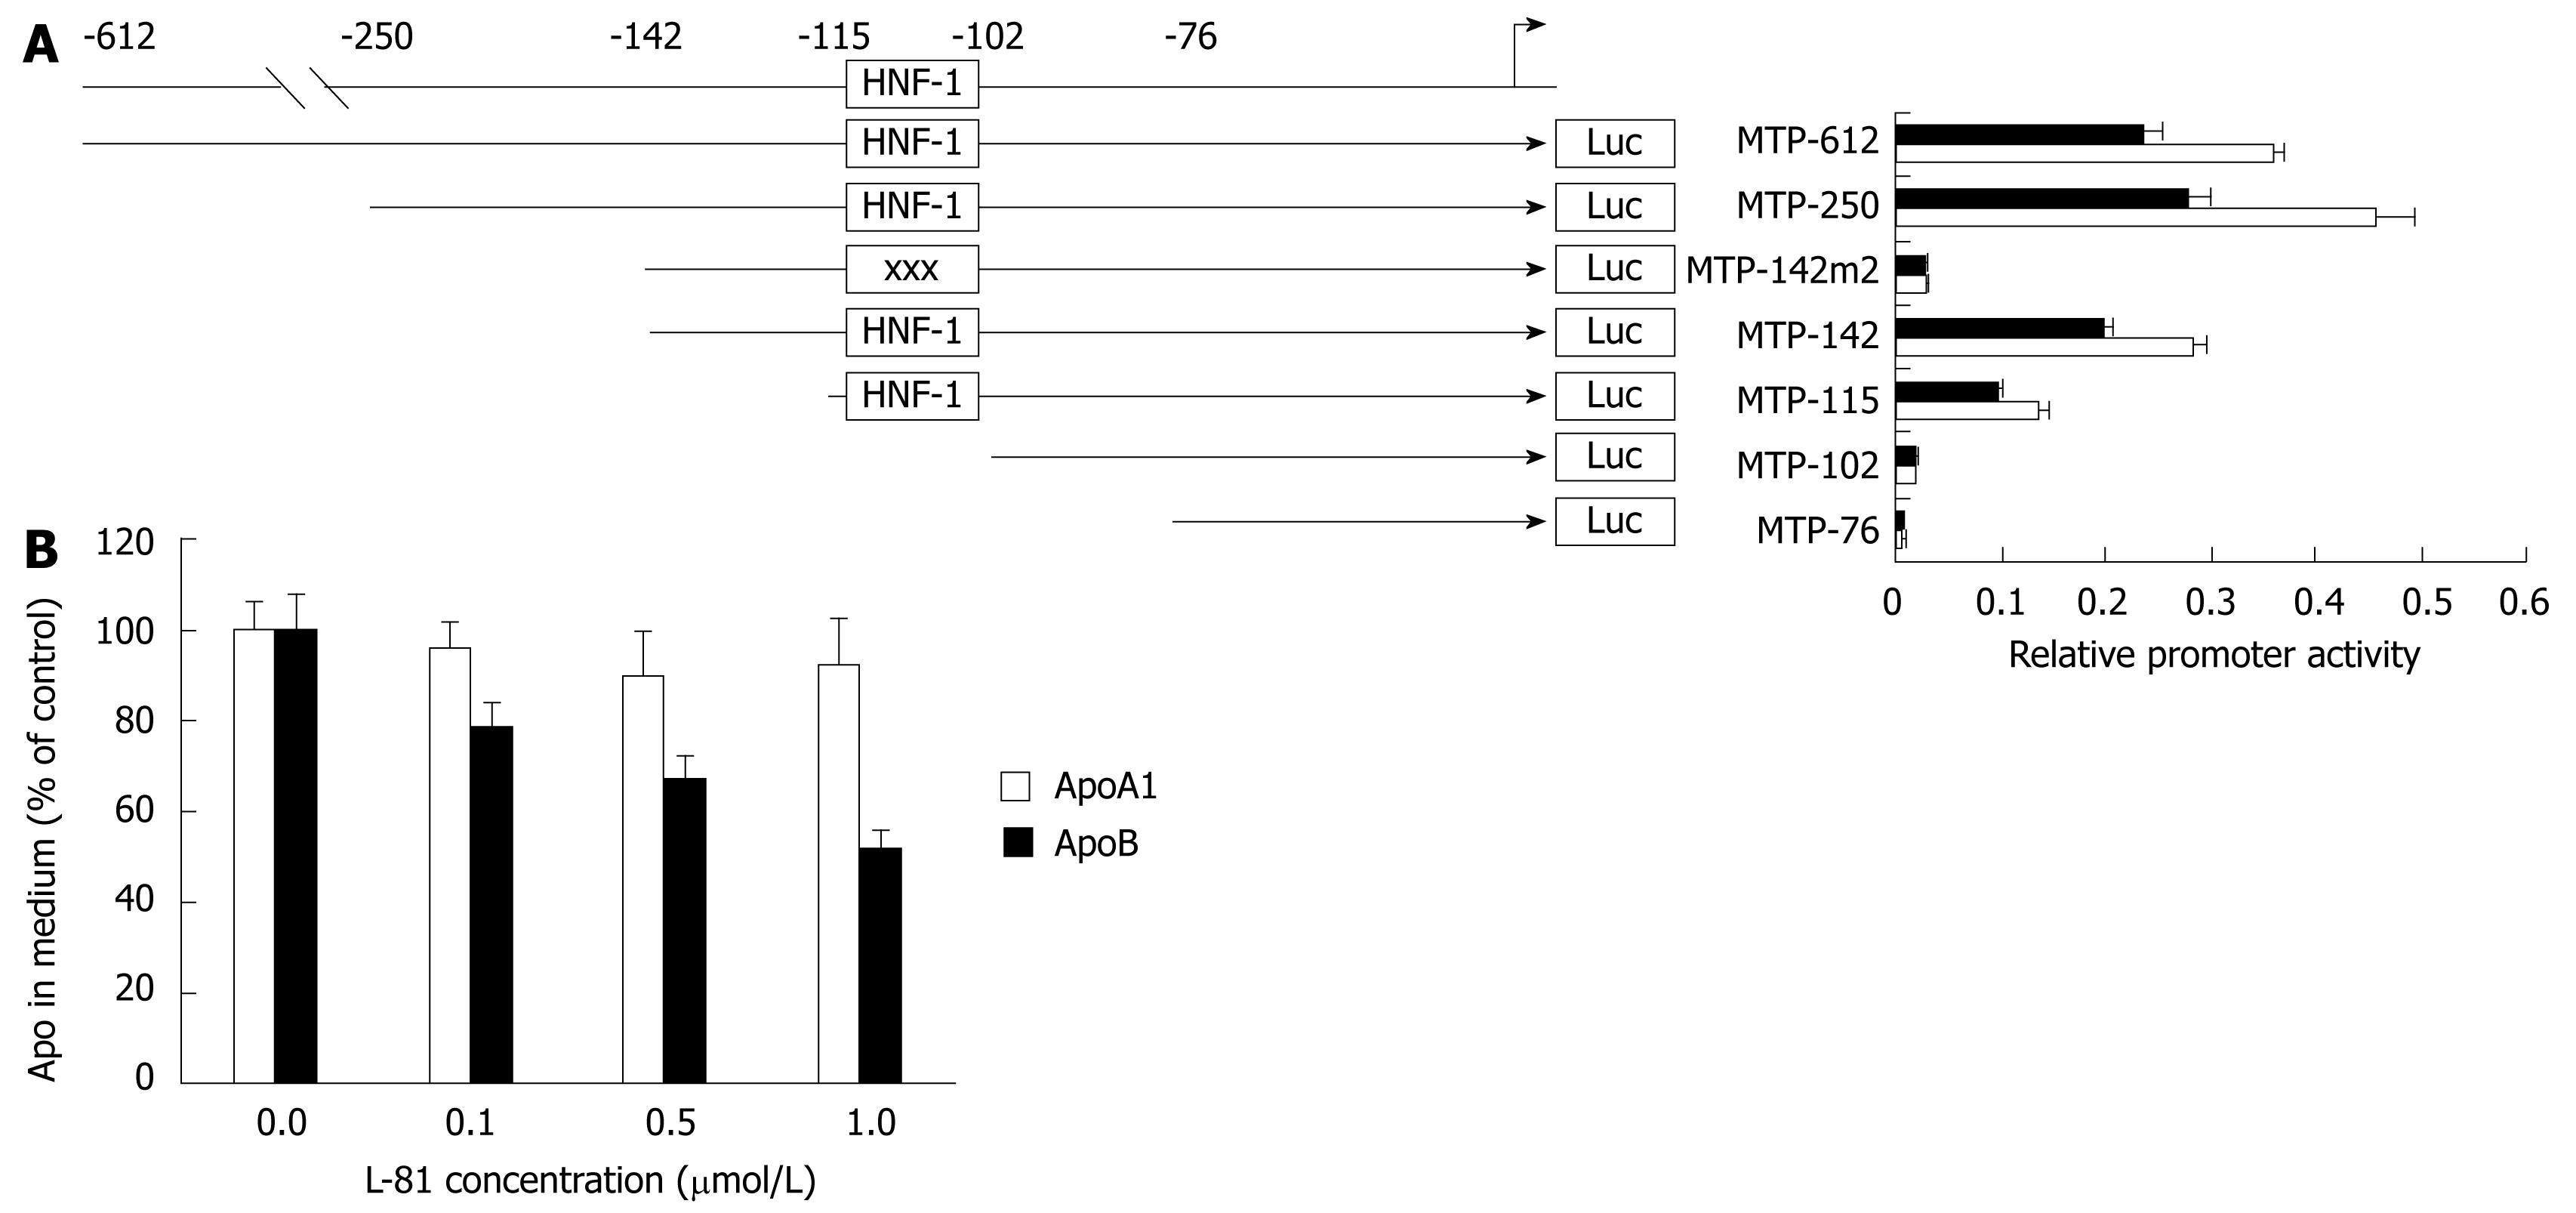
Figure 3 L-81 regulated MTP transcription.
A: The human MTP promoter was linked with luciferase reporter. Deletion or mutation constructs of MTP promoter-luciferase were transfected into HepG2 cells. The cells were treated with (black bars) or without (white bars) 1% L-81 in the medium. The luciferase activity in the cell lysate was measured. xxx = disabling mutations; B: L-81 inhibited apoB secretion in HepG2 cells. HepG2 cells were treated with the indicated concentration of L-81. The concentration of apoA-I and apoB in the culture medium were measured and normalized against the untreated control.
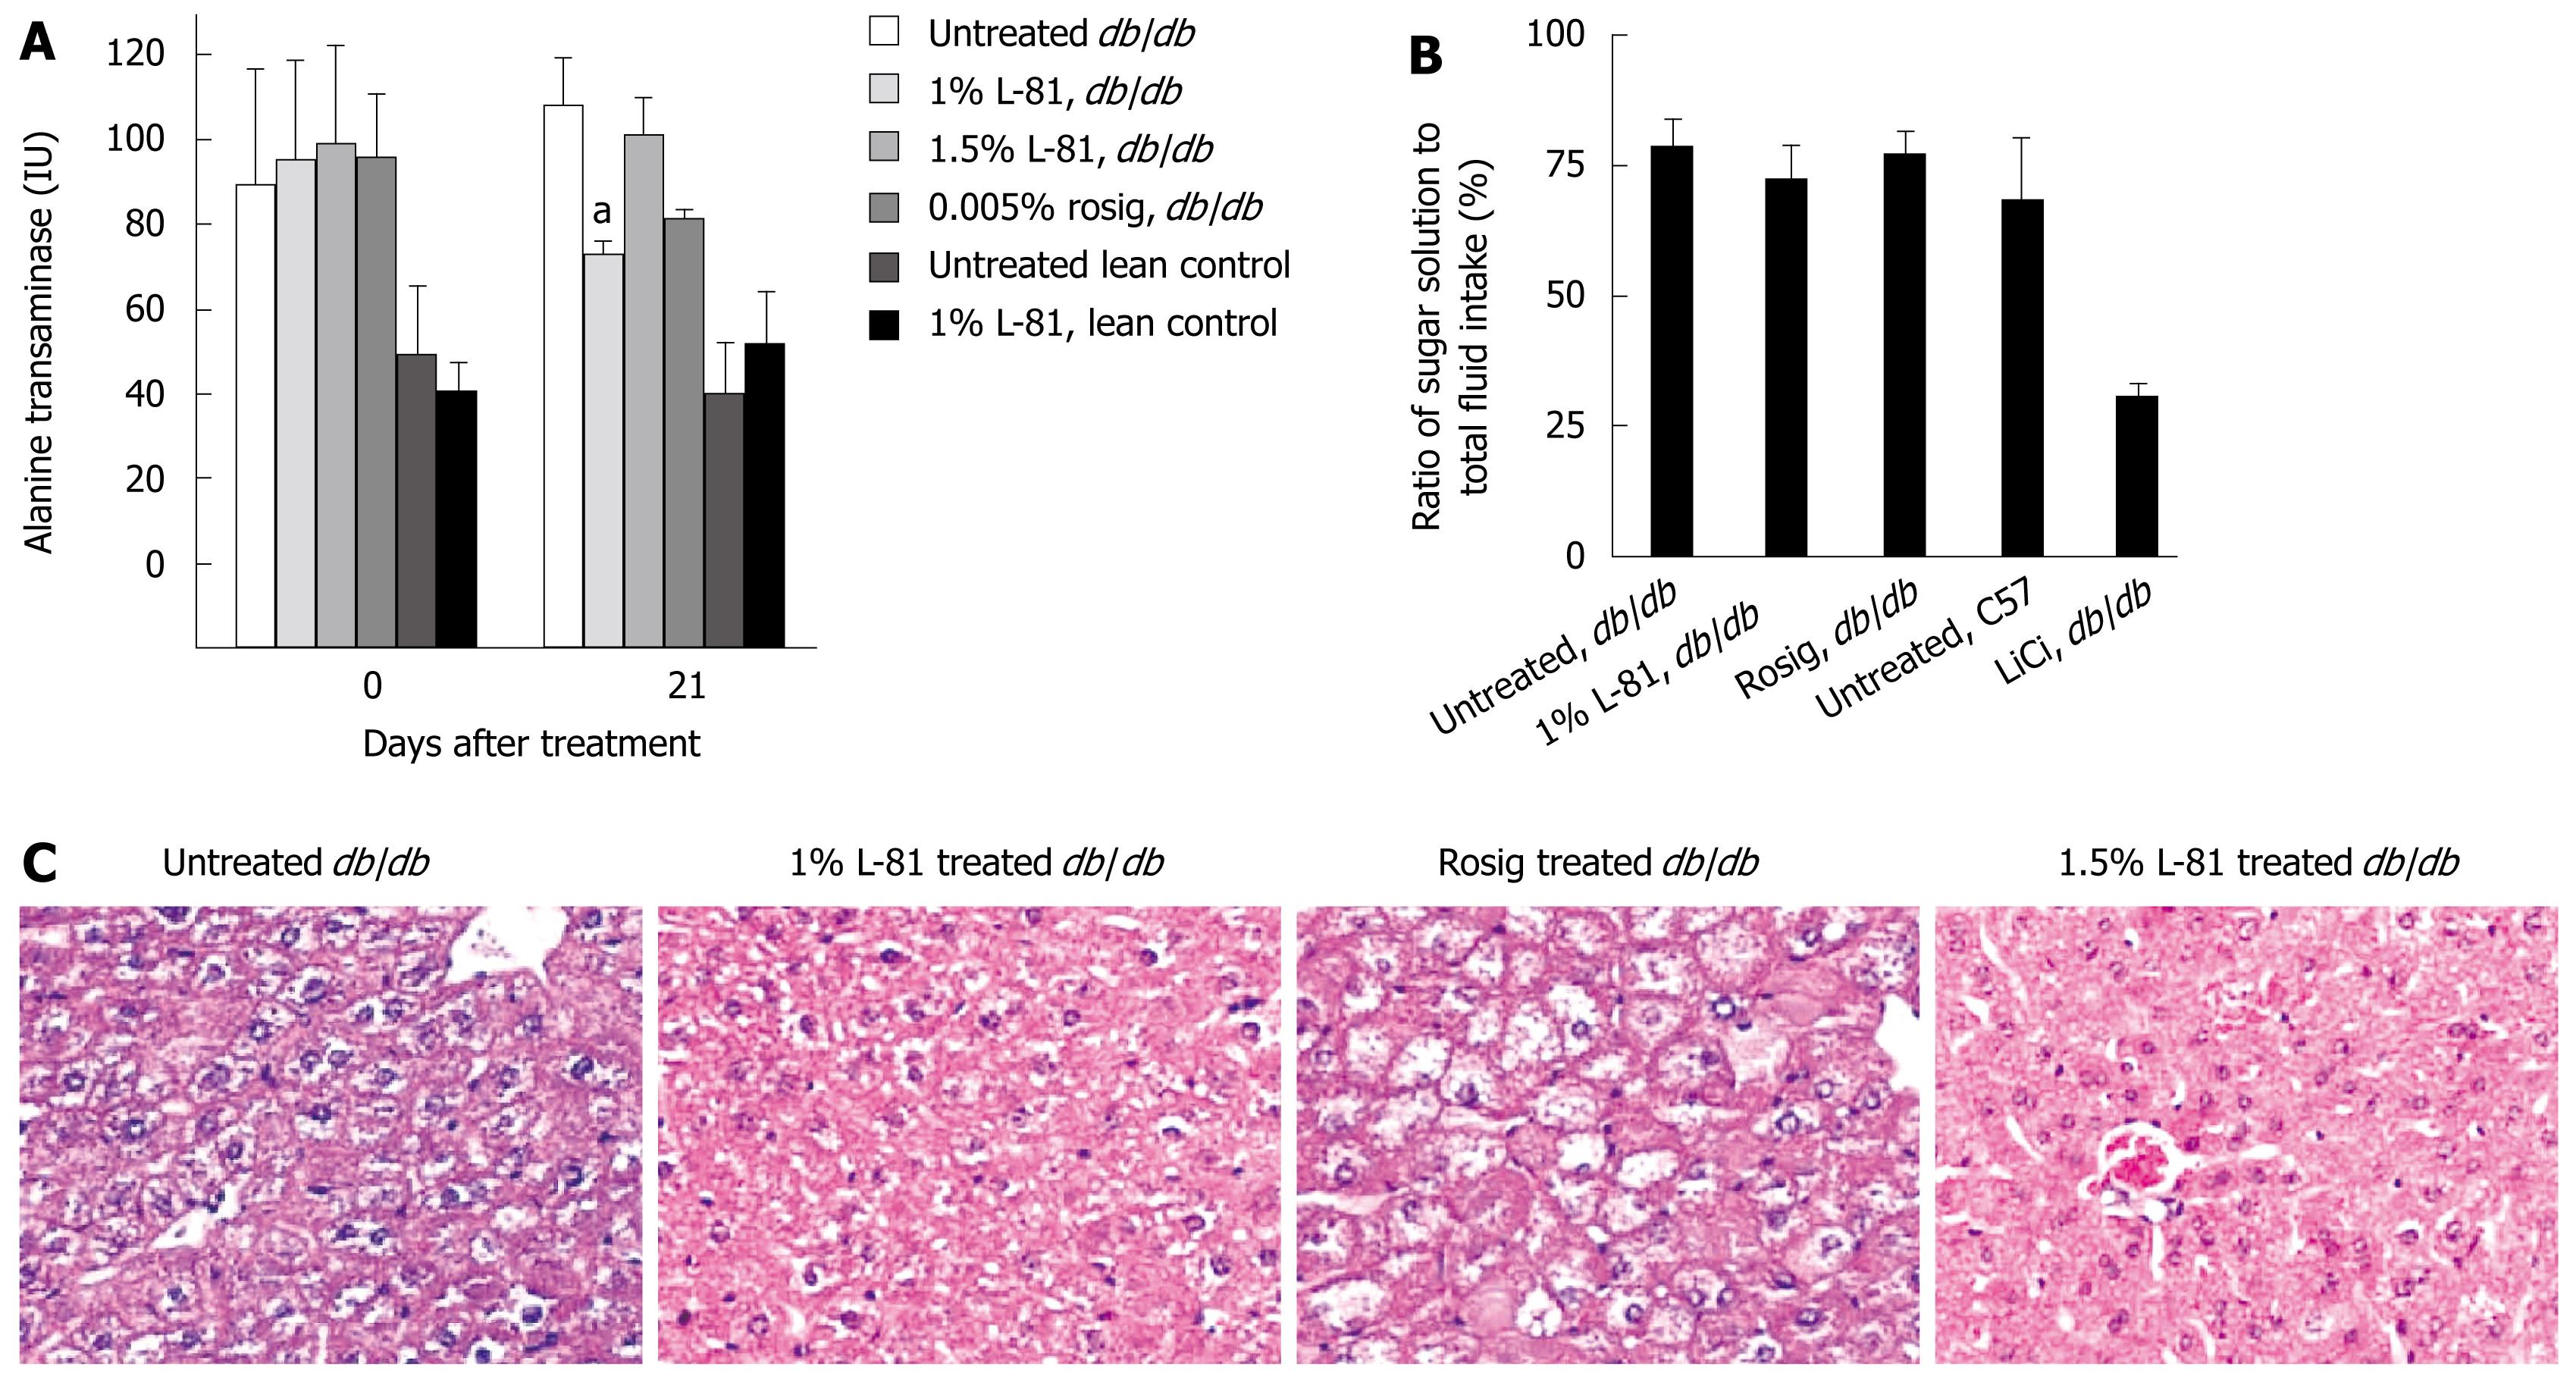
Figure 4 L-81 was not toxic to the liver.
A: Plasma ALT level of mice treated with the indicated drugs; B: CTA test of mice treated with the indicated drugs; C: Histological examinations of db/db mice treated with indicated drugs. aP < 0.05 compared with untreated db/db.
-
Citation: Au WS, Lu LW, Tam S, Ko OKH, Chow BK, He ML, Ng SS, Yeung CM, Liu CC, Kung HF, Lin MC. Pluronic L-81 ameliorates diabetic symptoms in
db/db mice through transcriptional regulation of microsomal triglyceride transfer protein. World J Gastroenterol 2009; 15(24): 2987-2994 - URL: https://www.wjgnet.com/1007-9327/full/v15/i24/2987.htm
- DOI: https://dx.doi.org/10.3748/wjg.15.2987


