Copyright
©2009 The WJG Press and Baishideng.
World J Gastroenterol. Jun 21, 2009; 15(23): 2900-2903
Published online Jun 21, 2009. doi: 10.3748/wjg.15.2900
Published online Jun 21, 2009. doi: 10.3748/wjg.15.2900
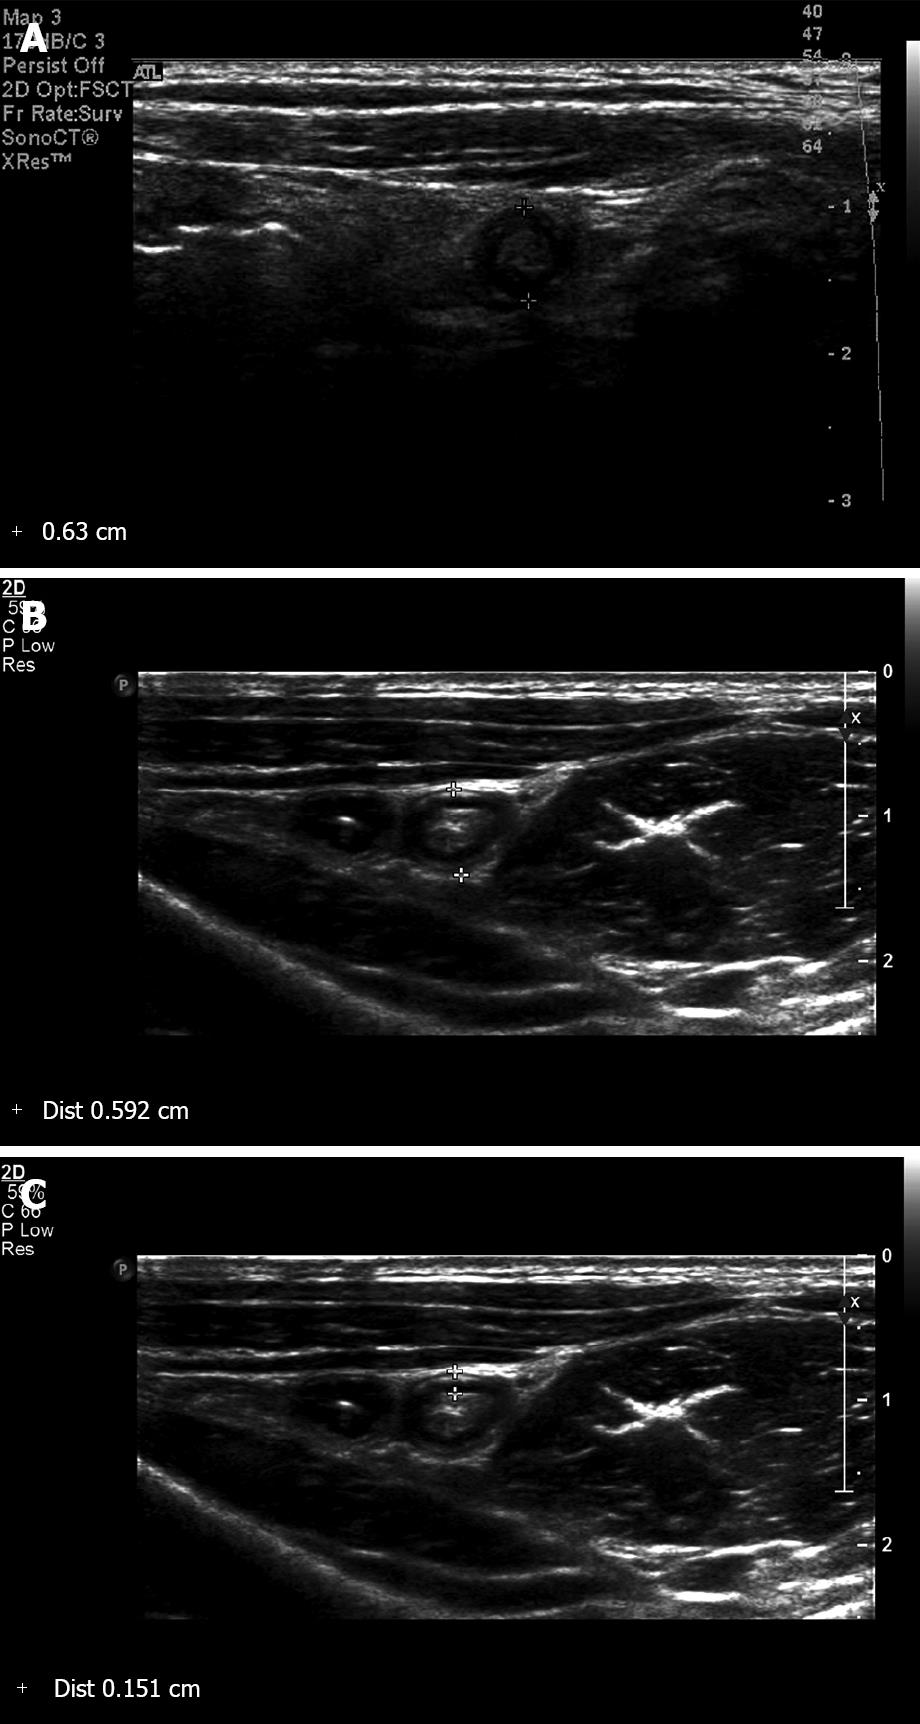
Figure 1 Measurement of MOD and MMT of an appendix in the cross-sectional image.
The MOD (A) of the appendix of a 10-year-old boy who had surgery for acute appendicitis. The MOD (B) and the MMT (C) of the appendix of a 7-year-old boy who had a normal appendix in spite of acute abdominal pain.
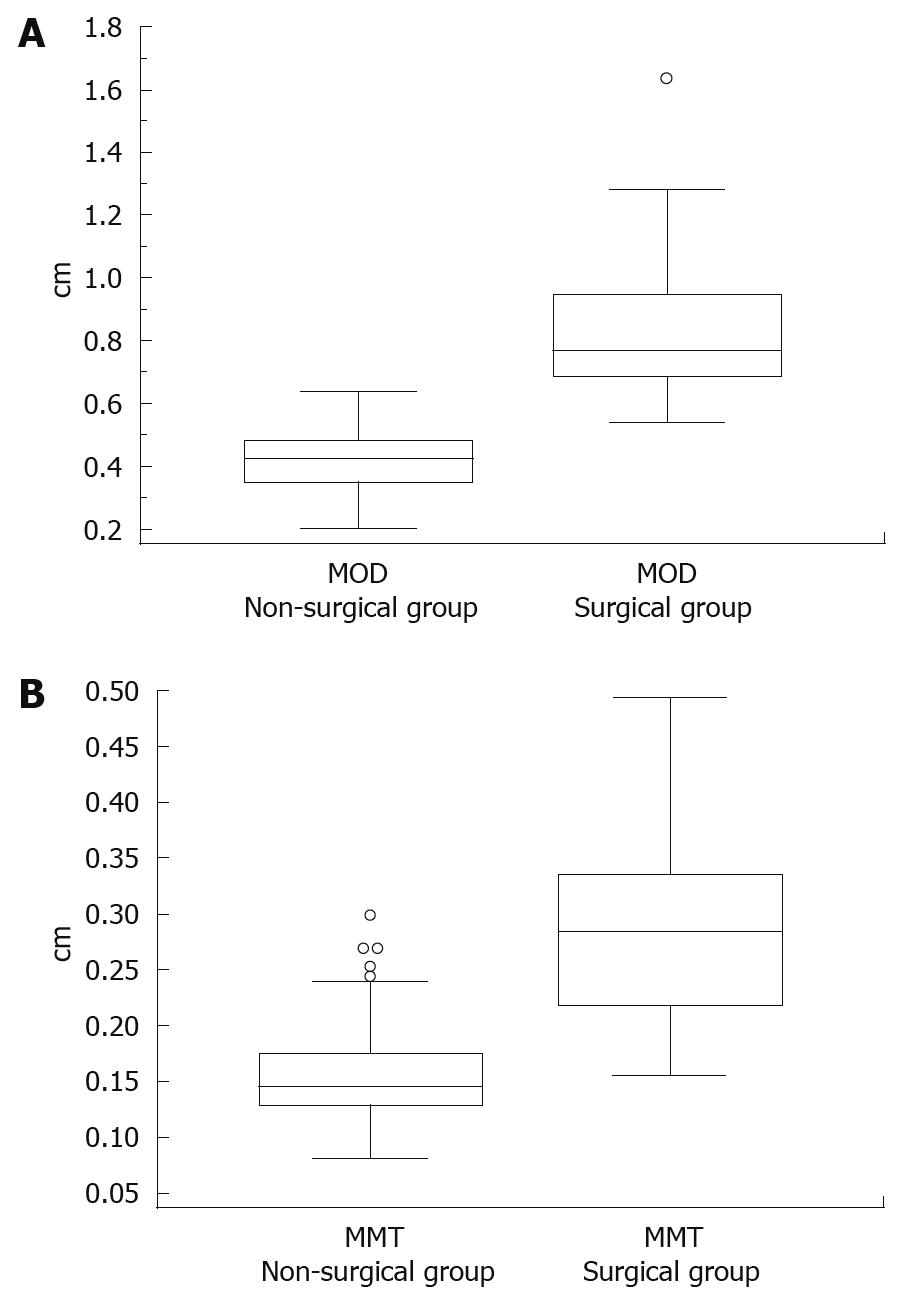
Figure 2 Data comparison graphs of MOD (A) and MMT (B) in box-and-whisker plots.
The median MOD and the median MMT were significantly different (P < 0.0001) between two groups.
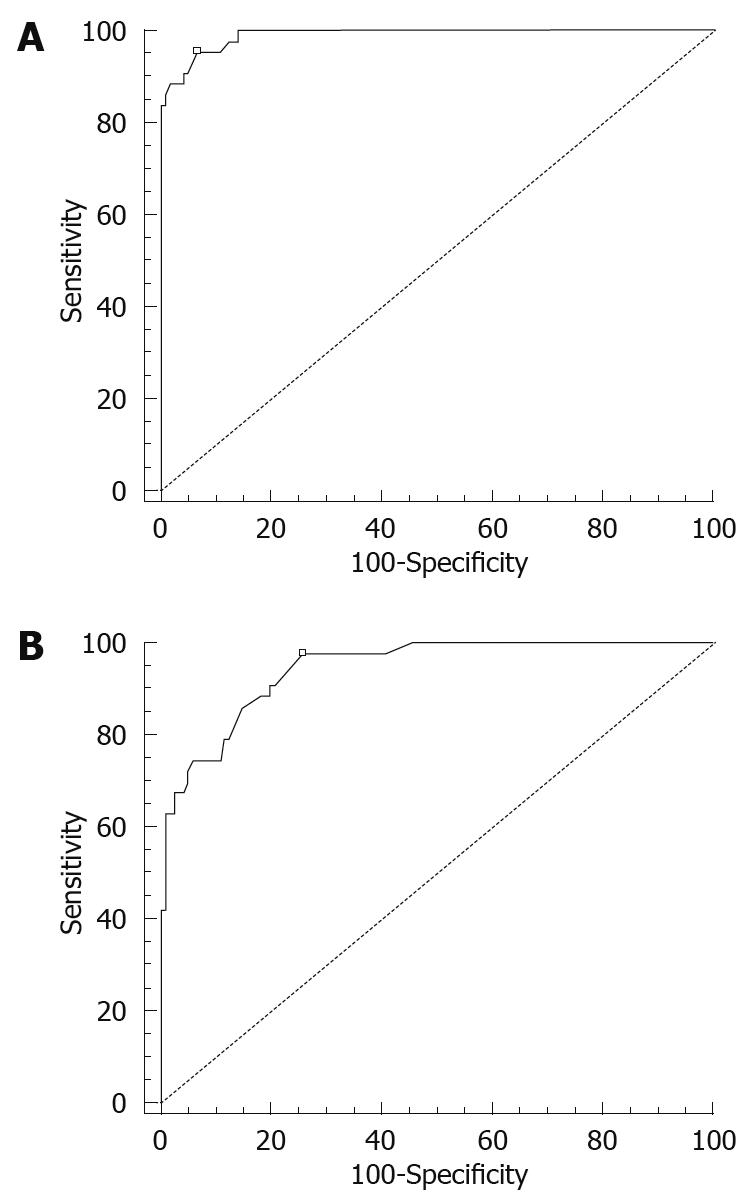
Figure 3 ROC curves of MOD (A) and MMT (B).
The optimal cut-off points are marked as white square boxes on the graphs.
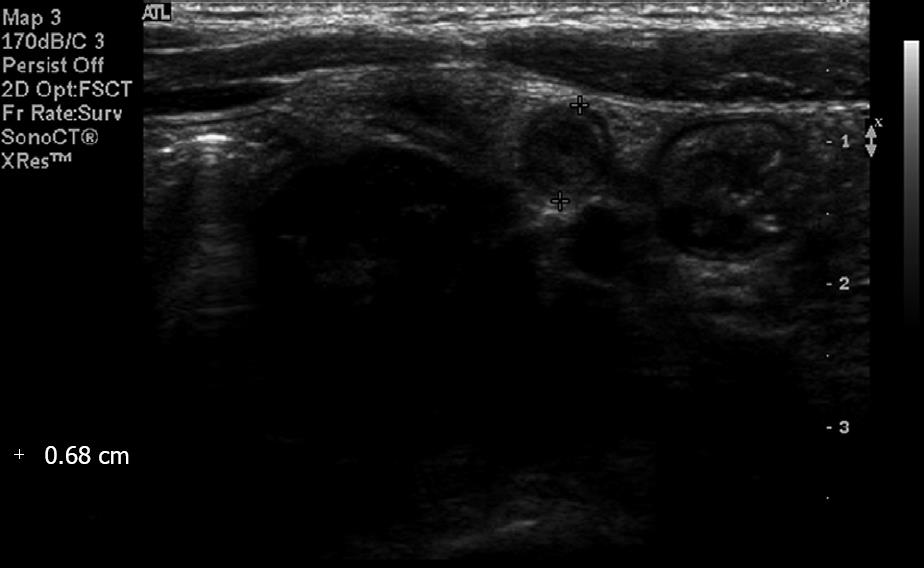
Figure 4 Cross-sectional image of a distended normal appendix in a 7-year-old boy.
The MOD of the appendix was 0.65 cm. The intra-luminal hyperechogenicity was due to gas and fecal materials. We diagnosed this as normal appendix, and the symptoms spontaneously resolved.
- Citation: Je BK, Kim SB, Lee SH, Lee KY, Cha SH. Diagnostic value of maximal-outer-diameter and maximal-mural-thickness in use of ultrasound for acute appendicitis in children. World J Gastroenterol 2009; 15(23): 2900-2903
- URL: https://www.wjgnet.com/1007-9327/full/v15/i23/2900.htm
- DOI: https://dx.doi.org/10.3748/wjg.15.2900


