Copyright
©2009 The WJG Press and Baishideng.
World J Gastroenterol. Jun 21, 2009; 15(23): 2893-2899
Published online Jun 21, 2009. doi: 10.3748/wjg.15.2893
Published online Jun 21, 2009. doi: 10.3748/wjg.15.2893
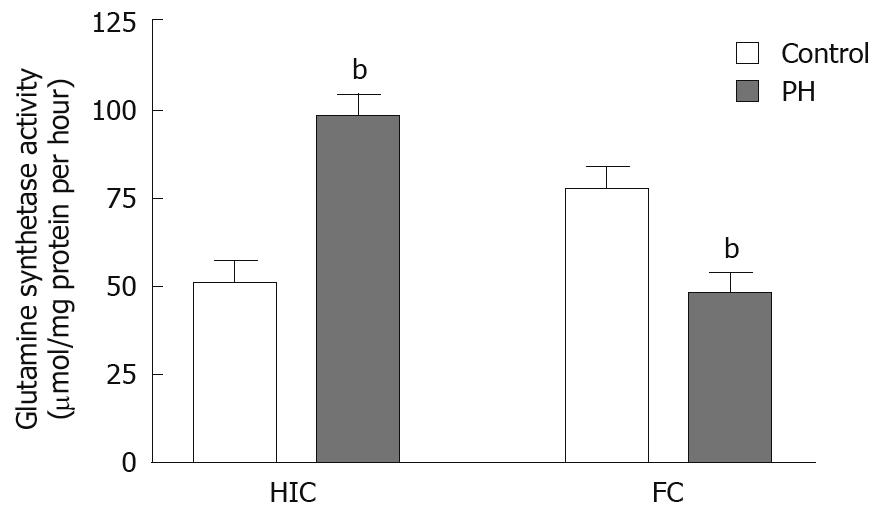
Figure 1 GS activity in the hippocampus and FC.
Values are the mean ± SE in eight experiments. bP < 0.01 compared with respective control group. HIC: Hippocampus.
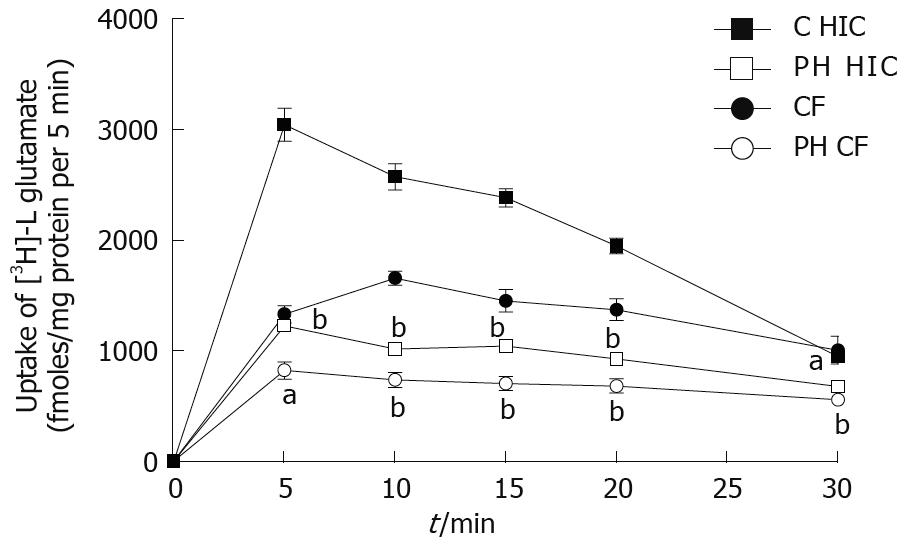
Figure 2 Time course of [3H] L-glutamate uptake in FC and hippocampus.
Synaptosomes were incubated with [3H] L-glutamate at 10 nmol/L substrate concentration, for > 30 min, in the presence of 125 mmol/L NaCl at 30°C. Values are the mean ± SE in six or seven separate experiments done in triplicate. aP < 0.05; bP < 0.01 compared with respective control group. C: Control group; PH: Portal hypertension group.
- Citation: Acosta GB, Fernández MA, Roselló DM, Tomaro ML, Balestrasse K, Lemberg A. Glutamine synthetase activity and glutamate uptake in hippocampus and frontal cortex in portal hypertensive rats. World J Gastroenterol 2009; 15(23): 2893-2899
- URL: https://www.wjgnet.com/1007-9327/full/v15/i23/2893.htm
- DOI: https://dx.doi.org/10.3748/wjg.15.2893


