Copyright
©2009 The WJG Press and Baishideng.
World J Gastroenterol. Jun 14, 2009; 15(22): 2787-2793
Published online Jun 14, 2009. doi: 10.3748/wjg.15.2787
Published online Jun 14, 2009. doi: 10.3748/wjg.15.2787
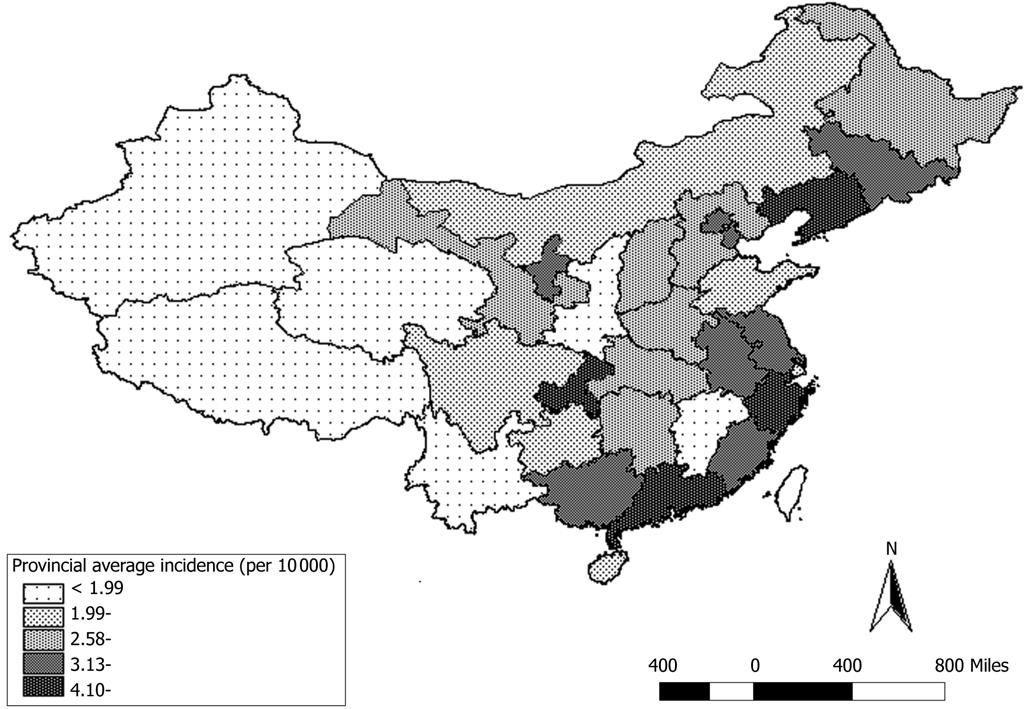
Figure 1 National distribution graph of average incidences of anorectal atresia/stenosis in different provinces, municipal cities and autonomous regions from 2001 to 2005.
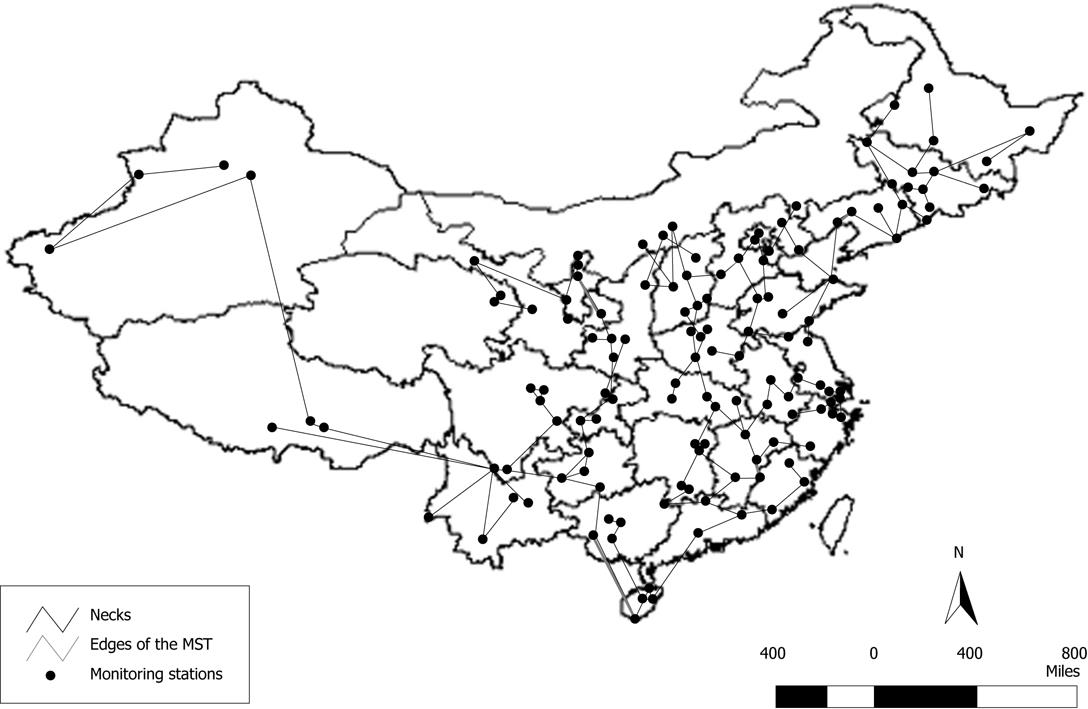
Figure 2 Two-dimensional MST-based cluster graph of monitoring sites in China from 2001 to 2005.
Figure 3 Cluster graph of monitoring sites in China from 2001 to 2005.
- Citation: Yuan P, Qiao L, Dai L, Wang YP, Zhou GX, Han Y, Liu XX, Zhang X, Cao Y, Liang J, Zhu J. Spatial distribution patterns of anorectal atresia/stenosis in China: Use of two-dimensional graph-theoretical clustering. World J Gastroenterol 2009; 15(22): 2787-2793
- URL: https://www.wjgnet.com/1007-9327/full/v15/i22/2787.htm
- DOI: https://dx.doi.org/10.3748/wjg.15.2787


