Copyright
©2009 The WJG Press and Baishideng.
World J Gastroenterol. Jun 14, 2009; 15(22): 2768-2777
Published online Jun 14, 2009. doi: 10.3748/wjg.15.2768
Published online Jun 14, 2009. doi: 10.3748/wjg.15.2768
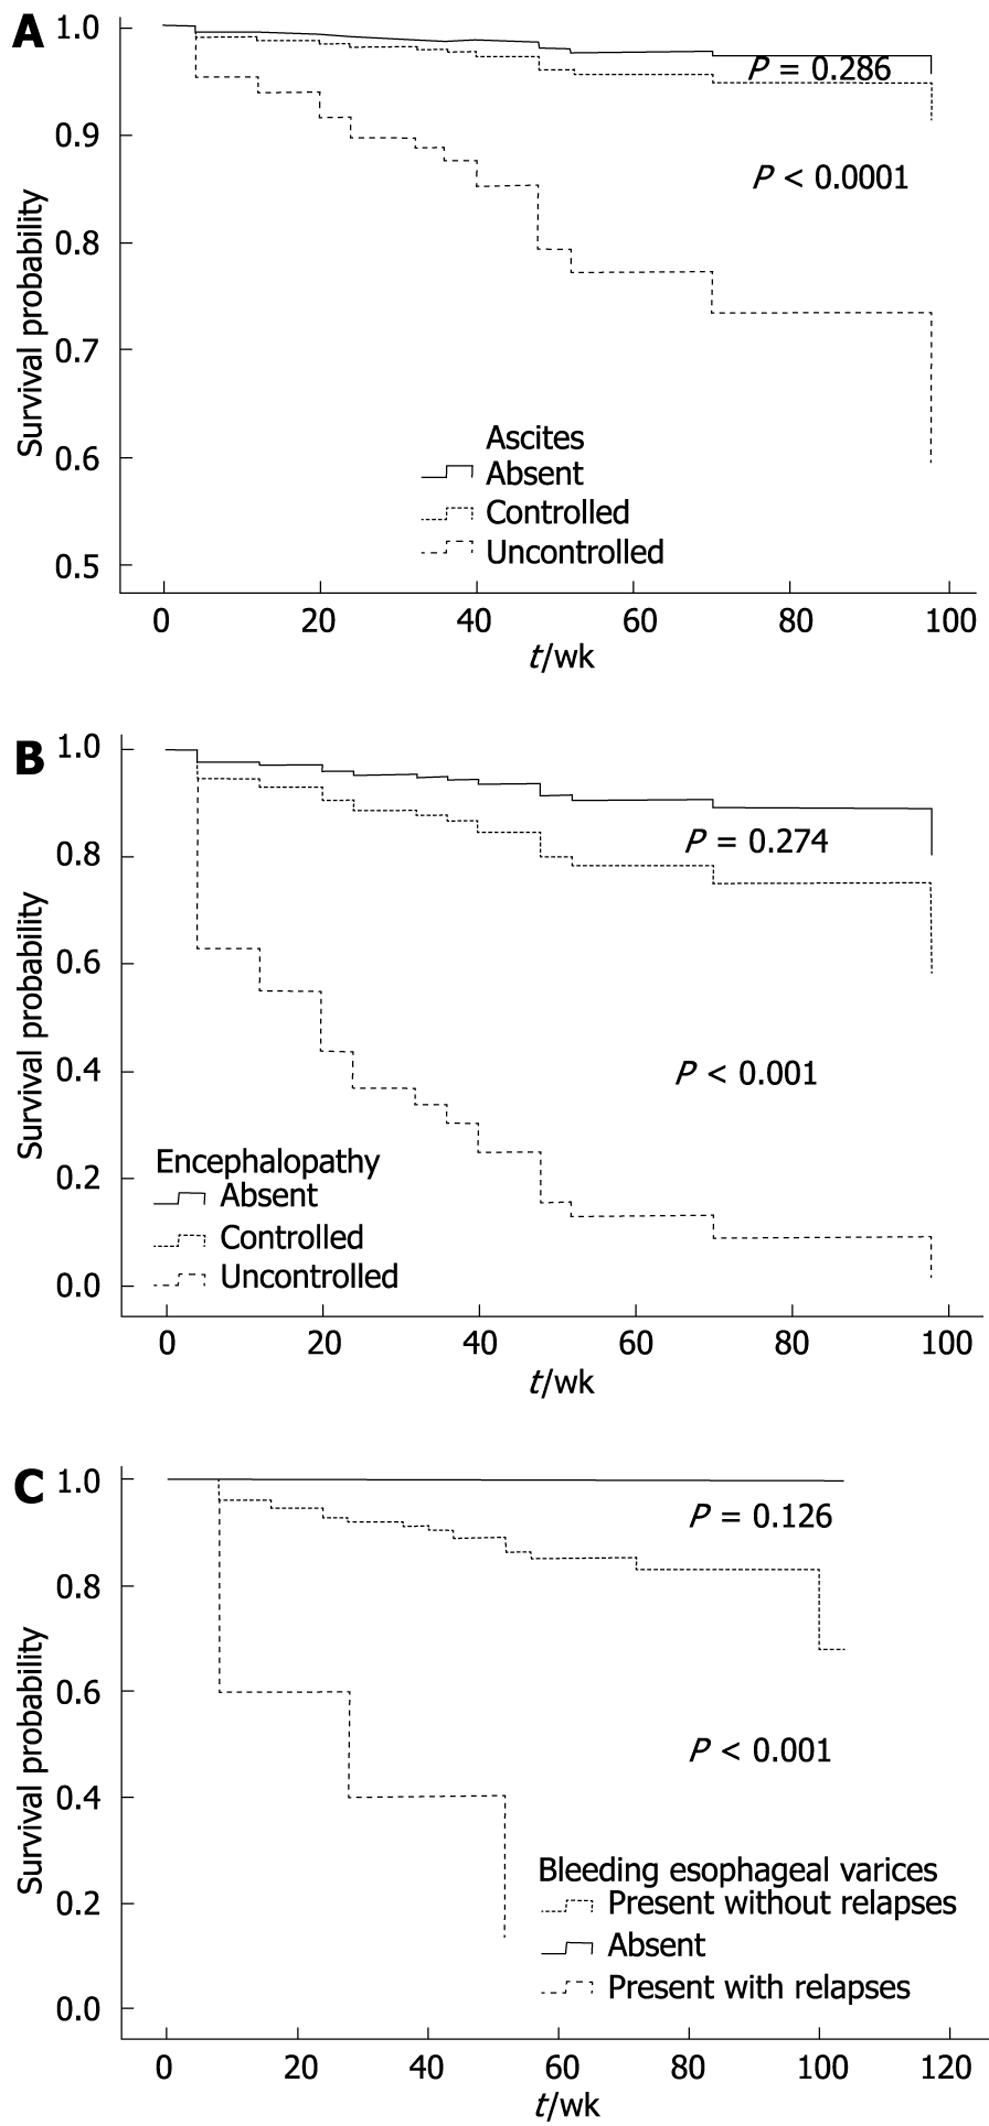
Figure 1 Kaplan-Meier estimated survival curves for clinical variables.
A: Ascites; B: Encephalopathy; C: Bleeding esophageal varices.
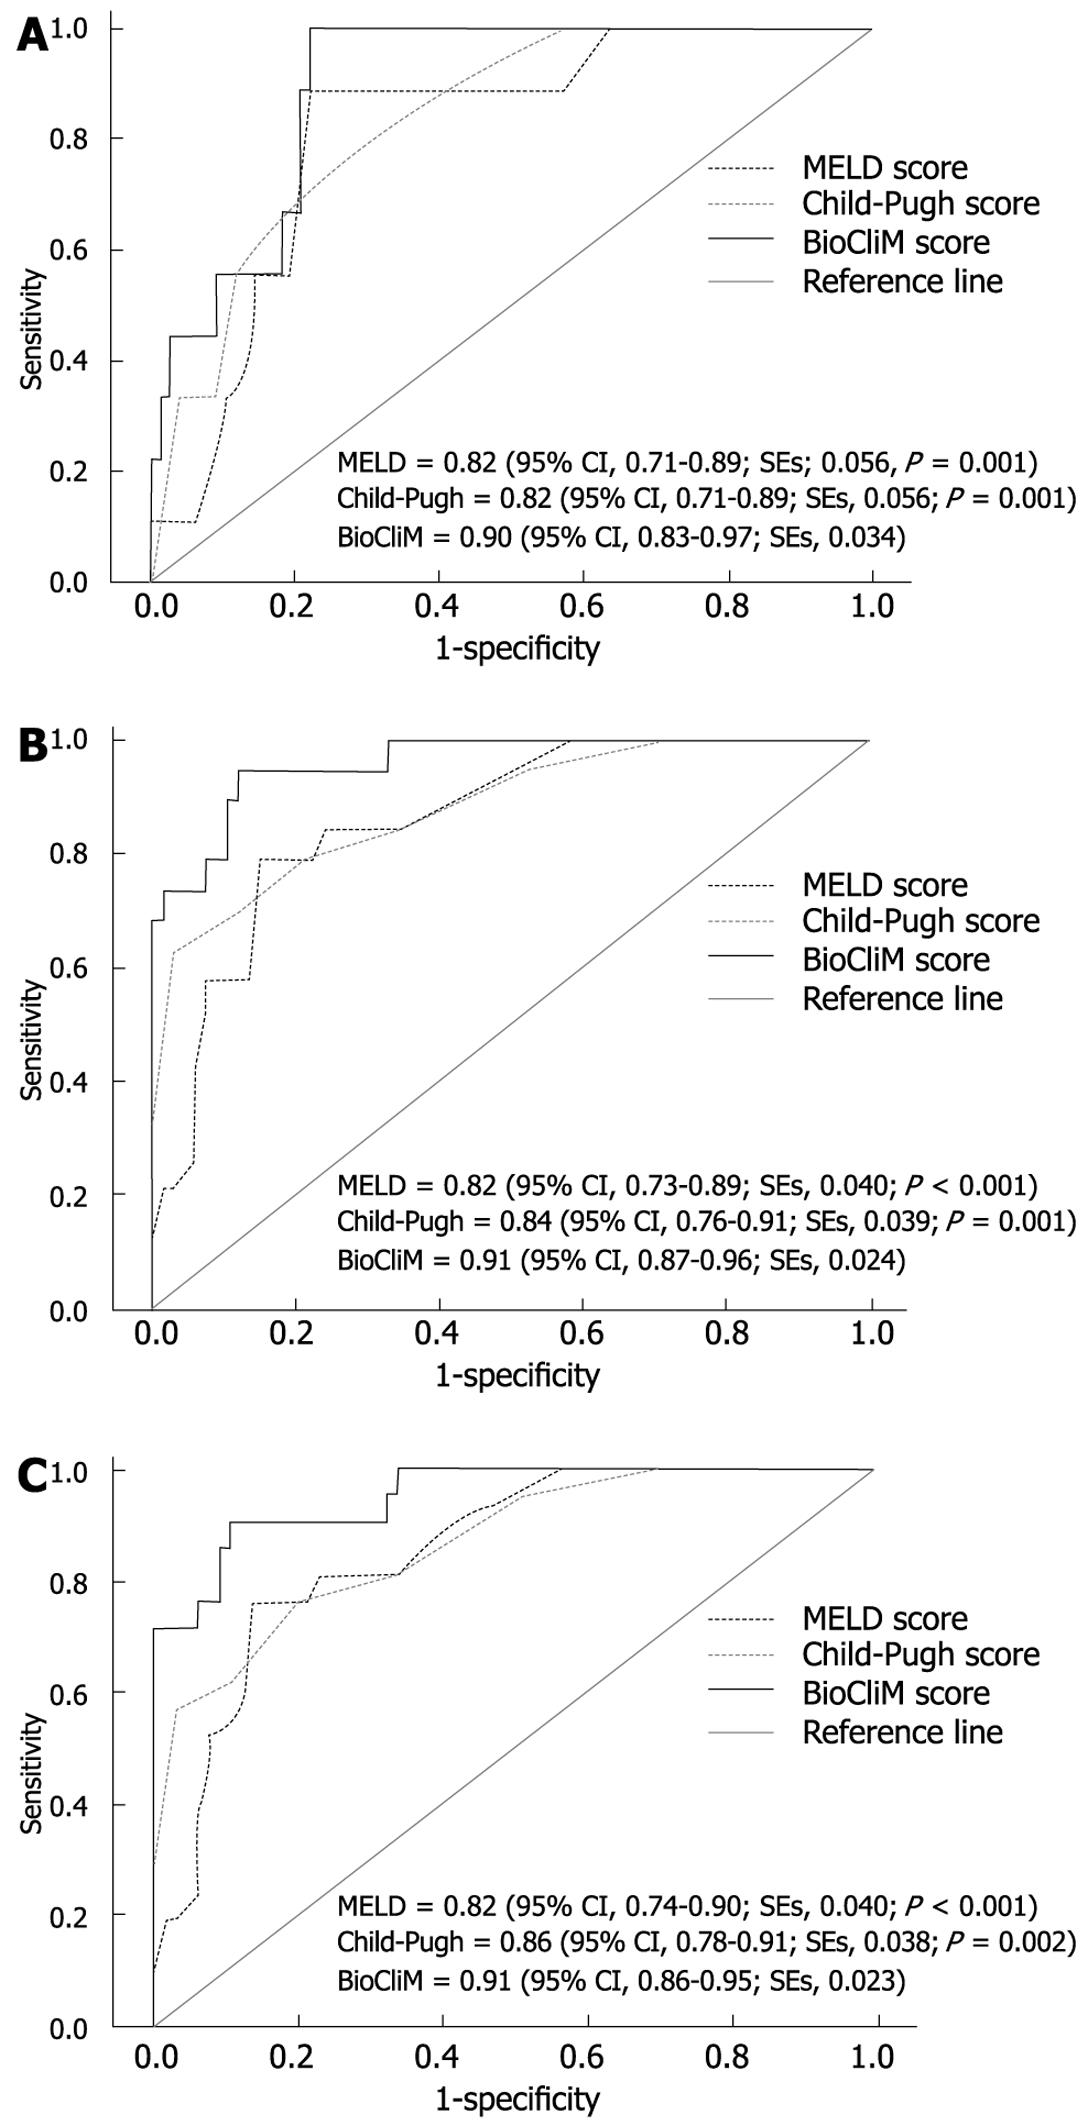
Figure 2 Comparison of the c-index values of the MELD, Child-Pugh and BioCliM scores for 12- (A), 52- (B) and 104-wk (C) survival.
SE indicates standard errors. The different values were compared with BioCliM score using the bootstrap method.
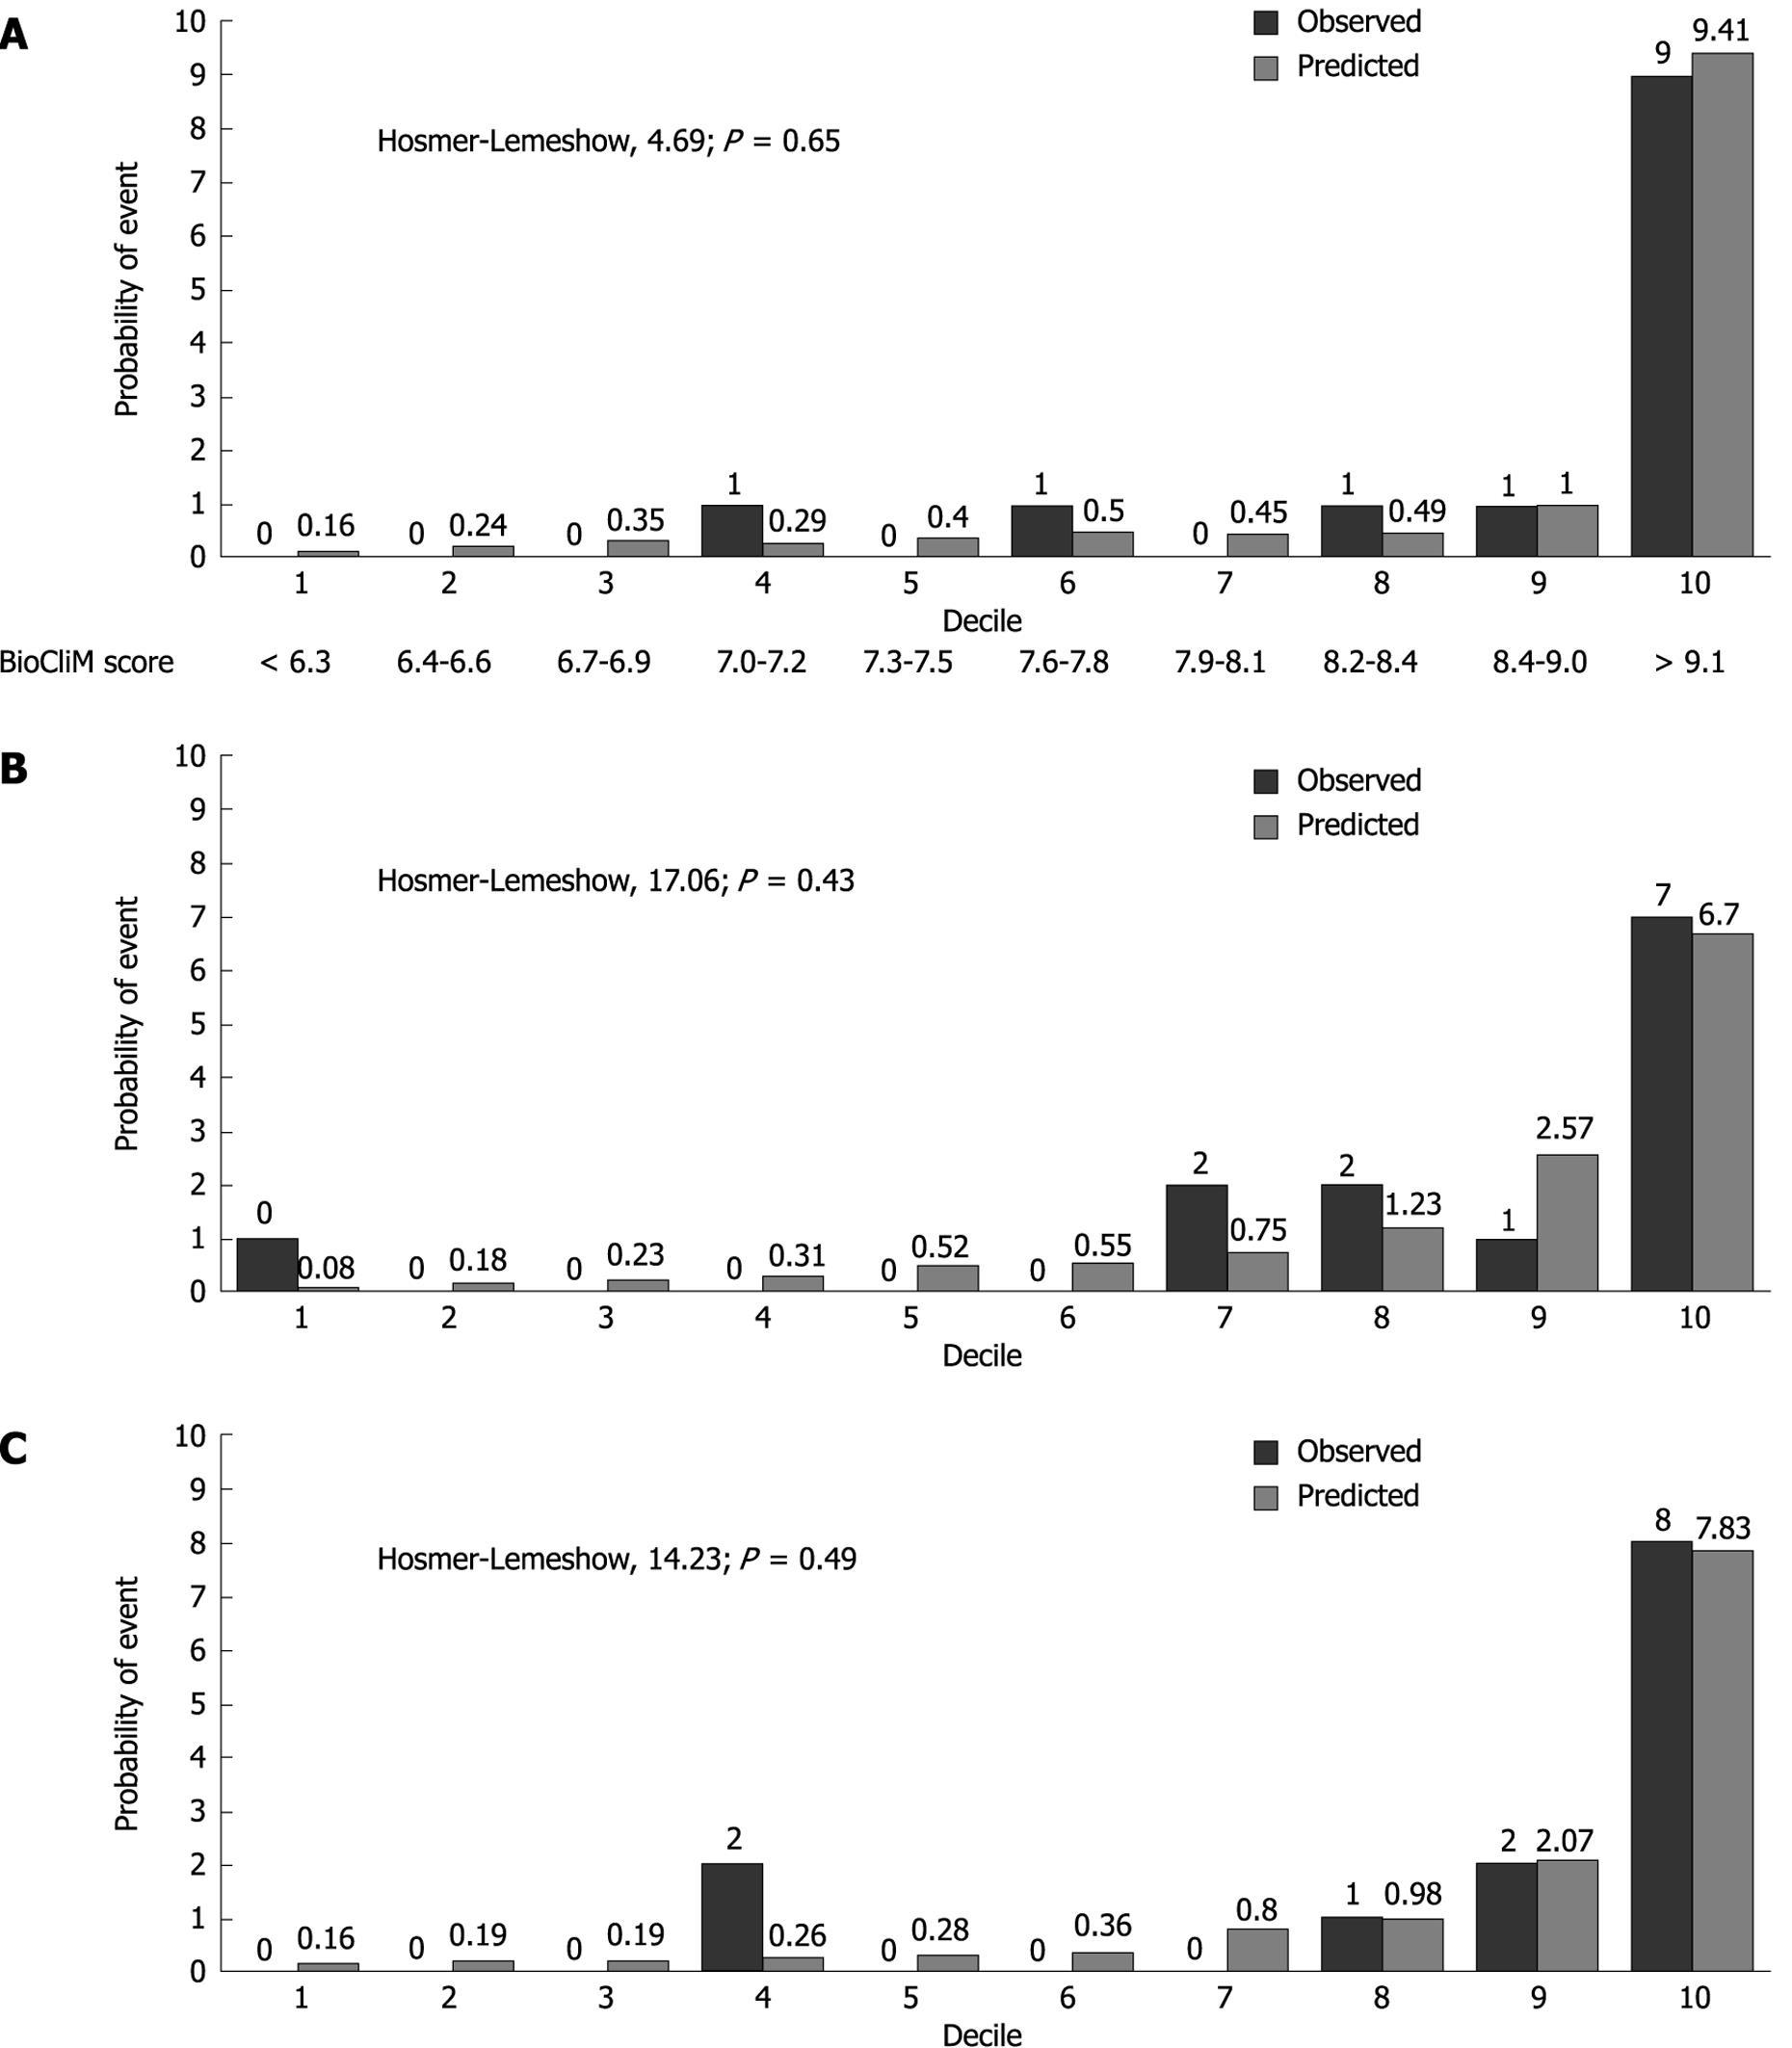
Figure 3 Observed and predicted probability of events at 104 wk.
A, B and C shows the observed and predicted probability of death according to BioCliM, MELD and Child-Pugh scores in 10 groups (deciles) of patients, respectively. A significant P-value for the Hosmer-Lemeshow statistic indicates a significant deviation between predicted and observed outcomes.
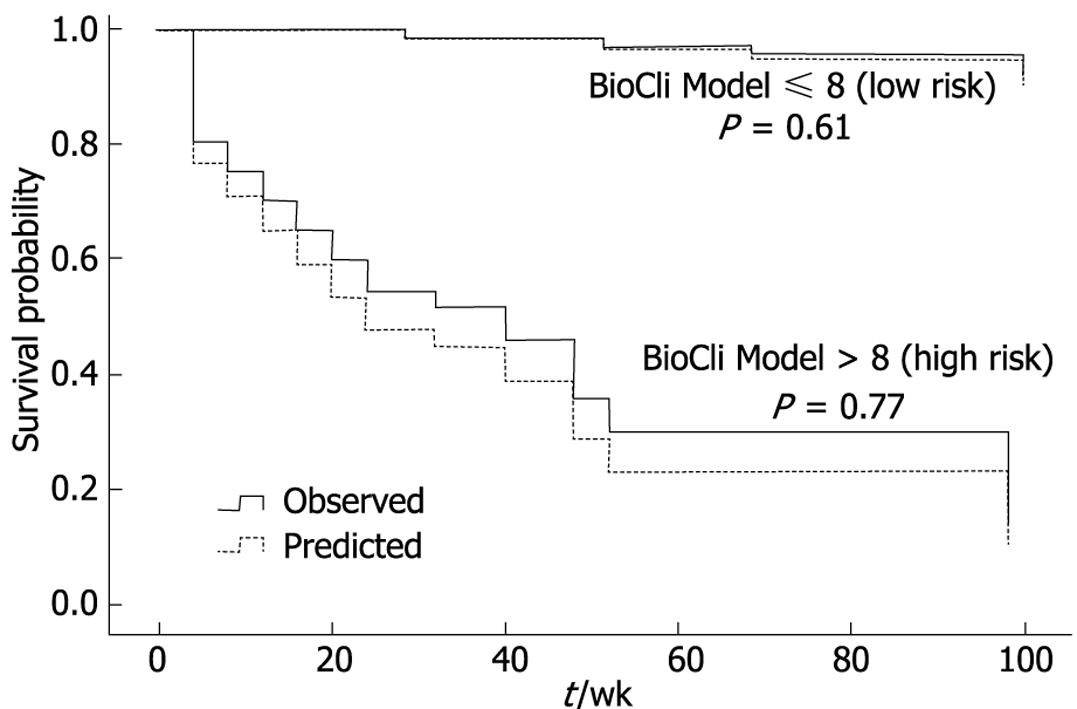
Figure 4 Observed and expected 104-wk survival curves for the BioCliM score.
Survival of 85 independent patients from the “Calixto Garcia” Hospital who were stratified according to their risk score into two risk groups (low-risk ≤ 8 and high-risk > 8). The observed and predicted BioCli Model survival curves were compared using log-rank test. The observed and expected survival was similar for the low- and high-risk groups.
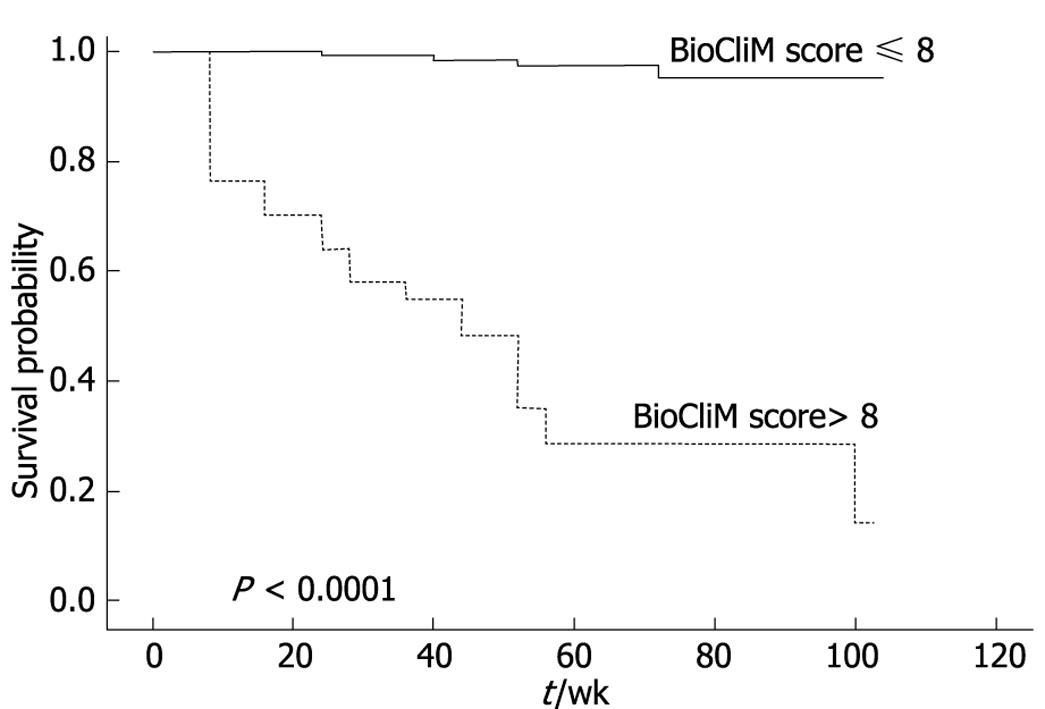
Figure 5 Kaplan-Meier estimated survival curves for the BioCli Model score.
- Citation: Gomez EV, Bertot LC, Oramas BG, Soler EA, Navarro RL, Elias JD, Jiménez OV, Vazquez MDRA. Application of a biochemical and clinical model to predict individual survival in patients with end-stage liver disease. World J Gastroenterol 2009; 15(22): 2768-2777
- URL: https://www.wjgnet.com/1007-9327/full/v15/i22/2768.htm
- DOI: https://dx.doi.org/10.3748/wjg.15.2768


