Copyright
©2009 The WJG Press and Baishideng.
World J Gastroenterol. Jun 14, 2009; 15(22): 2723-2730
Published online Jun 14, 2009. doi: 10.3748/wjg.15.2723
Published online Jun 14, 2009. doi: 10.3748/wjg.15.2723
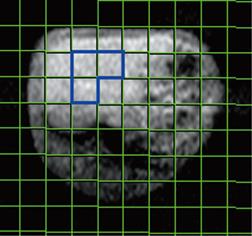
Figure 1 Orientation of CSI: the location of VOI of three voxels being selected in the largest section of rabbit liver on MRI with true FISP sequence.
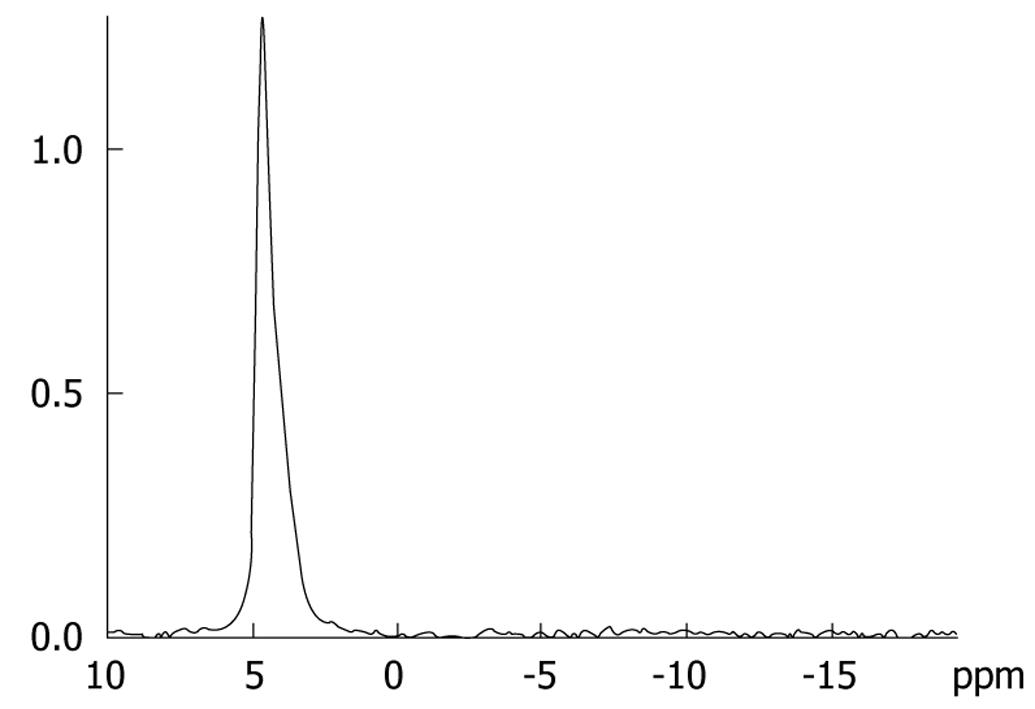
Figure 2 31P magnetic resonance spectrum from a 500 mL phosphate (NaH2PO4) solution phantom with 0.
05 mol/L concentrations.
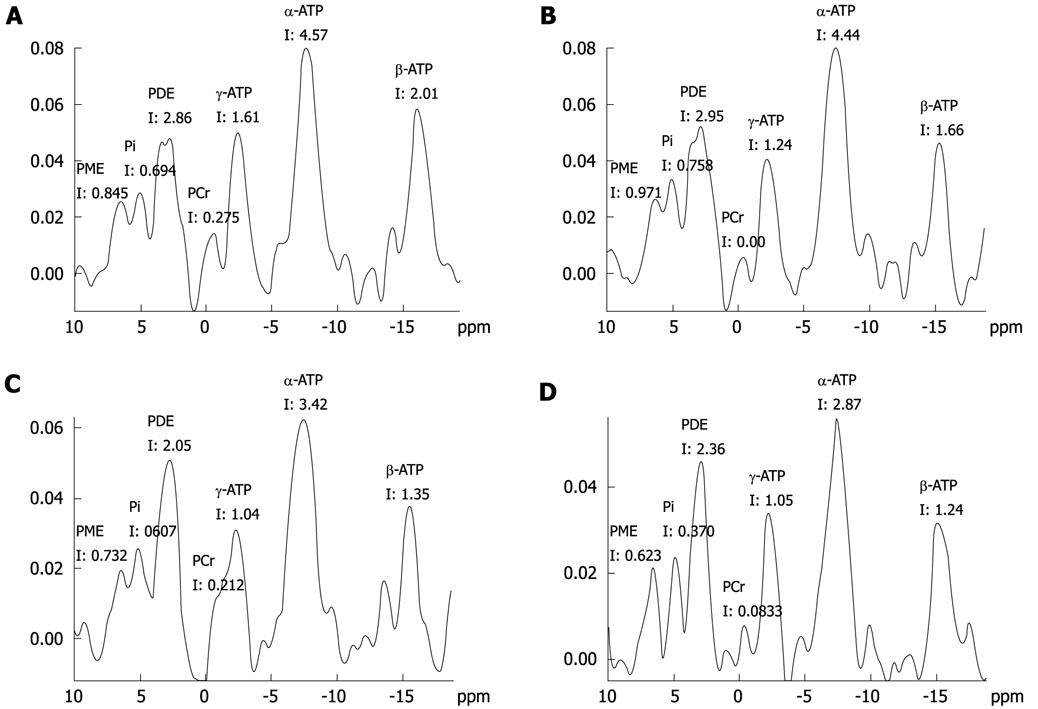
Figure 3 Hepatic 31P MRS of the liver from a rabbit of the control group (A), mild injury group (B), moderate injury group (C) and severe injury group (D).
A significant decrease in the ATP signal is seen in the 31P MR spectra (C, D).
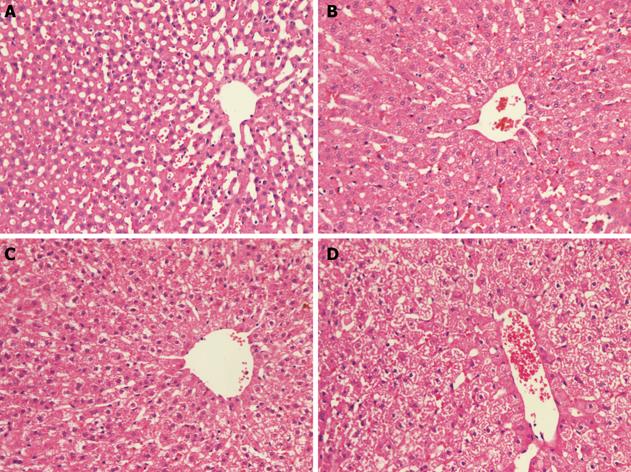
Figure 4 Representative histological section of the liver from a rabbit of the control group (A), mild injury group (B), moderate injury group (C) and severe injury group (D).
I: Integral.
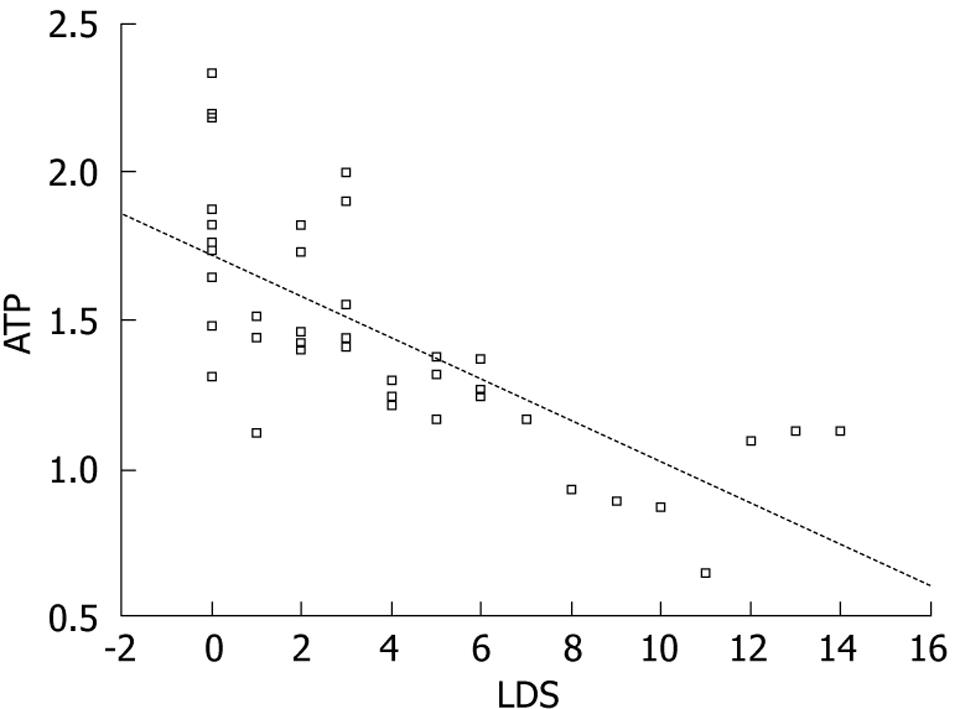
Figure 5 The graph shows the correlation between LDS and ATP, that is, the ATP relative quantification decreases progressively with the increase of LDS.
- Citation: Yu RS, Hao L, Dong F, Mao JS, Sun JZ, Chen Y, Lin M, Wang ZK, Ding WH. Biochemical metabolic changes assessed by 31P magnetic resonance spectroscopy after radiation-induced hepatic injury in rabbits. World J Gastroenterol 2009; 15(22): 2723-2730
- URL: https://www.wjgnet.com/1007-9327/full/v15/i22/2723.htm
- DOI: https://dx.doi.org/10.3748/wjg.15.2723


