Copyright
©2009 The WJG Press and Baishideng.
World J Gastroenterol. Jun 14, 2009; 15(22): 2714-2722
Published online Jun 14, 2009. doi: 10.3748/wjg.15.2714
Published online Jun 14, 2009. doi: 10.3748/wjg.15.2714
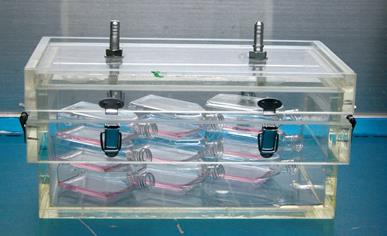
Figure 1 Five litres volume airtight Perspex box with two ventilating ports for pneumoperitoneum establishment in vitro.
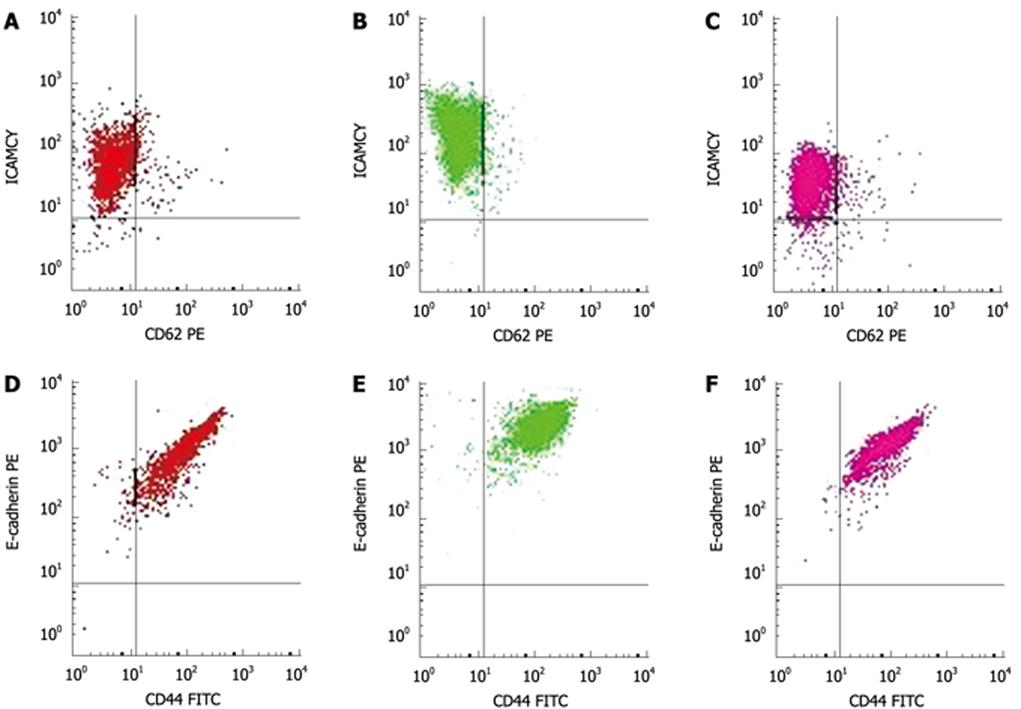
Figure 2 Flow cytometry analysis of ICAM-1 and E-cadherin expression in SW1116.
A: ICAM-1 (Room air control); B: ICAM-1 (0 h after the 6 mmHg insufflation); C: ICAM-1 (72 h after the 6 mmHg insufflation); D: E-cadherin (Room air control); E: E-cadherin (24 h after the 9 mmHg insufflation); F: E-cadherin (72 h after the 9 mmHg insufflation). Immediately after the 6 mmHg CO2 insufflation (B), ICAM-1 expression increased significantly compared to room air controls (A) (P = 0.009), while it was significantly less at 72 h after the 6 mmHg insufflation (C) than control group. Twenty four hours after 9 mmHg CO2 insufflation (E), E-cadherin expression increased significantly compared to controls (D) (P = 0.035), but returned to the control value at 72 h after the 9 mmHg insufflation (F).
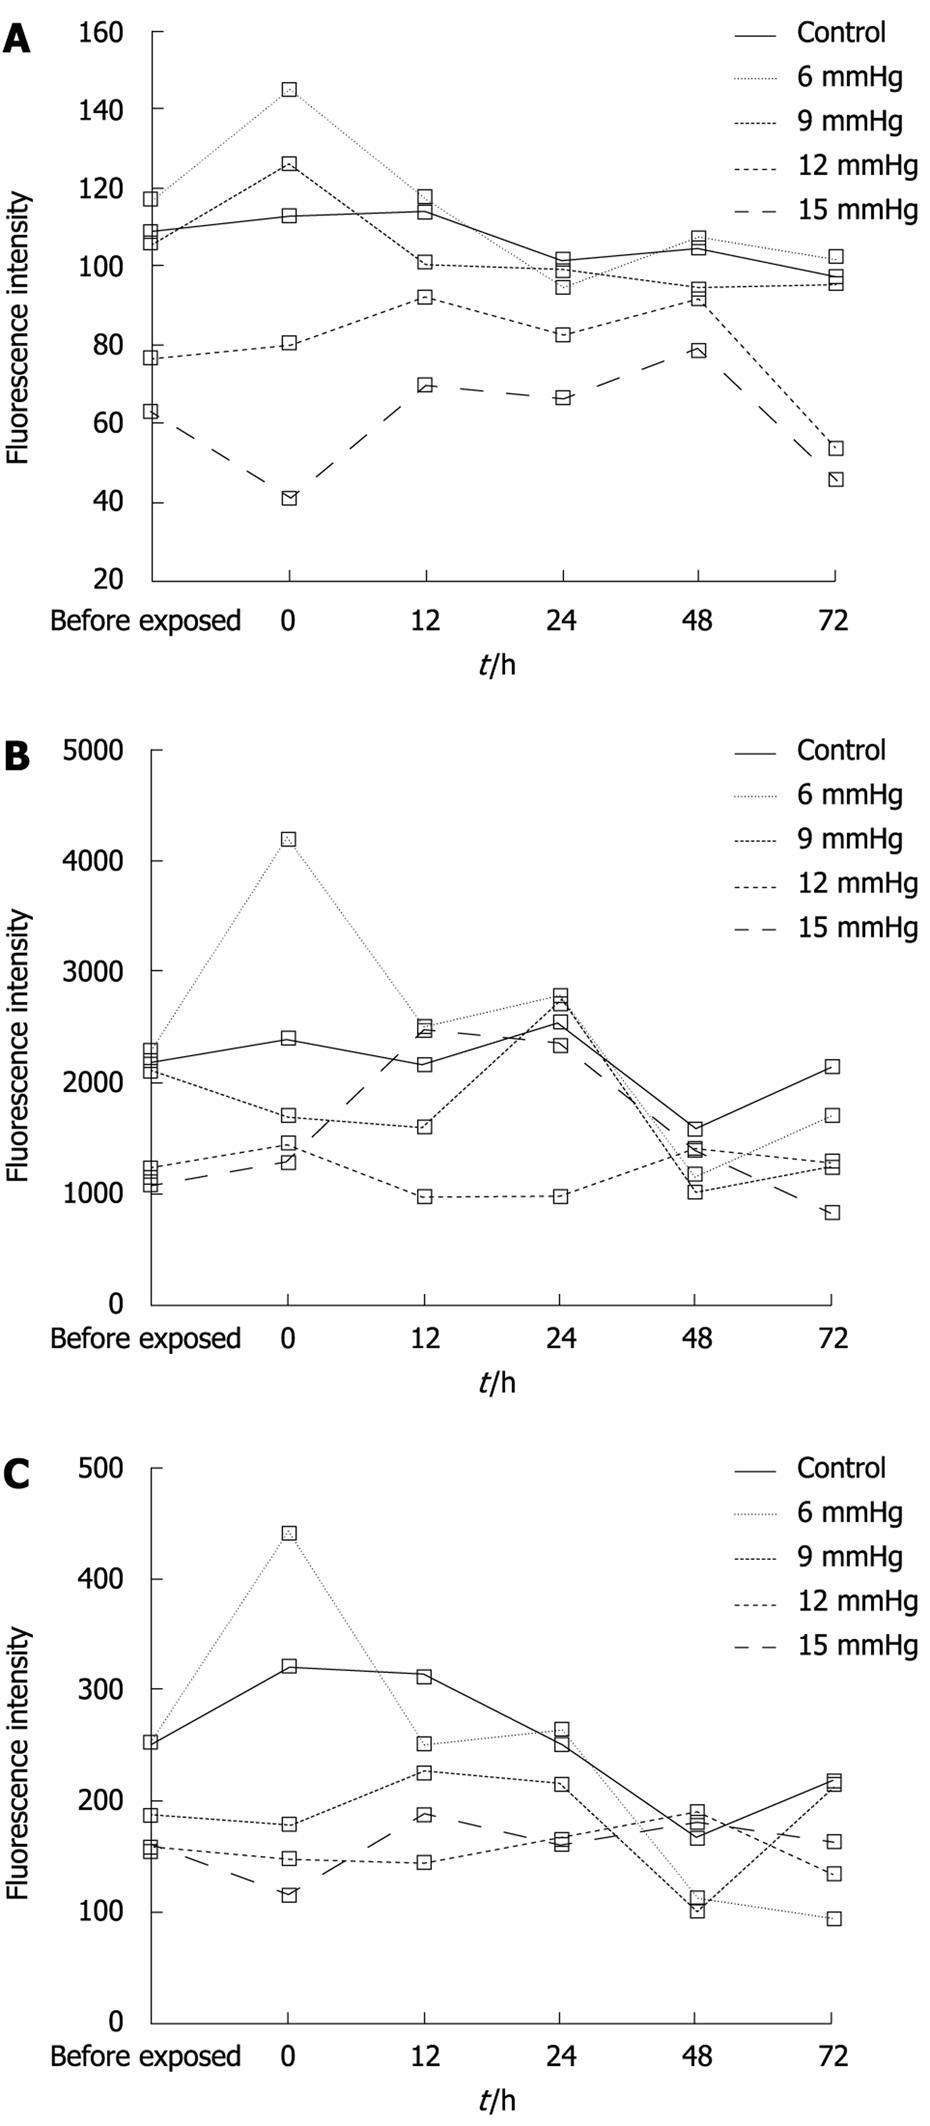
Figure 3 The effect of CO2 insufflation pressure on expression of adhesion molecules.
A: Expression of CD44; B: Expression of E-cadherin; C: Expression of ICAM-1. With increasing CO2-insufflation pressure, the expression of CD44 (A), E-cadherin (B), and ICAM-1 (C) decreased at some time points, especially at the start (0 h) after CO2-insufflation.
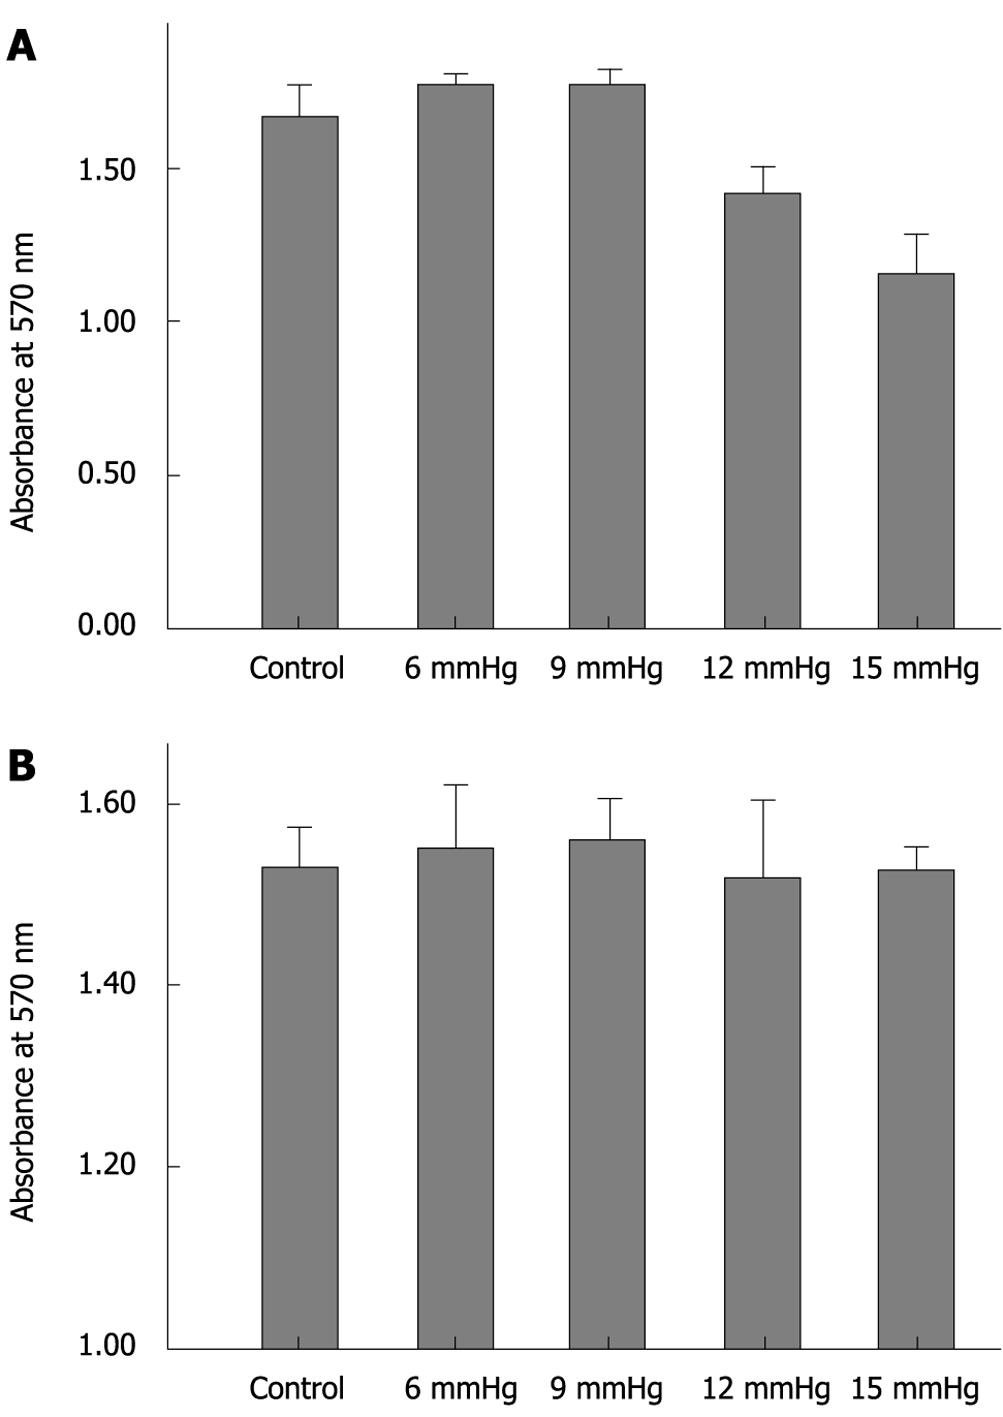
Figure 4 Results of adhesion assay.
A: 0 h after CO2 insufflation; B: 72 h after CO2 insufflation. At 0 h after CO2 insufflation (A), with increasing CO2-insufflation pressure, the adhesion of the SW1116 cell line decreased gradually (12 mmHg vs control, P < 0.001; 15 mmHg vs 12 mmHg, P < 0.001). At 72 h after CO2 insufflation (B), cell adhesion was similar among the different groups (P > 0.05).
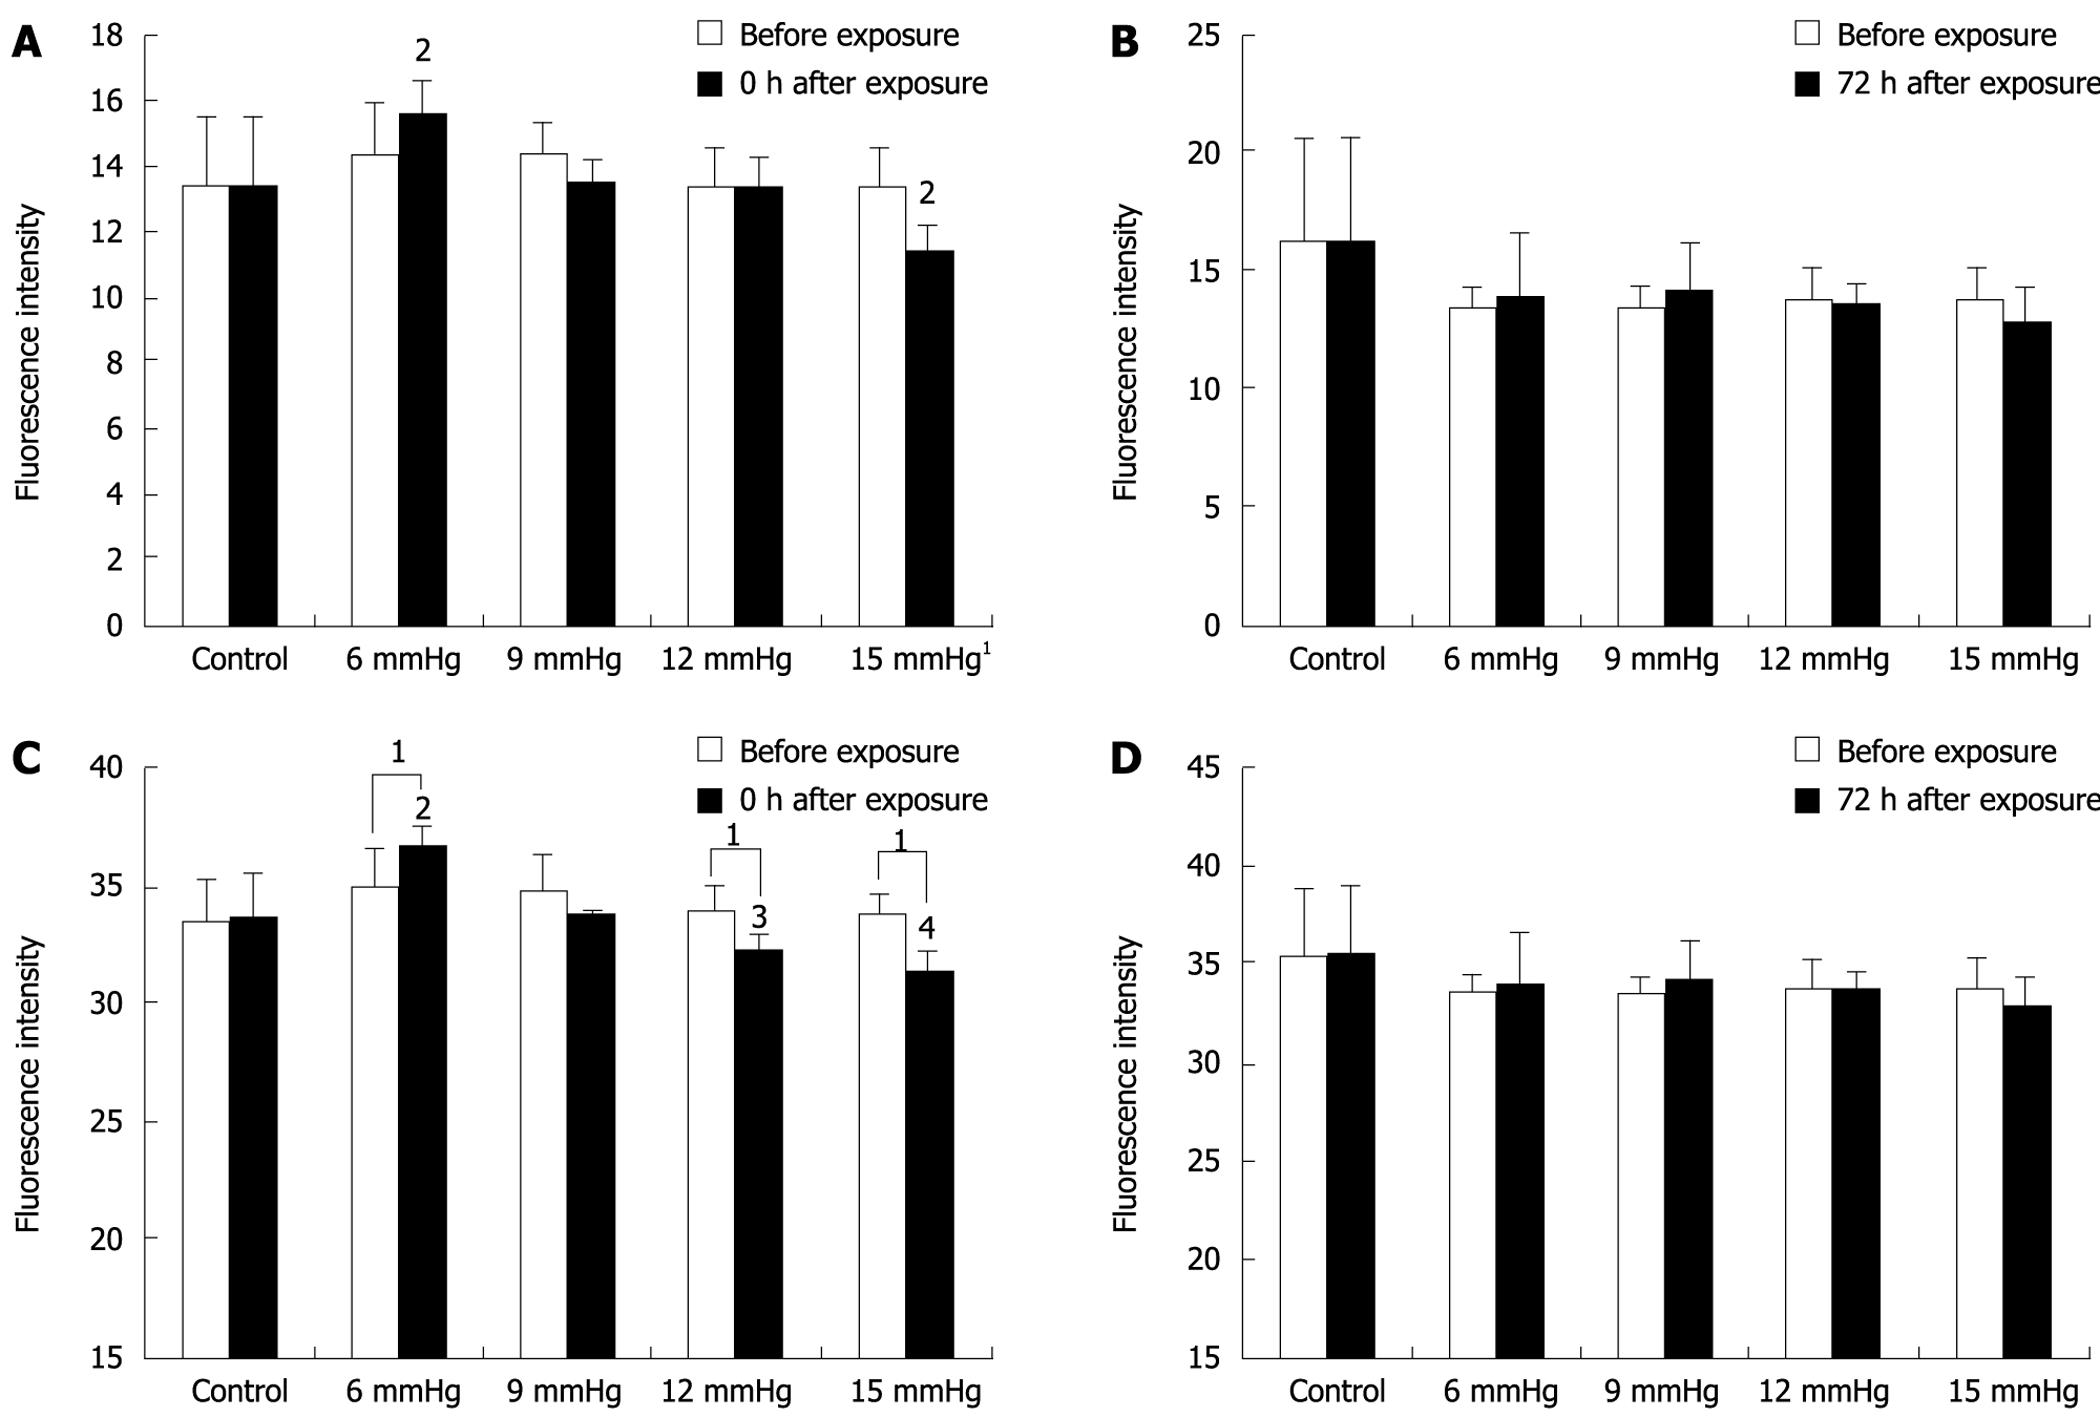
Figure 5 Results of invasion assay.
A: SW1116, 0 h after exposure; B: SW1116, 72 h after exposure; C: Lovo, 0 h after exposure; D: Lovo, 72 h after exposure. A: 1At 0 h after exposure to 15 mmHg CO2 insufflation, invasive cells decreased significantly compared to the cells prior to exposure (P = 0.019); 2At 0 h after exposure, invasion of the 6 mmHg or the 15 mmHg group was significantly different from the other pressure groups (P < 0.05). B: The invasion fluorescence intensities of SW1116 before and 72 h after exposure to CO2 insufflation were not significantly different (P > 0.05). Seventy two hours after the CO2 insufflation, there were no significant differences between the various insufflation pressure groups (P > 0.05); C: 1At 0 h after exposure to 15 mmHg, 12 mmHg or 6 mmHg CO2 insufflation, invasive cells of Lovo decreased significantly compared to the cells prior to exposure (P = 0.008, P = 0.0045, P = 0.043); 2At 0 h after exposure, cell invasion at 6 mmHg was significantly different from the other pressure groups (P < 0.01); 3At 0 h after exposure, cell invasion in the 12 mmHg group was significantly less than the 9 mmHg group (P < 0.05); 4At 0 h after exposure, cell invasion in the 15 mmHg group was significantly less than the 6 and 9 mmHg groups (P < 0.01); D: The invasion fluorescence intensities of Lovo before and 72 h after exposure to CO2 insufflation were not significantly different (P > 0.05). Seventy two hours after CO2 insufflation, there were no significant differences between the various insufflation pressure groups (P > 0.05).
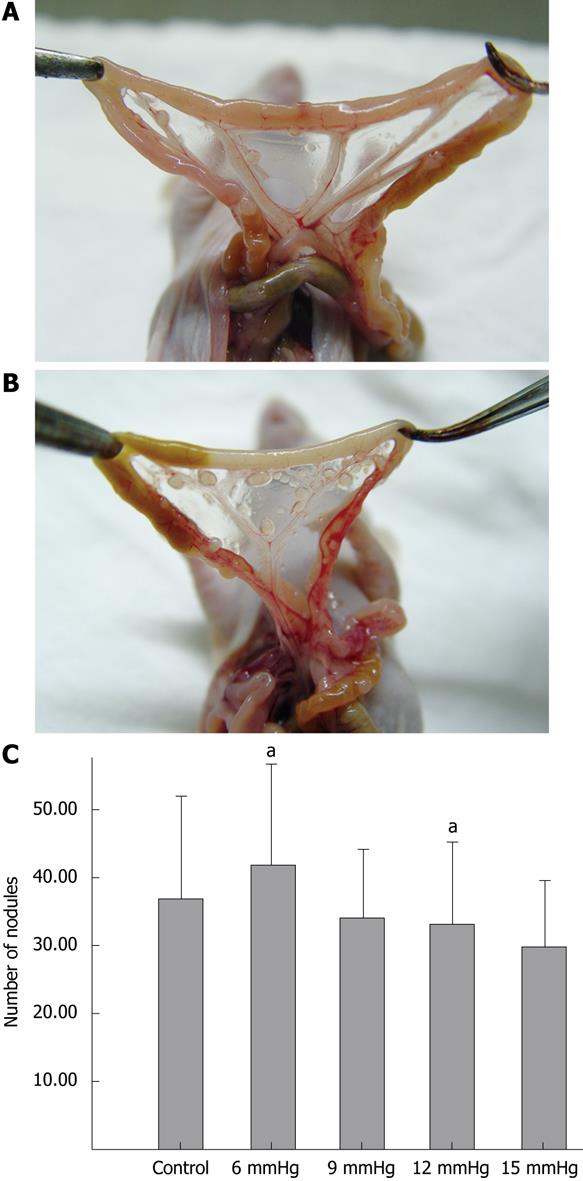
Figure 6 Results of intra-abdominal tumor nodules.
A: Mesentery tumor nodules in the 15 mmHg group; B: Mesentery tumor nodules in the 6 mmHg group; C: Numbers of intra-abdominal tumor nodules in the various groups. The number of intra-abdominal tumor nodules in the 15 mmHg group (A) was significantly lower than those in 6 mmHg group (B) (aP = 0.046). The mean numbers of abdominal cavity nodules formed by the cells in each group are described in (C).
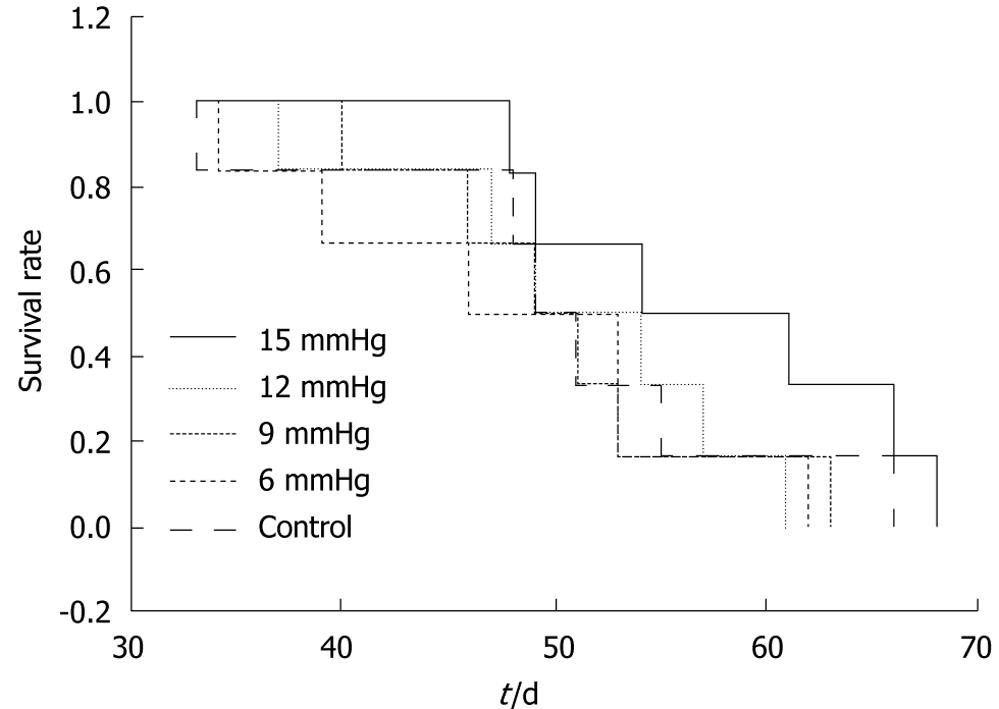
Figure 7 Survival time of the mice injected with SW1116 cells in the different groups (P = 0.
426).
- Citation: Ma JJ, Feng B, Zhang Y, Li JW, Lu AG, Wang ML, Peng YF, Hu WG, Yue F, Zheng MH. Higher CO2-insufflation pressure inhibits the expression of adhesion molecules and the invasion potential of colon cancer cells. World J Gastroenterol 2009; 15(22): 2714-2722
- URL: https://www.wjgnet.com/1007-9327/full/v15/i22/2714.htm
- DOI: https://dx.doi.org/10.3748/wjg.15.2714


