Copyright
©2009 The WJG Press and Baishideng.
World J Gastroenterol. Jun 7, 2009; 15(21): 2595-2601
Published online Jun 7, 2009. doi: 10.3748/wjg.15.2595
Published online Jun 7, 2009. doi: 10.3748/wjg.15.2595
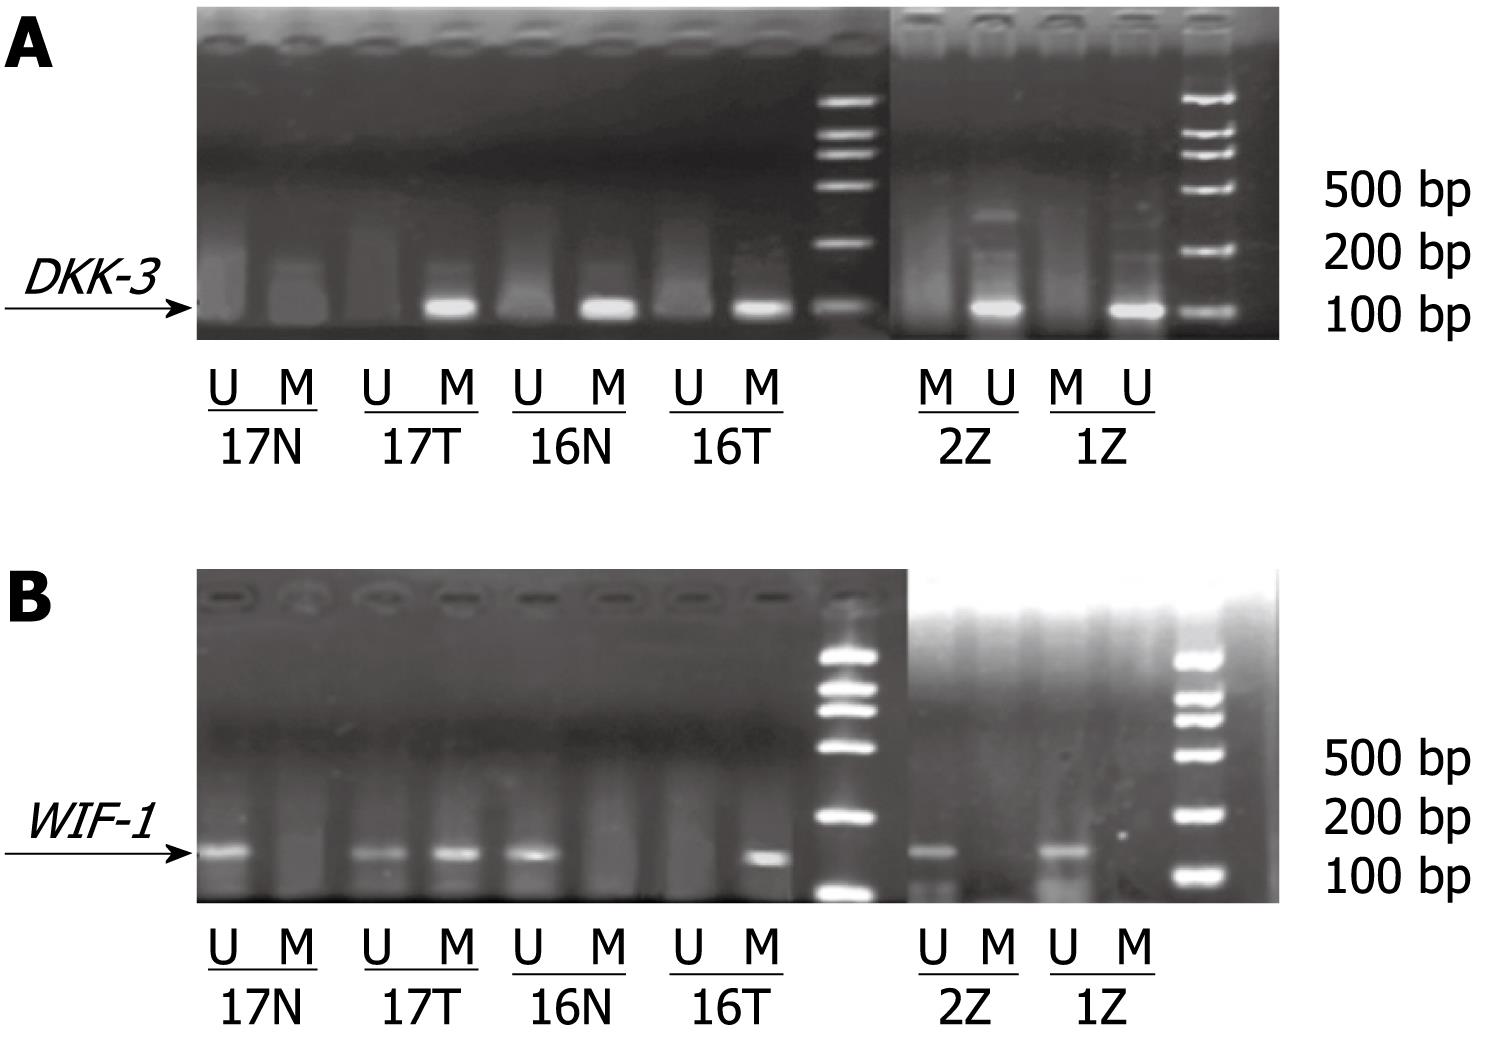
Figure 1 DKK-3 (A) and WIF-1 (B) MSP electrophoretogram.
T: HCC tissues; N: Adjacent non-cancerous tissues; Z: Control tissues; M: Methylation-specific PCR products bands; U: Unmethylation-specific PCR products bands.
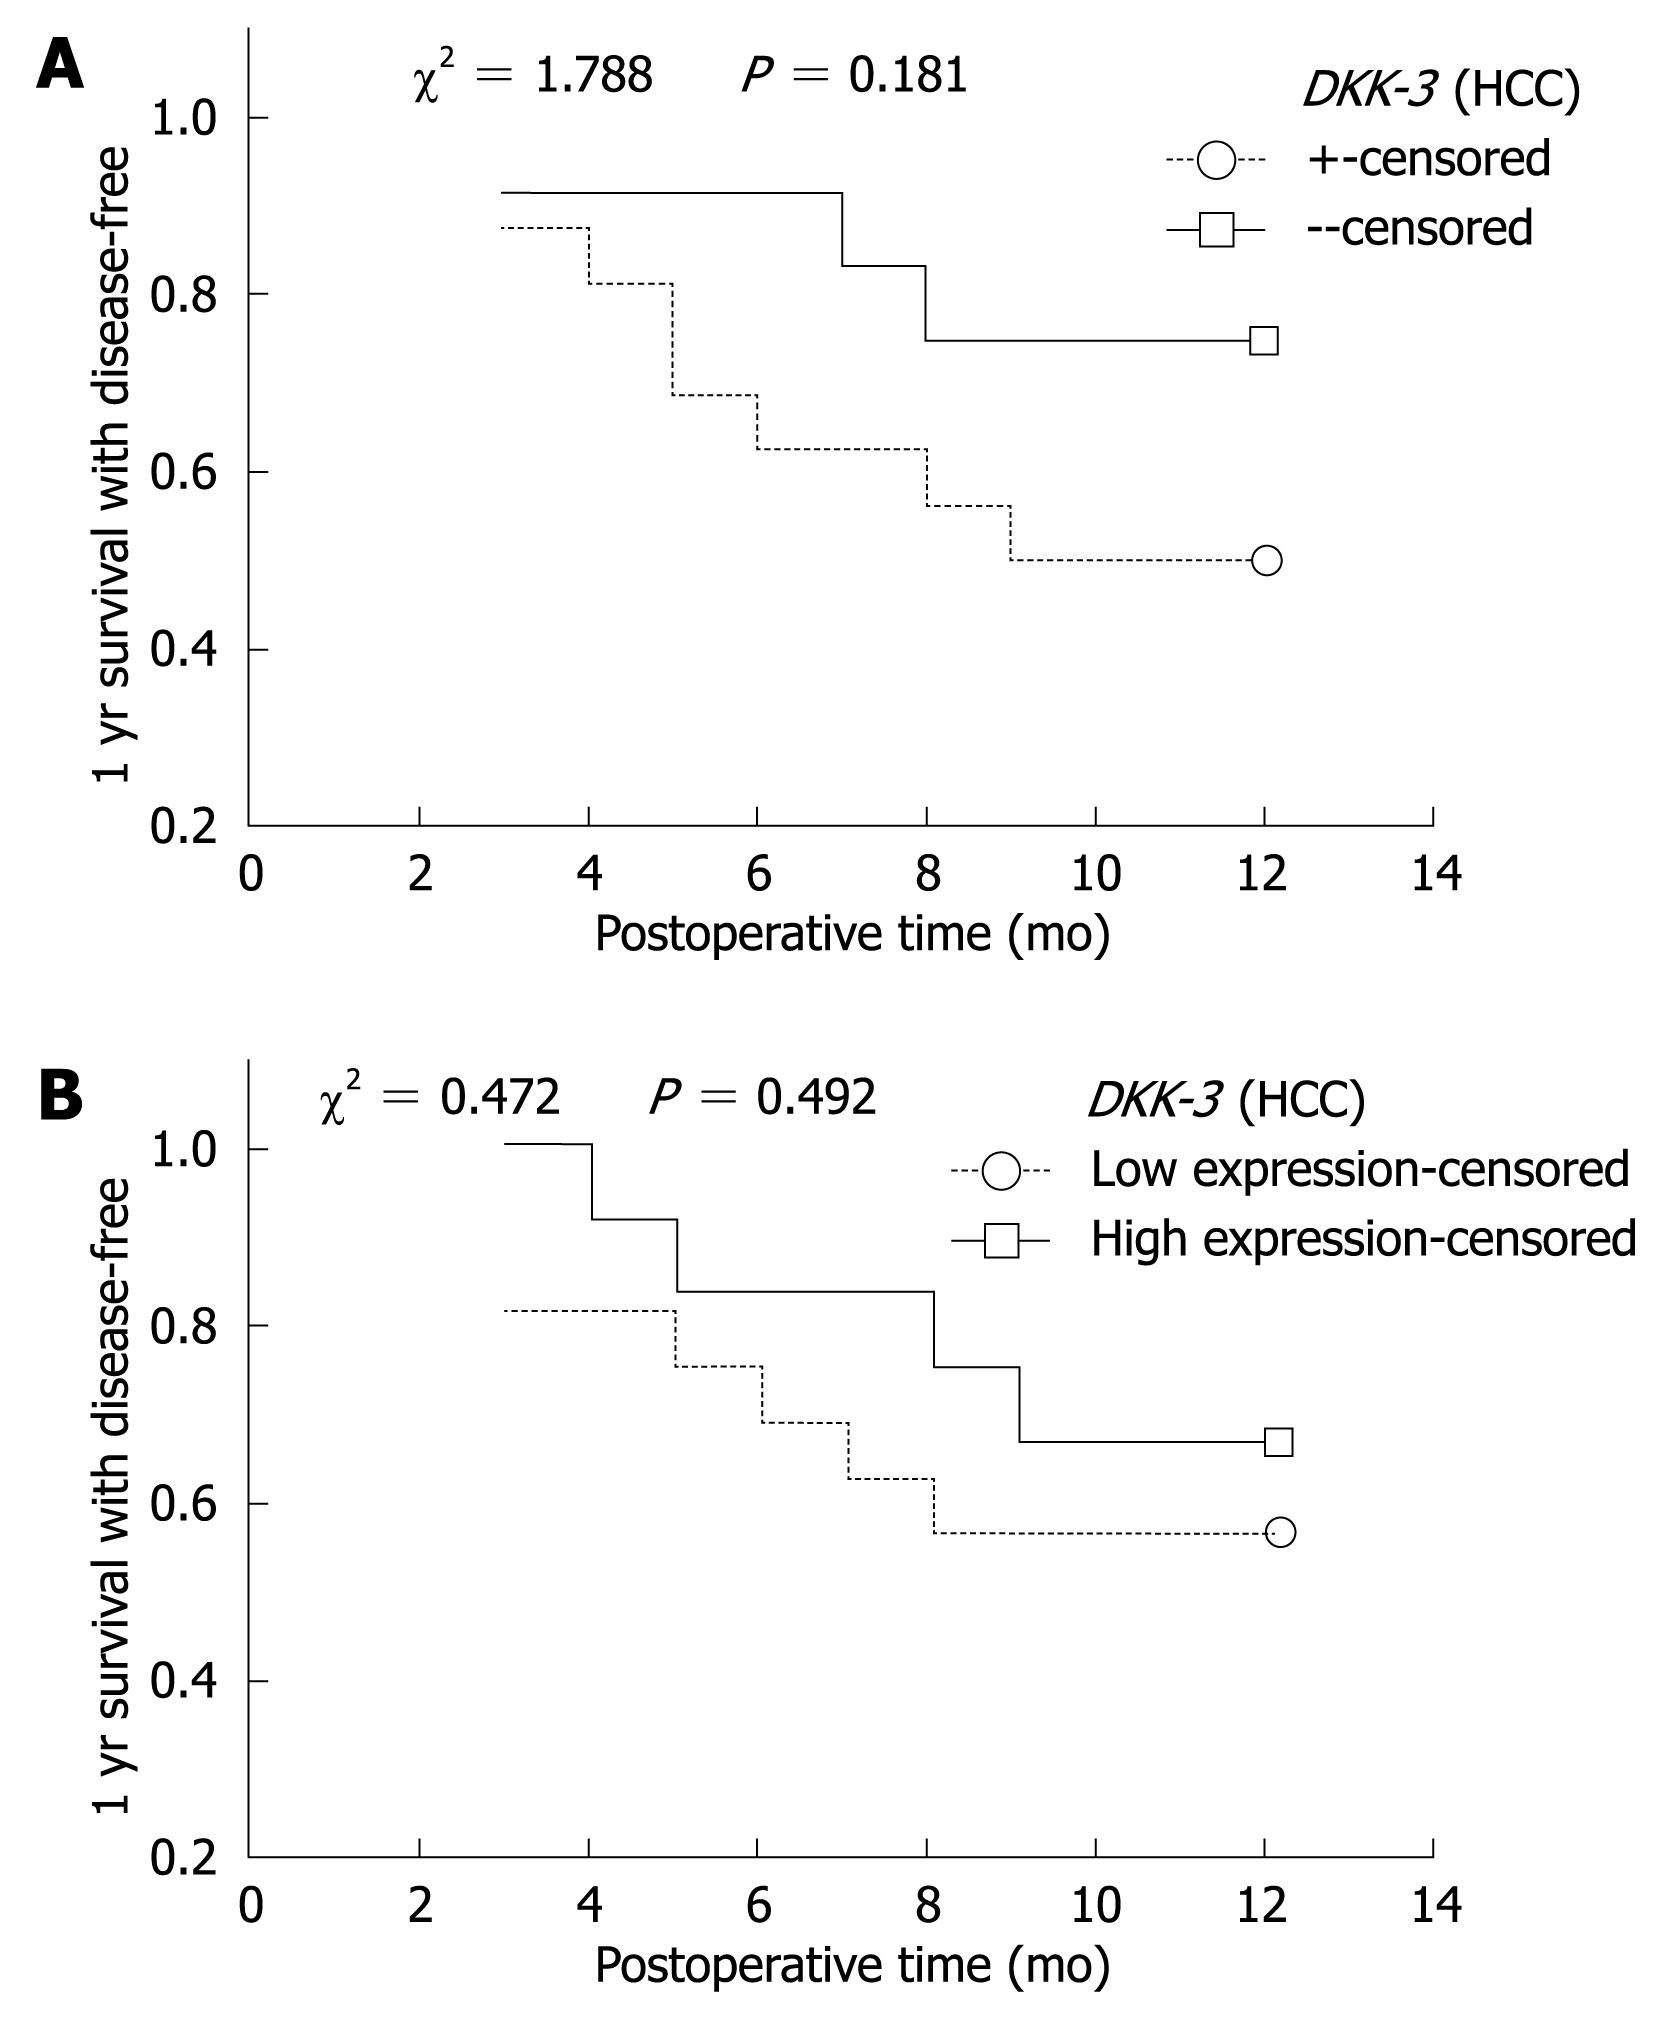
Figure 2 Relationship between methylation (A) and mRNA expression (B) of DKK-3 gene and 1-year disease-free survival in HCC tissues.
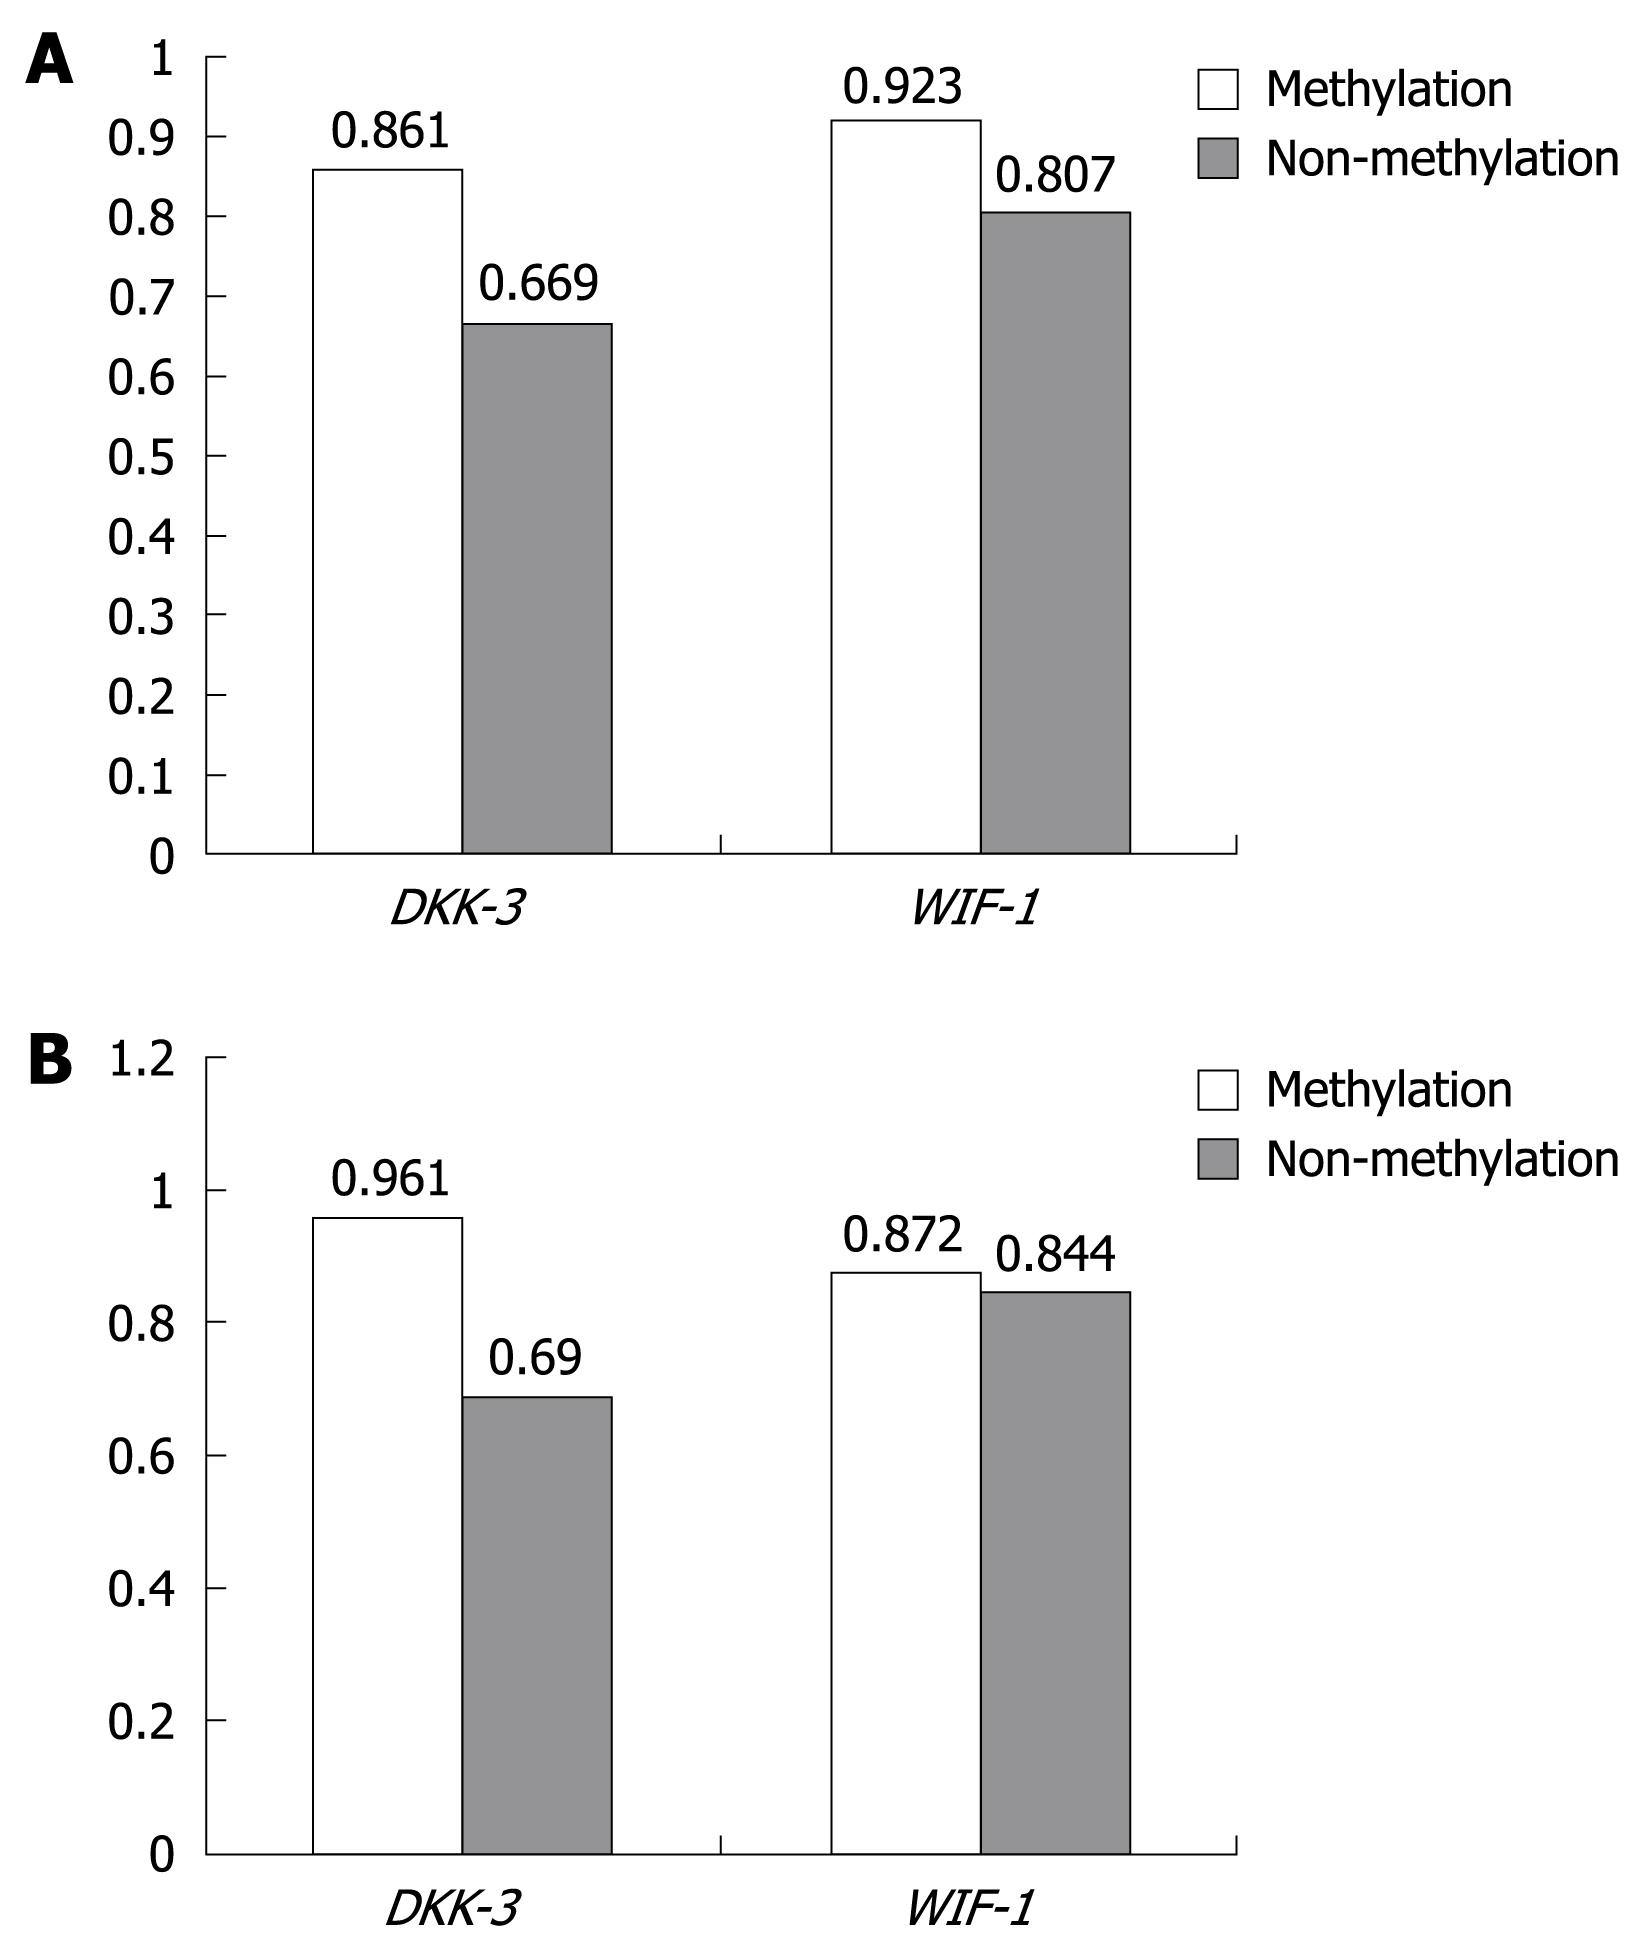
Figure 3 Relationship between methylation and mRNA expression of DKK-3 and WIF-1 in HCC (A) and adjacent non-cancerous tissues (B).
P > 0.05.
-
Citation: Ding Z, Qian YB, Zhu LX, Xiong QR. Promoter methylation and mRNA expression of
DKK-3 andWIF-1 in hepatocellular carcinoma. World J Gastroenterol 2009; 15(21): 2595-2601 - URL: https://www.wjgnet.com/1007-9327/full/v15/i21/2595.htm
- DOI: https://dx.doi.org/10.3748/wjg.15.2595


