Copyright
©2009 The WJG Press and Baishideng.
World J Gastroenterol. May 28, 2009; 15(20): 2512-2519
Published online May 28, 2009. doi: 10.3748/wjg.15.2512
Published online May 28, 2009. doi: 10.3748/wjg.15.2512
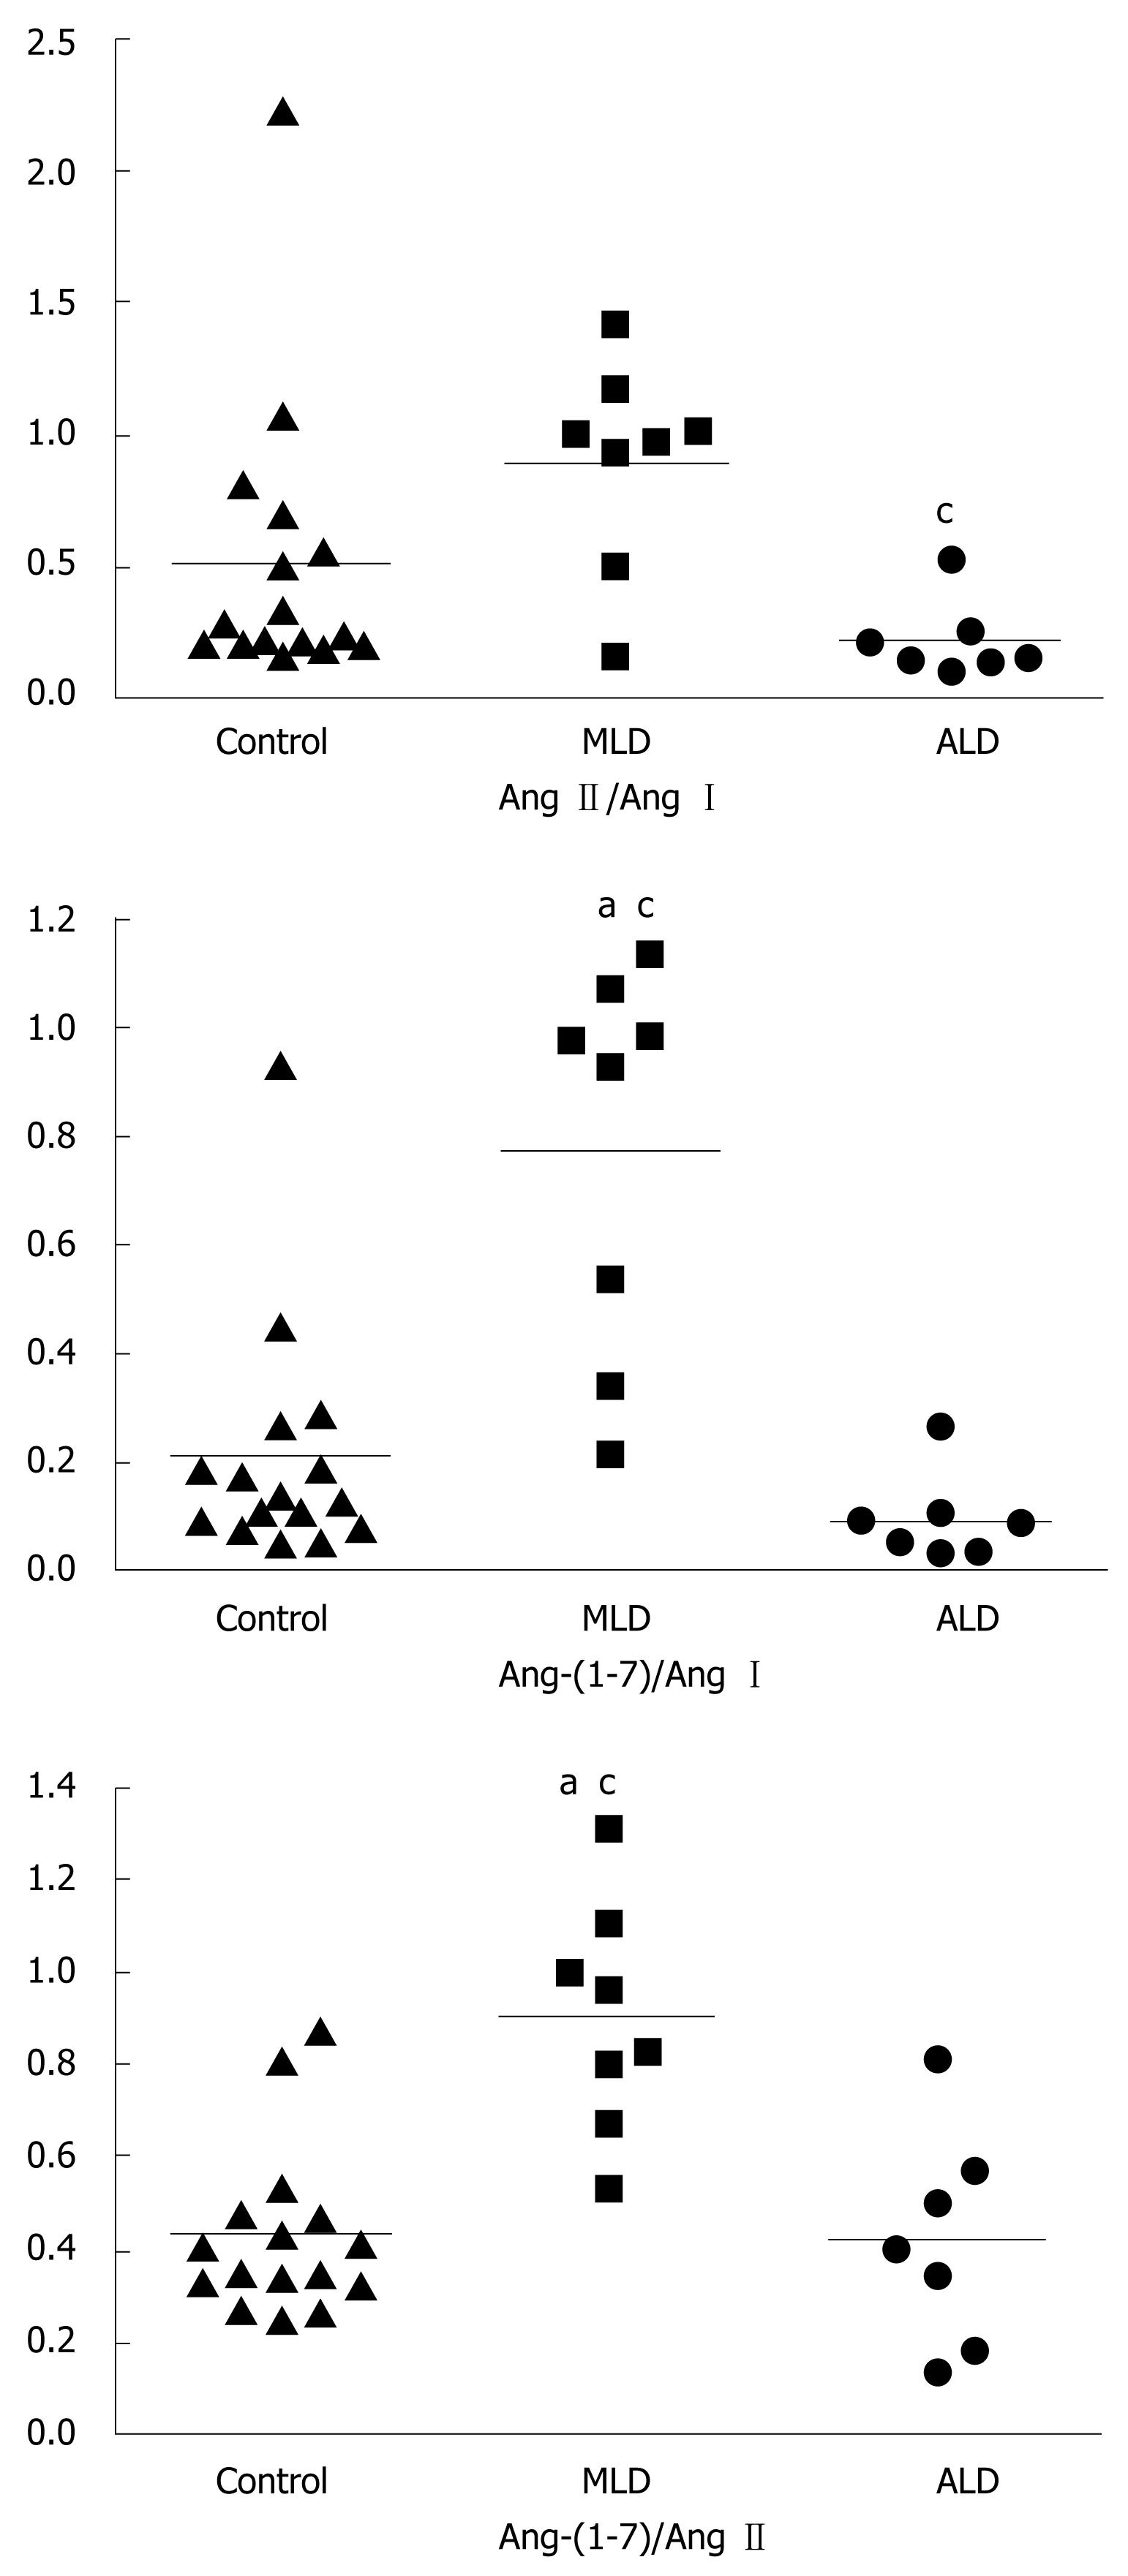
Figure 1 Ratios between angiotensins in healthy controls, and in patients with mild-to-moderate (MLD) and advanced liver disease (ALD).
aP < 0.05 for the comparisons with the control group (Kruskal-Wallis followed by Dunn test for median comparisons). cP < 0.05 for the comparison between the MLD and ALD groups (Kruskal-Wallis followed by the Dunn test for median comparisons). Ang I: Angiotensin I; Ang II : Angiotensin II; Ang-(1-7): Angiotensin-(1-7).
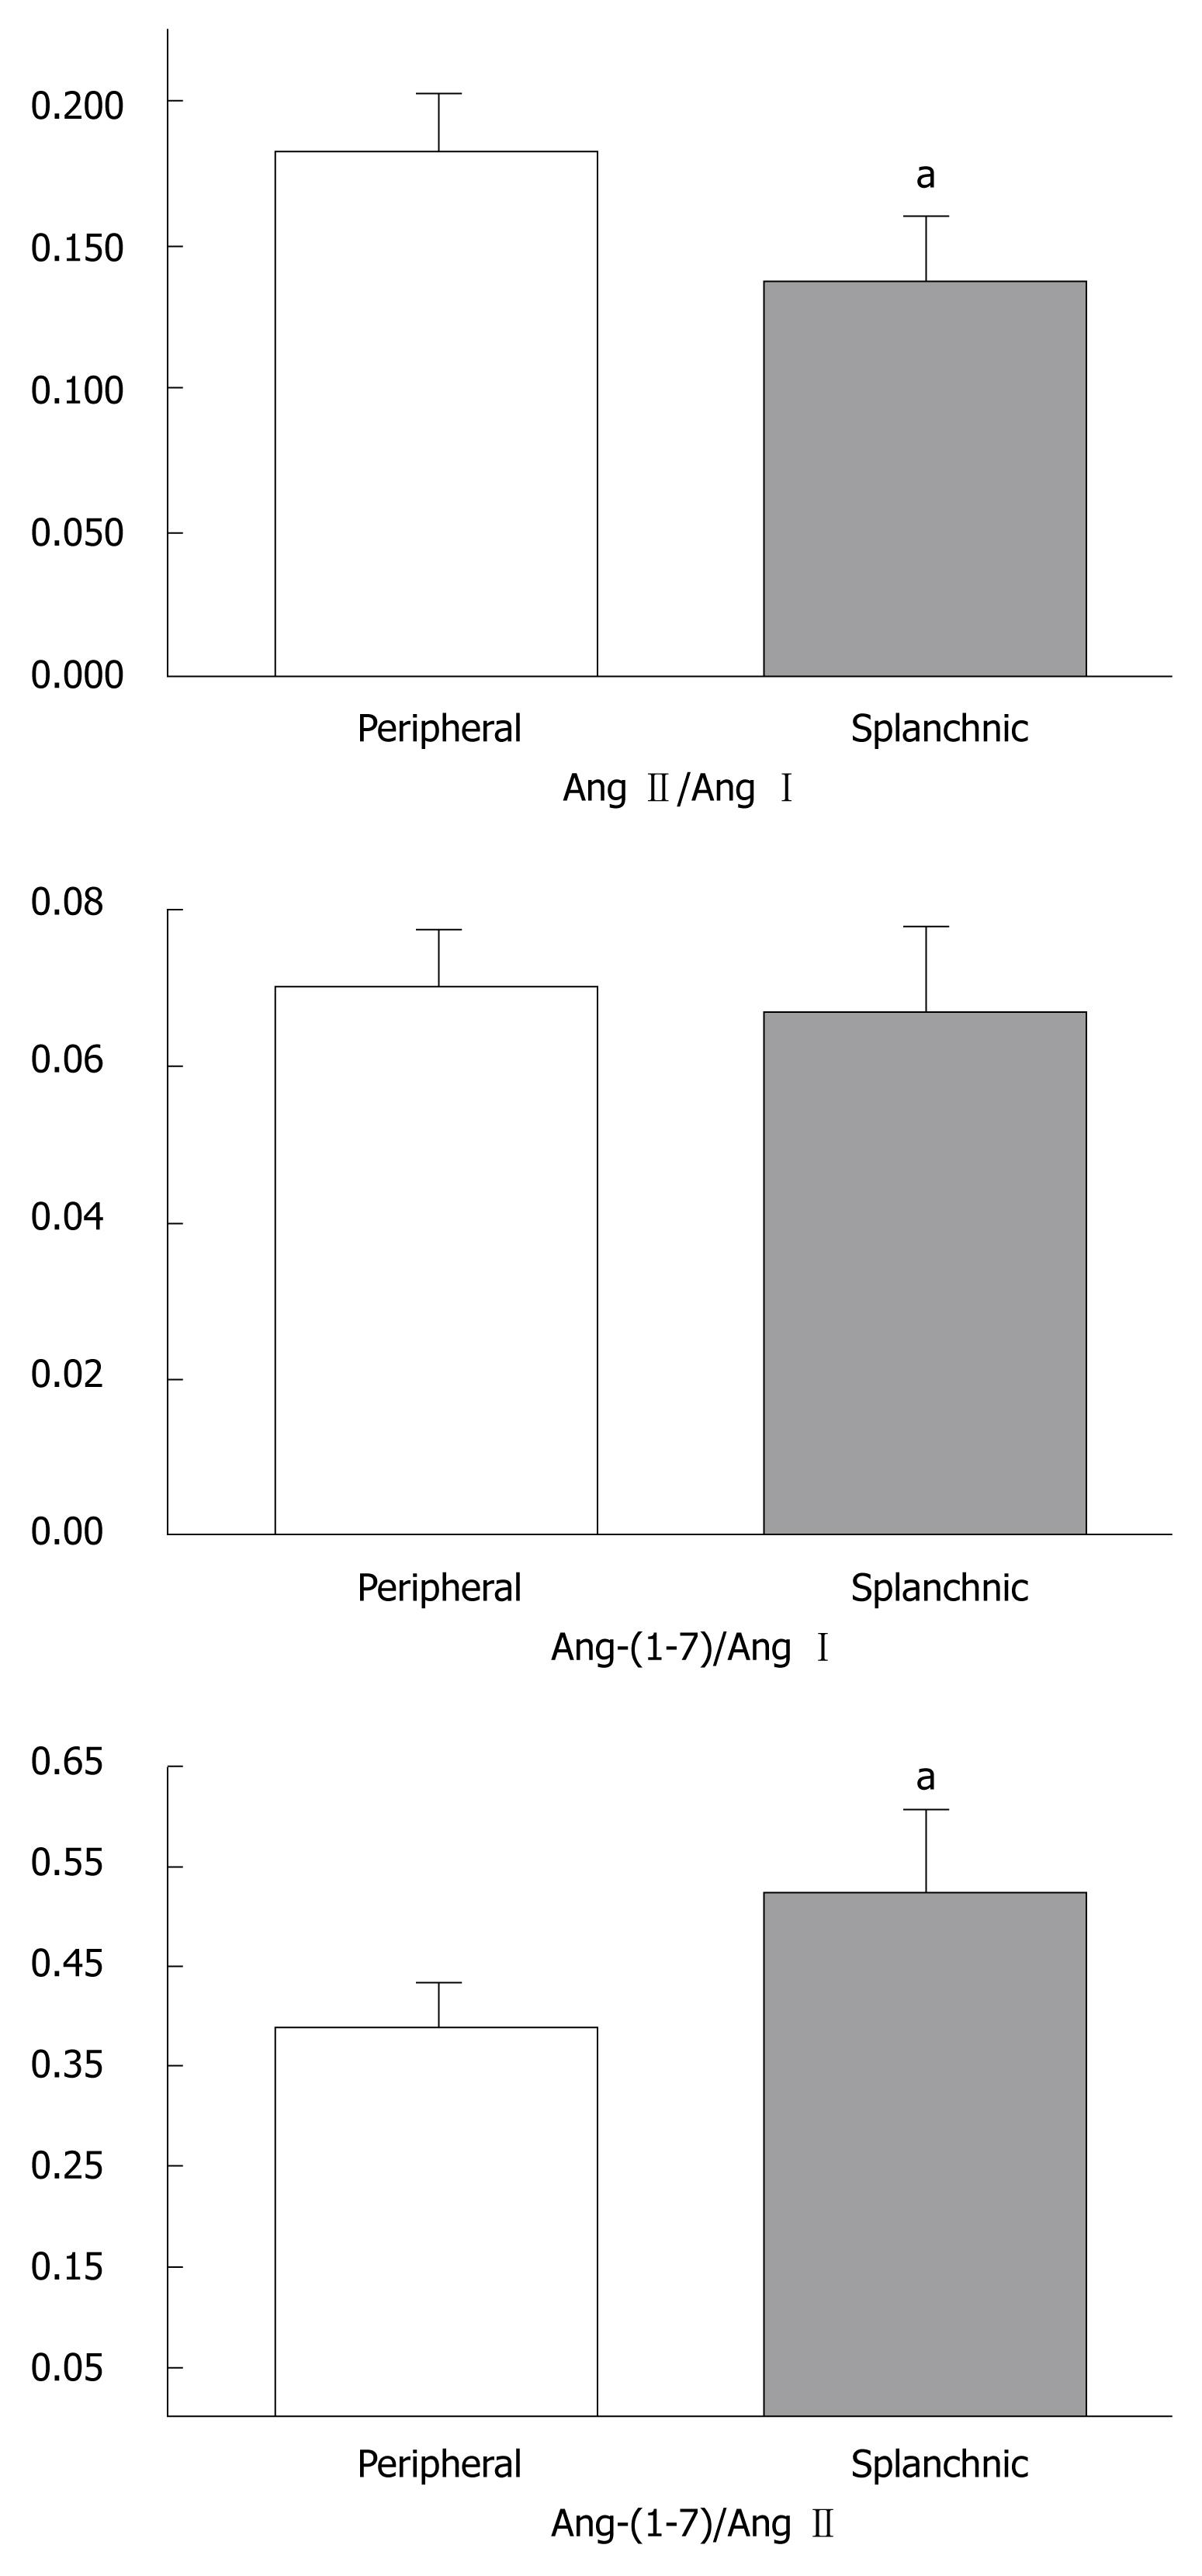
Figure 2 Ratios between angiotensins in the peripheral and splanchnic circulations of liver transplanted patients during the pre-anhepatic stage of liver transplantation.
aP < 0.05 for the comparison between the peripheral and splanchnic ratios (paired Student t-test). Ang I: Angiotensin I; Ang II: Angiotensin II; Ang-(1-7): Angiotensin-(1-7).
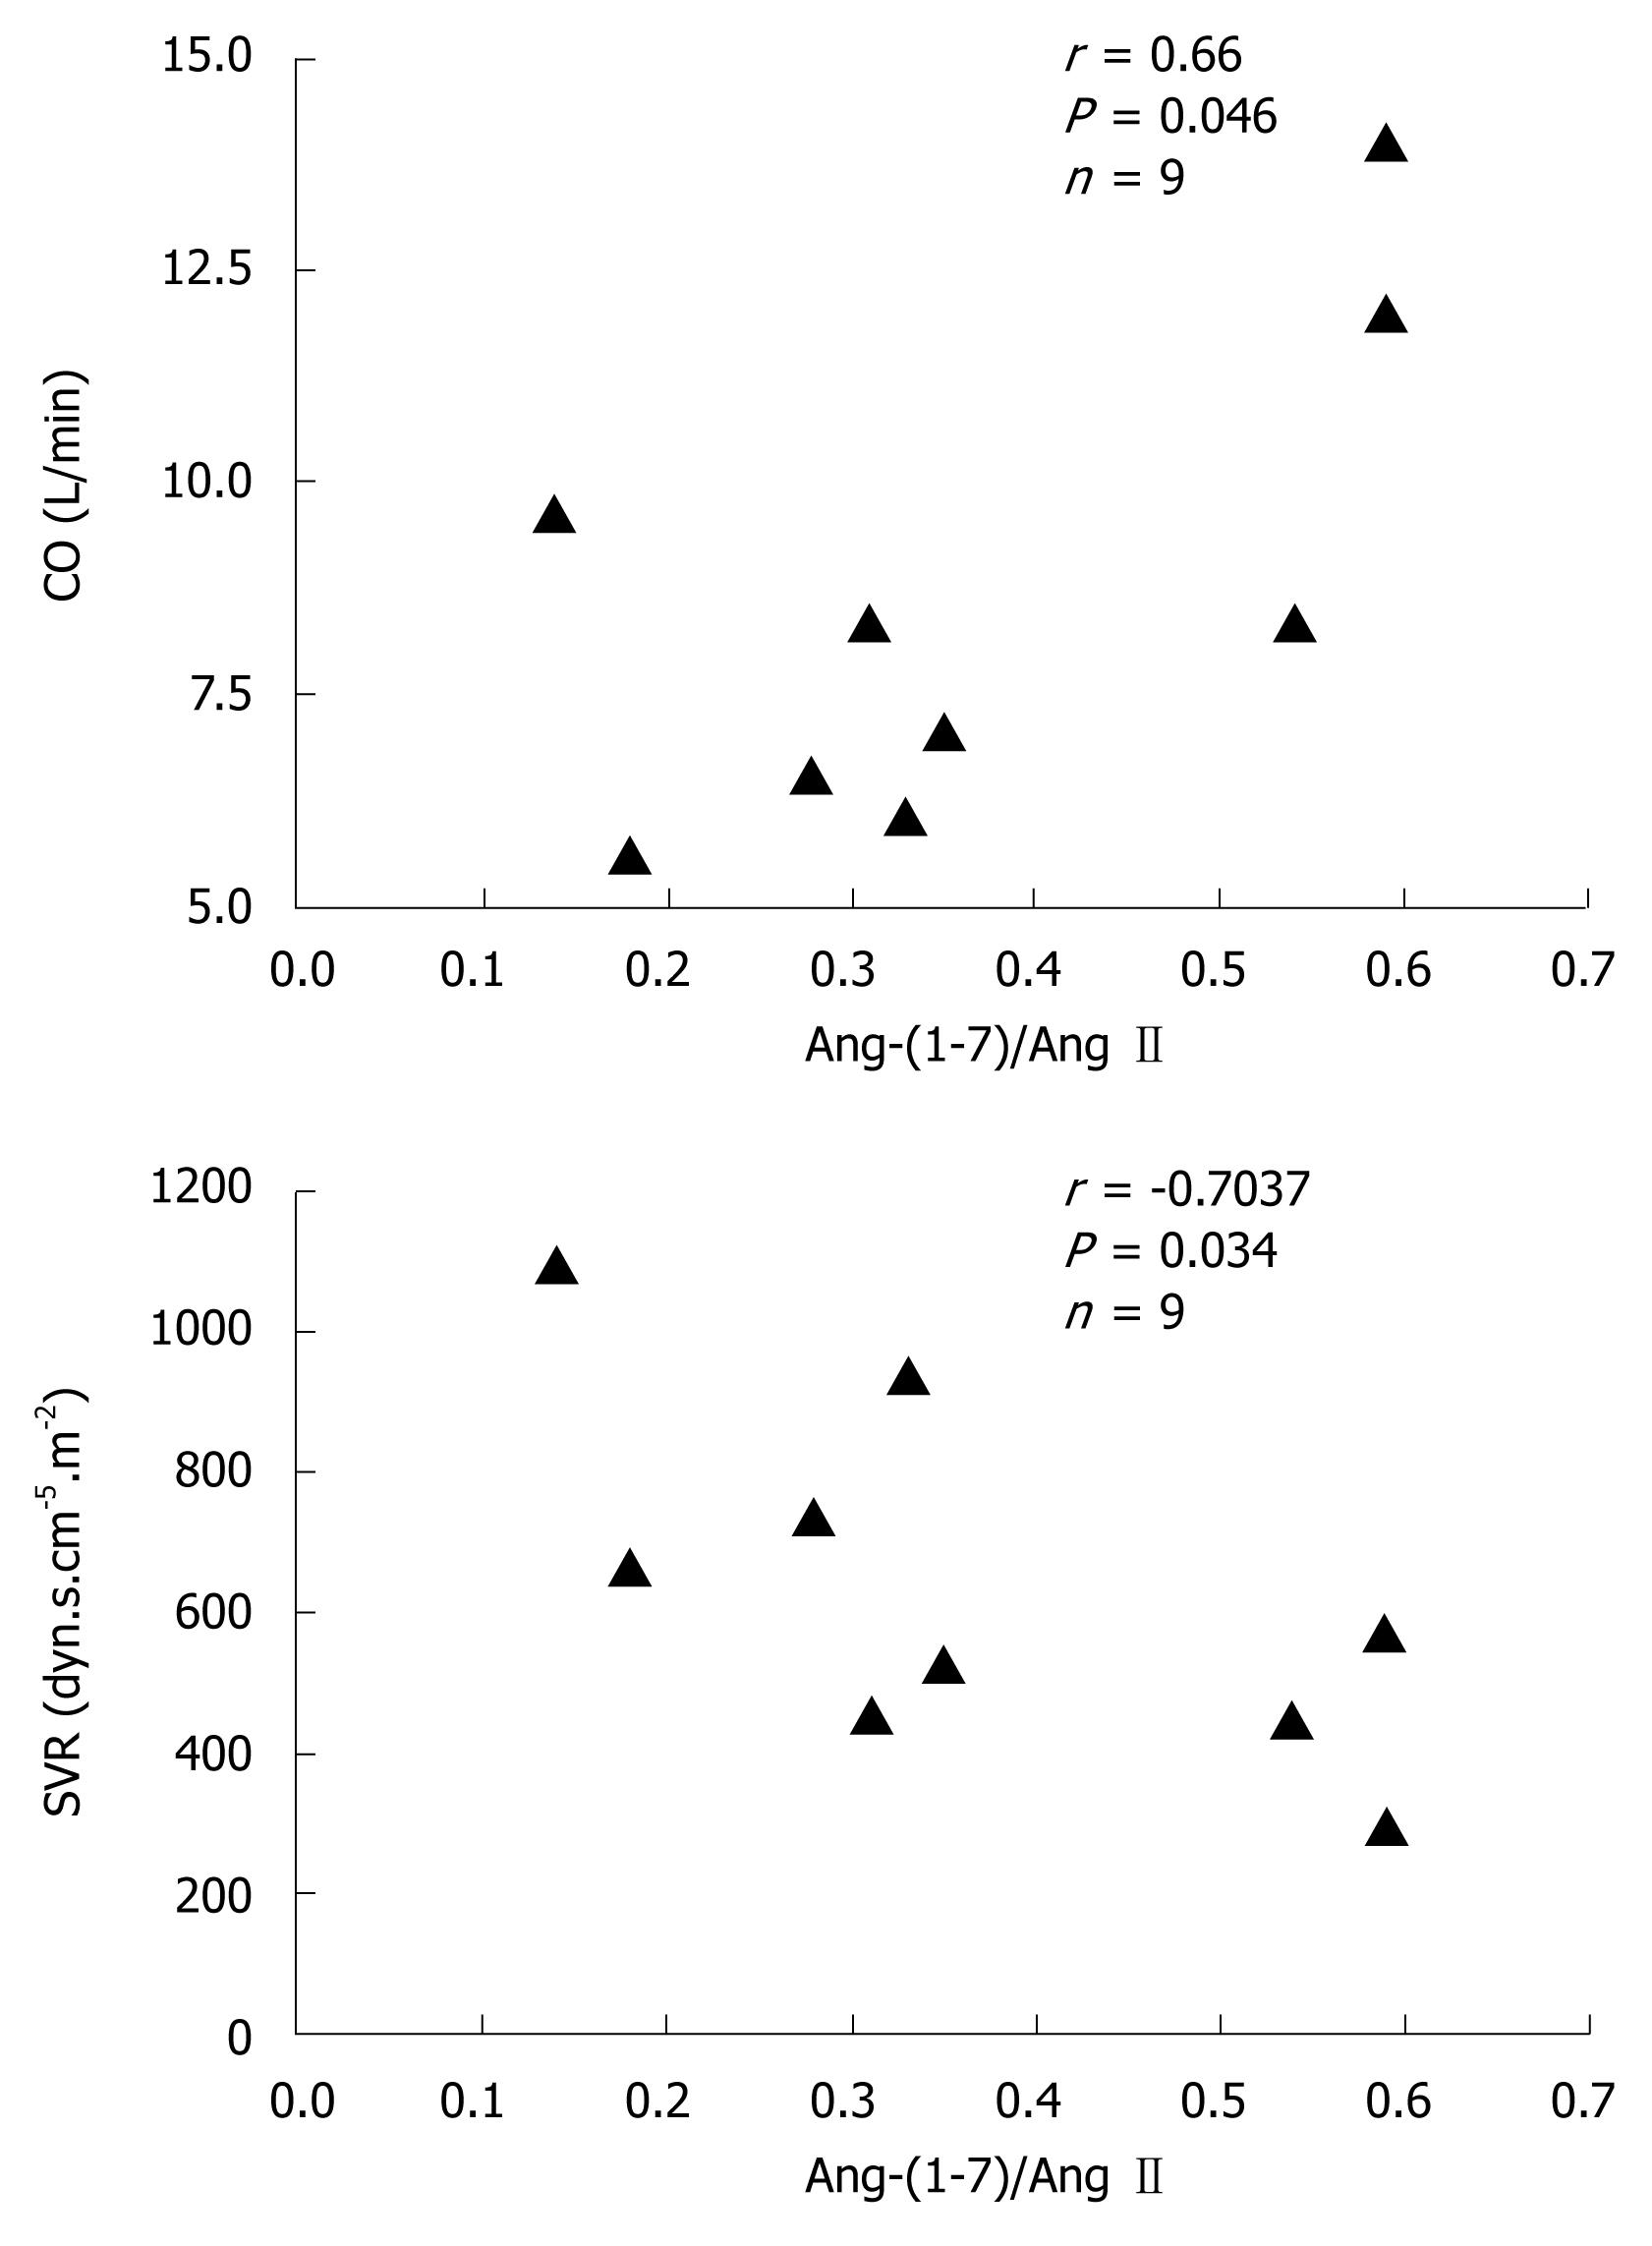
Figure 3 Correlations between Ang-(1-7)/Ang II ratios and CO and SVR.
Correlation coefficients (r) and P values were calculated by Spearman’s test.
- Citation: Vilas-Boas WW, Ribeiro-Oliveira Jr A, Pereira RM, Ribeiro RDC, Almeida J, Nadu AP, Simões e Silva AC, Santos RASD. Relationship between angiotensin-(1-7) and angiotensin II correlates with hemodynamic changes in human liver cirrhosis. World J Gastroenterol 2009; 15(20): 2512-2519
- URL: https://www.wjgnet.com/1007-9327/full/v15/i20/2512.htm
- DOI: https://dx.doi.org/10.3748/wjg.15.2512


