Copyright
©2009 The WJG Press and Baishideng.
World J Gastroenterol. Jan 14, 2009; 15(2): 182-191
Published online Jan 14, 2009. doi: 10.3748/wjg.15.182
Published online Jan 14, 2009. doi: 10.3748/wjg.15.182
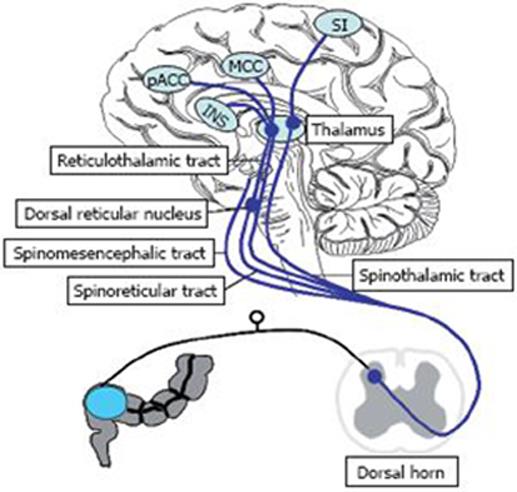
Figure 1 The principal visceral projections from the spinal cord to subcortial and cortical structures (blue lines).
The spinothalamic tract terminates in the medial and posterior thalamus. Thalamocortical fibres then project to the primary somatosensory cortex. The spinoreticular tract terminates in the reticular formation to the medial thalamus. The spinomesencephalic tract projects to various regions in the brainstem, including the periaqueductal grey, locus coeruleus, and dorsal reticular nucleus in the medulla. Thalamocortical projections from the medial thalamus project to the cingulate cortex and insula which are involved in processing noxious visceral and somatic information. The brain regions innervated by these pathways that respond to painful visceral stimuli include the thalamus, insula, amygdala and anterior cingulate cortex (ACC). The ACC is comprised of two components, the perigenual ACC (pACC) involved in affect and the mid cingulate cortex (MCC) with behavioural response modification. Other pathways for transmission of noxious visceral stimuli (such as the dorsal column pathway), exist, but are not shown here.
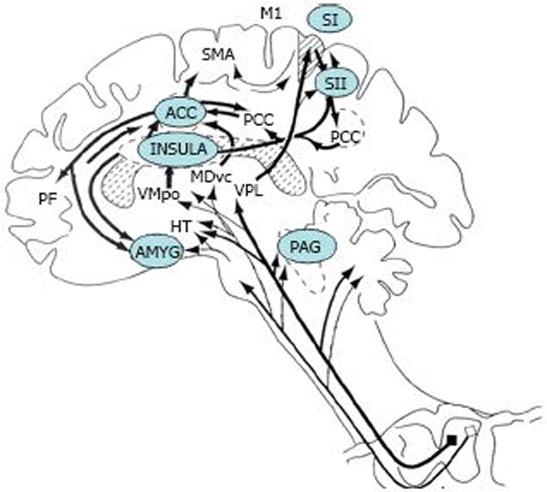
Figure 2 The subcortical and cortical structures that have been shown to be activated in response to visceral pain.
PAG: Periaqueductal grey; PB: Parabrachial nucleus of the dorsolateral pons; VMpo: Ventromedial part of the posterior thalamic nuclear complex; MDvc: Ventrocaudal part of the medial thalamic dorsal nucleus; VPL: Ventroposterior lateral thalamic nucleus; ACC: Anterior cingulate cortex; PCC: Posterior cingulate cortex; HT: Hypothalamus; S1, S2: First and second somatosensory cortical areas, respectively; PPC: Posterior parietal complex; SMA: Supplementary motor area; AMYG: Amygdala; PF: Prefrontal cortex; M1: Motor cortex. (Adapted from Price DD. Psychological and neural mechanisms of the affective dimension of pain. Science 2000; 288: 1769-1772).
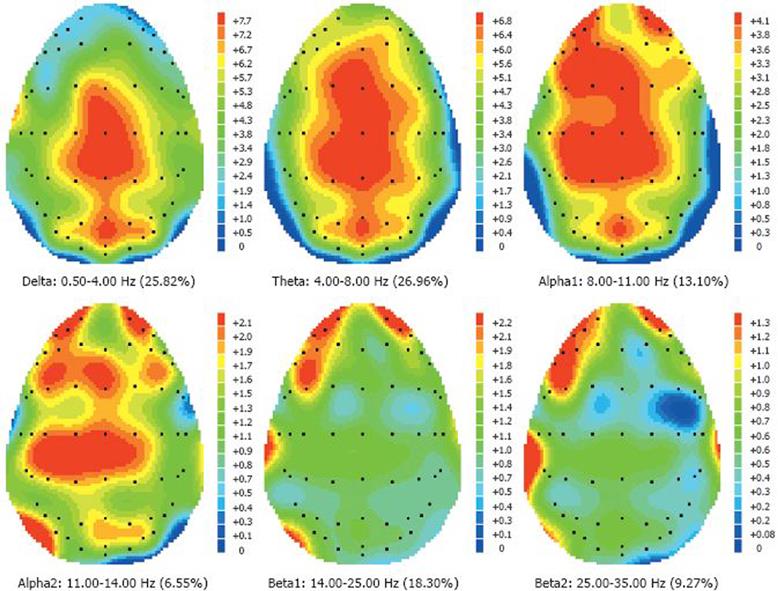
Figure 3 Example from painful CEP from the gut performed in a healthy volunteer.
The figure shows the topographies at different frequency bands from one subject, and the percentage of the presence of each frequency band in the overall signal. The black dots represent electrodes. The colours represent how much power a particular frequency band holds at each electrode. The scales describing the colours are to the right of the topographies.
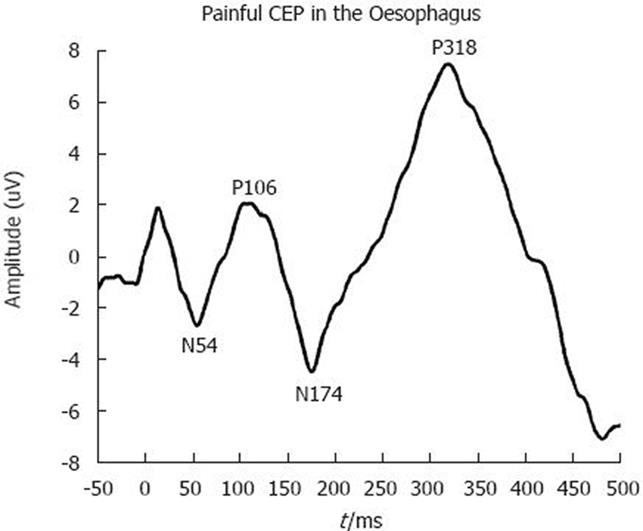
Figure 4 CEP at Cz electrode from a healthy volunteer.
The subject was electrically stimulated in the oesophagus through a 6-mm nasal endoscope. Electrical stimulation was at the pain threshold and this CEP is an average of 35 such stimulations.
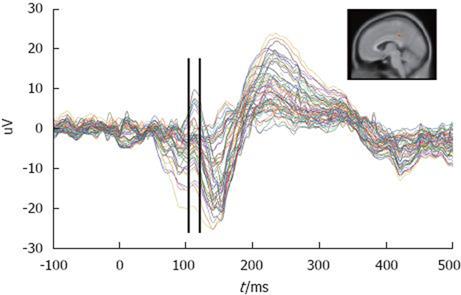
Figure 5 This is a butterfly plot of 62 channels (data of all 62 channels superimposed on each other).
The vertical lines mark the time course of the peak that was used for analysis. The red dot on the MRI image on the top right corner represents where the activity was calculated to be by MUSIC.
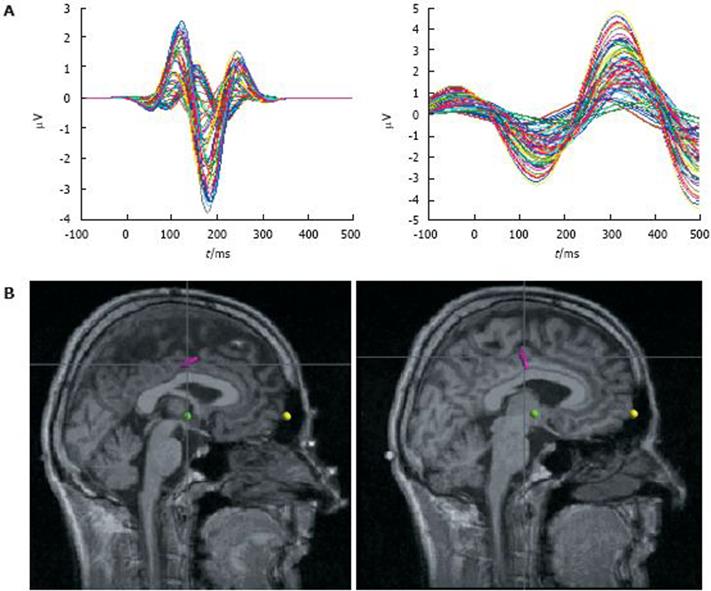
Figure 6 An example of two MMP atoms from painful CEPs in the oesophagus.
A: Butterfly plots of the atoms; B: Dipole location of each atom.
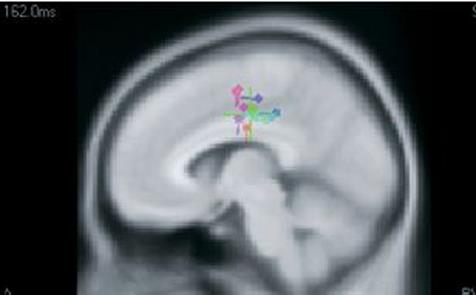
Figure 7 One of the clusters of cingulate dipoles generating CEPs following a painful stimulation in the gut in 10 subjects.
- Citation: Sharma A, Lelic D, Brock C, Paine P, Aziz Q. New technologies to investigate the brain-gut axis. World J Gastroenterol 2009; 15(2): 182-191
- URL: https://www.wjgnet.com/1007-9327/full/v15/i2/182.htm
- DOI: https://dx.doi.org/10.3748/wjg.15.182


