Copyright
©2009 The WJG Press and Baishideng.
World J Gastroenterol. May 21, 2009; 15(19): 2381-2388
Published online May 21, 2009. doi: 10.3748/wjg.15.2381
Published online May 21, 2009. doi: 10.3748/wjg.15.2381
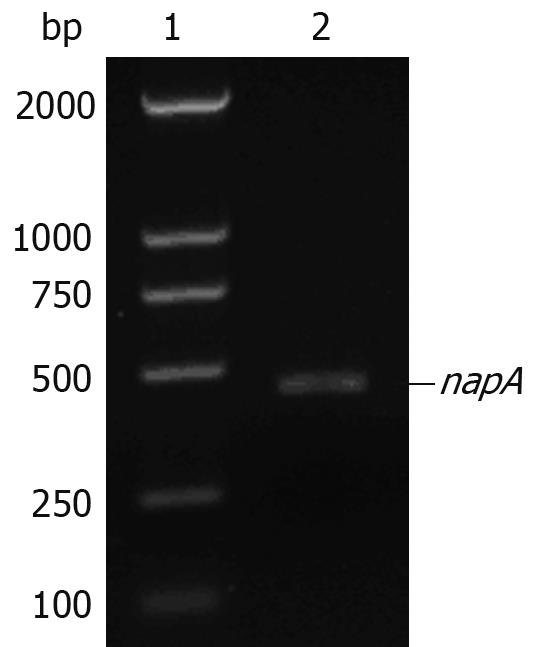
Figure 1 Agarose gel electrophoresis of napA gene amplified by PCR.
Lane 1: DL2000 DNA marker; lane 2: H pylori napA gene (435 bp).
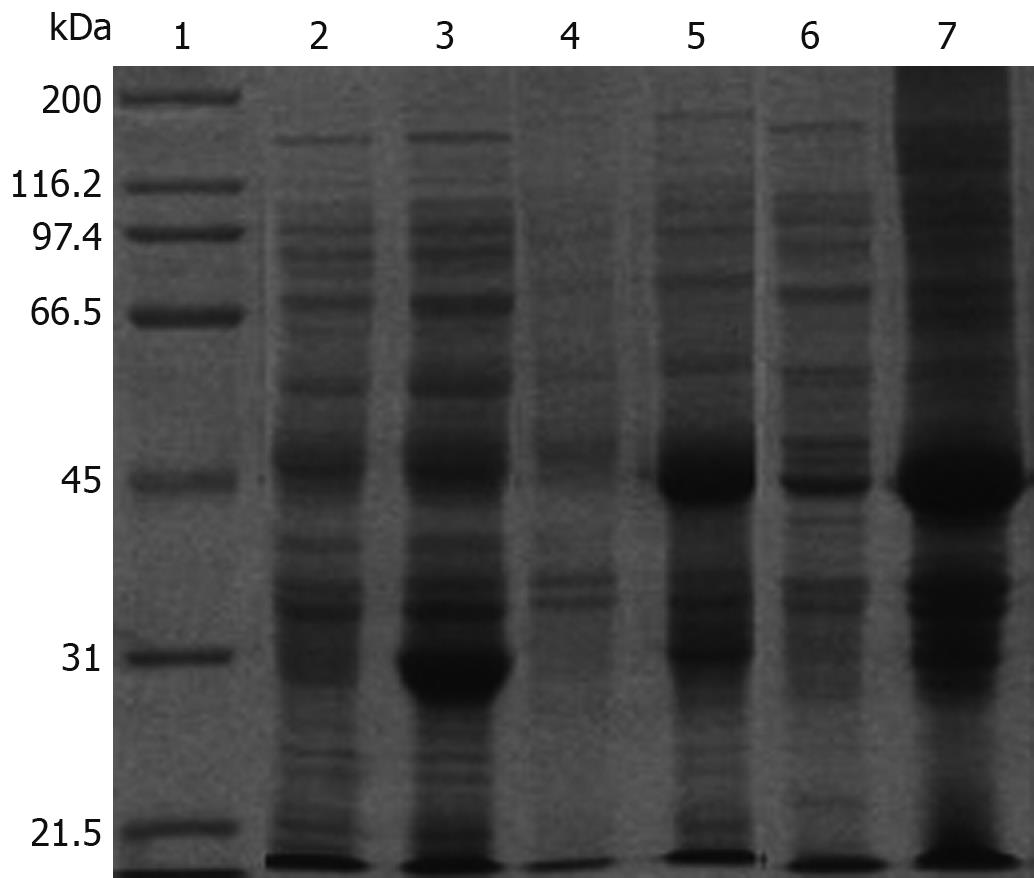
Figure 2 SDS-PAGE analysis of the expression of pGEX-4T-1/HP-NAP in E.
coli. Lane 1: Protein marker; Lane 2: pGEX-4T-1 before induction; Lane 3: pGEX-4T-1 after induction; Lane 4: pGEX-4T-1/HP-NAP before induction; Lane 5: pGEX-4T-1/HP-NAP after induction; Lane 6: Supernatant of E. coli after induction; Lane 7: Lysate of E. coli after induction.
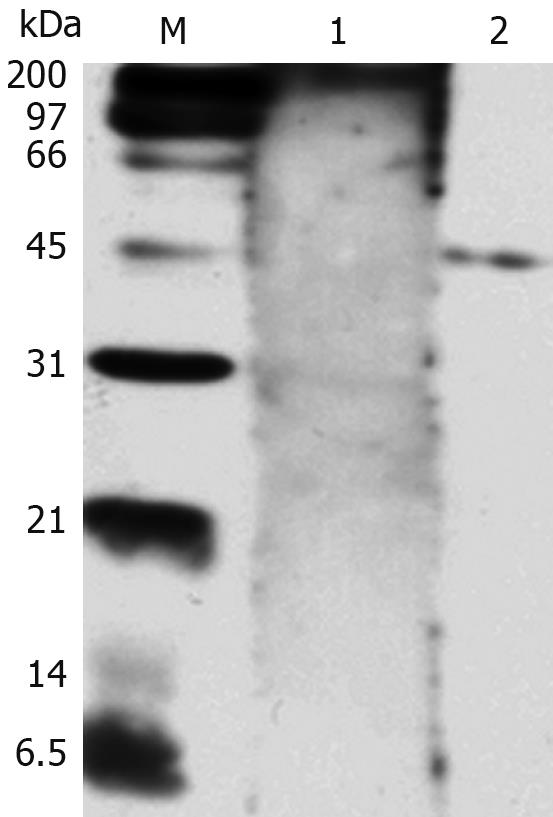
Figure 3 Western blotting analysis of HP-NAP reactivity with the positive serum from H pylori-infected patients.
Lane 1: Serum from a control patient not infected with H pylori; Lane 2: Serum from a patient infected with H pylori; M: Protein marker.
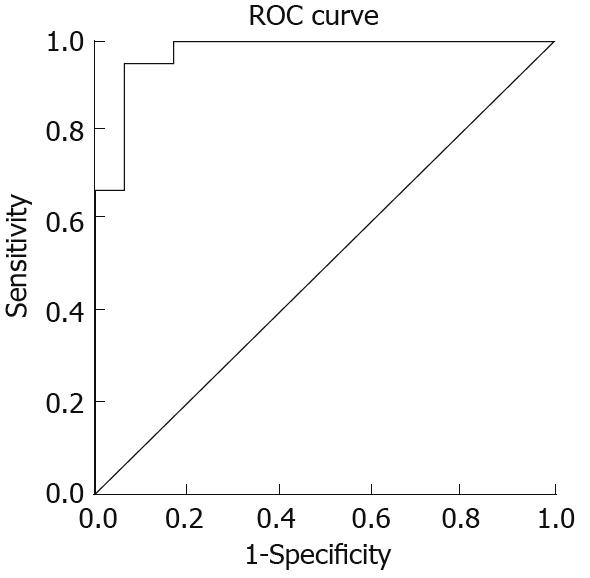
Figure 4 Receiver operating characteristic curve analysis showing the cut-off value for anti-HP-NAP antibodies in serum from patients with gastric cancer, peptic ulcer, chronic gastritis and healthy controls, respectively.
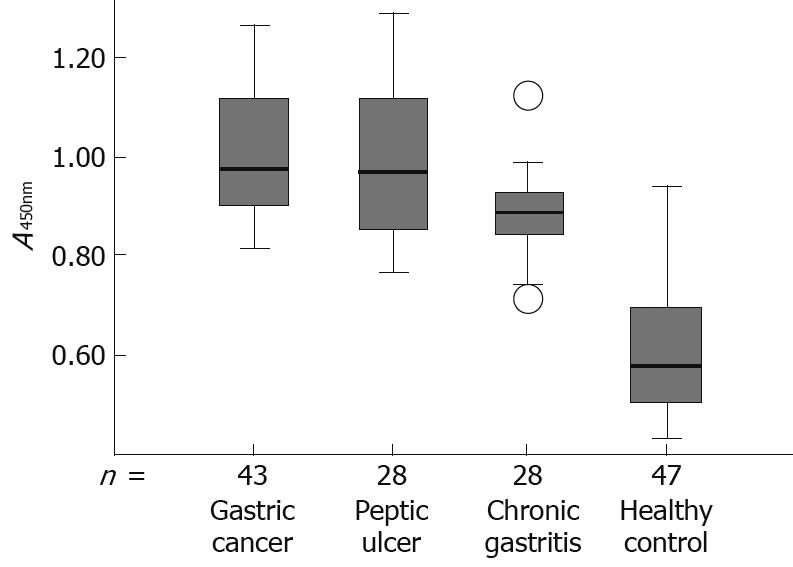
Figure 5 Box plot demonstrating the level of antibodies against HP-NAP in serum from patients with gastric cancer, peptic ulcer, chronic gastritis and healthy controls, respectively.
The box plot showing the 5th and 95th percentiles (bars), the 75th and 25th percentiles (boxes), and the median (bars in boxes), respectively. n: Number of individuals in each group.
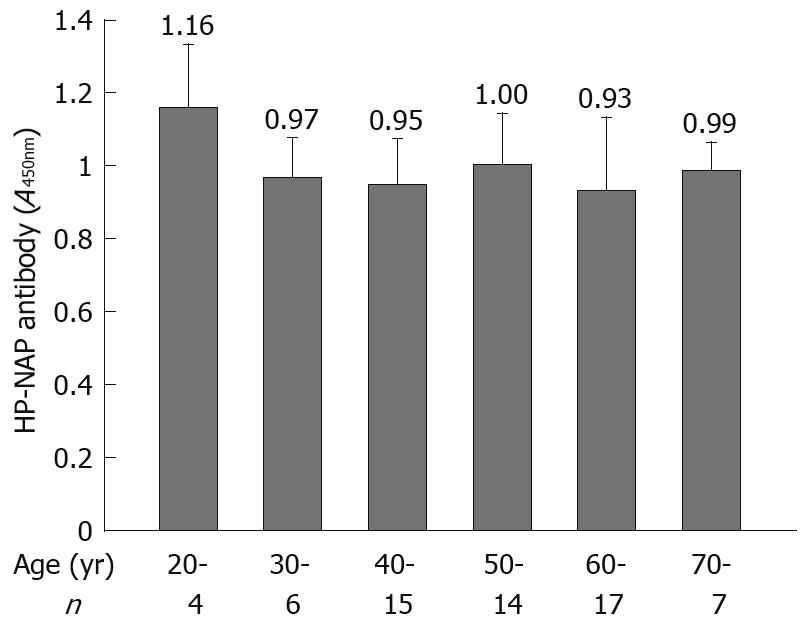
Figure 6 Comparison of HP-NAP antibody levels in different age groups.
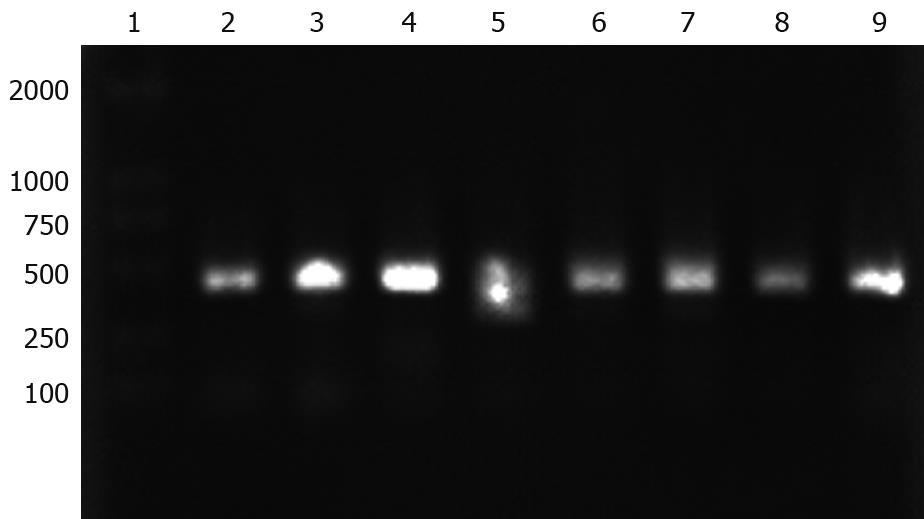
Figure 7 Agarose gel electrophoresis analysis of PCR product of napA gene from H pylori clinic strains.
Lane 1: DL2000 DNA marker; Lanes 2-9: napA gene (435 bp) from eight H pylori clinic strains.
-
Citation: Long M, Luo J, Li Y, Zeng FY, Li M. Detection and evaluation of antibodies against neutrophil-activating protein of
Helicobacter pylori in patients with gastric cancer. World J Gastroenterol 2009; 15(19): 2381-2388 - URL: https://www.wjgnet.com/1007-9327/full/v15/i19/2381.htm
- DOI: https://dx.doi.org/10.3748/wjg.15.2381


