Copyright
©2009 The WJG Press and Baishideng.
World J Gastroenterol. May 7, 2009; 15(17): 2097-2108
Published online May 7, 2009. doi: 10.3748/wjg.15.2097
Published online May 7, 2009. doi: 10.3748/wjg.15.2097
Figure 1 CSE gene expression is regulated by bile acids.
A, B: Qualitative and quantitative PCR showing the up-regulation of CSE mRNA in HepG2 cell line stimulated with FXR ligand 6E-CDCA (10 &mgr;mol/L) for 18 h. Data are shown as mean ± SD of three experiments. aP < 0.05 versus not stimulated cells; C: Western blotting analysis showing the up-regulation of CSE protein in HepG2 cell line stimulated by 6E-CDCA 10 &mgr;mol/L for 18 h; D, E: Immunohistochemistry analysis of CSE expression in HepG2 cells non-treated (D) and treated (E) with 6E-CDCA (10 &mgr;mol/L) for 18 h (Magnification × 40); F: Negative control was obtained by cell staining only with the secondary antibody.
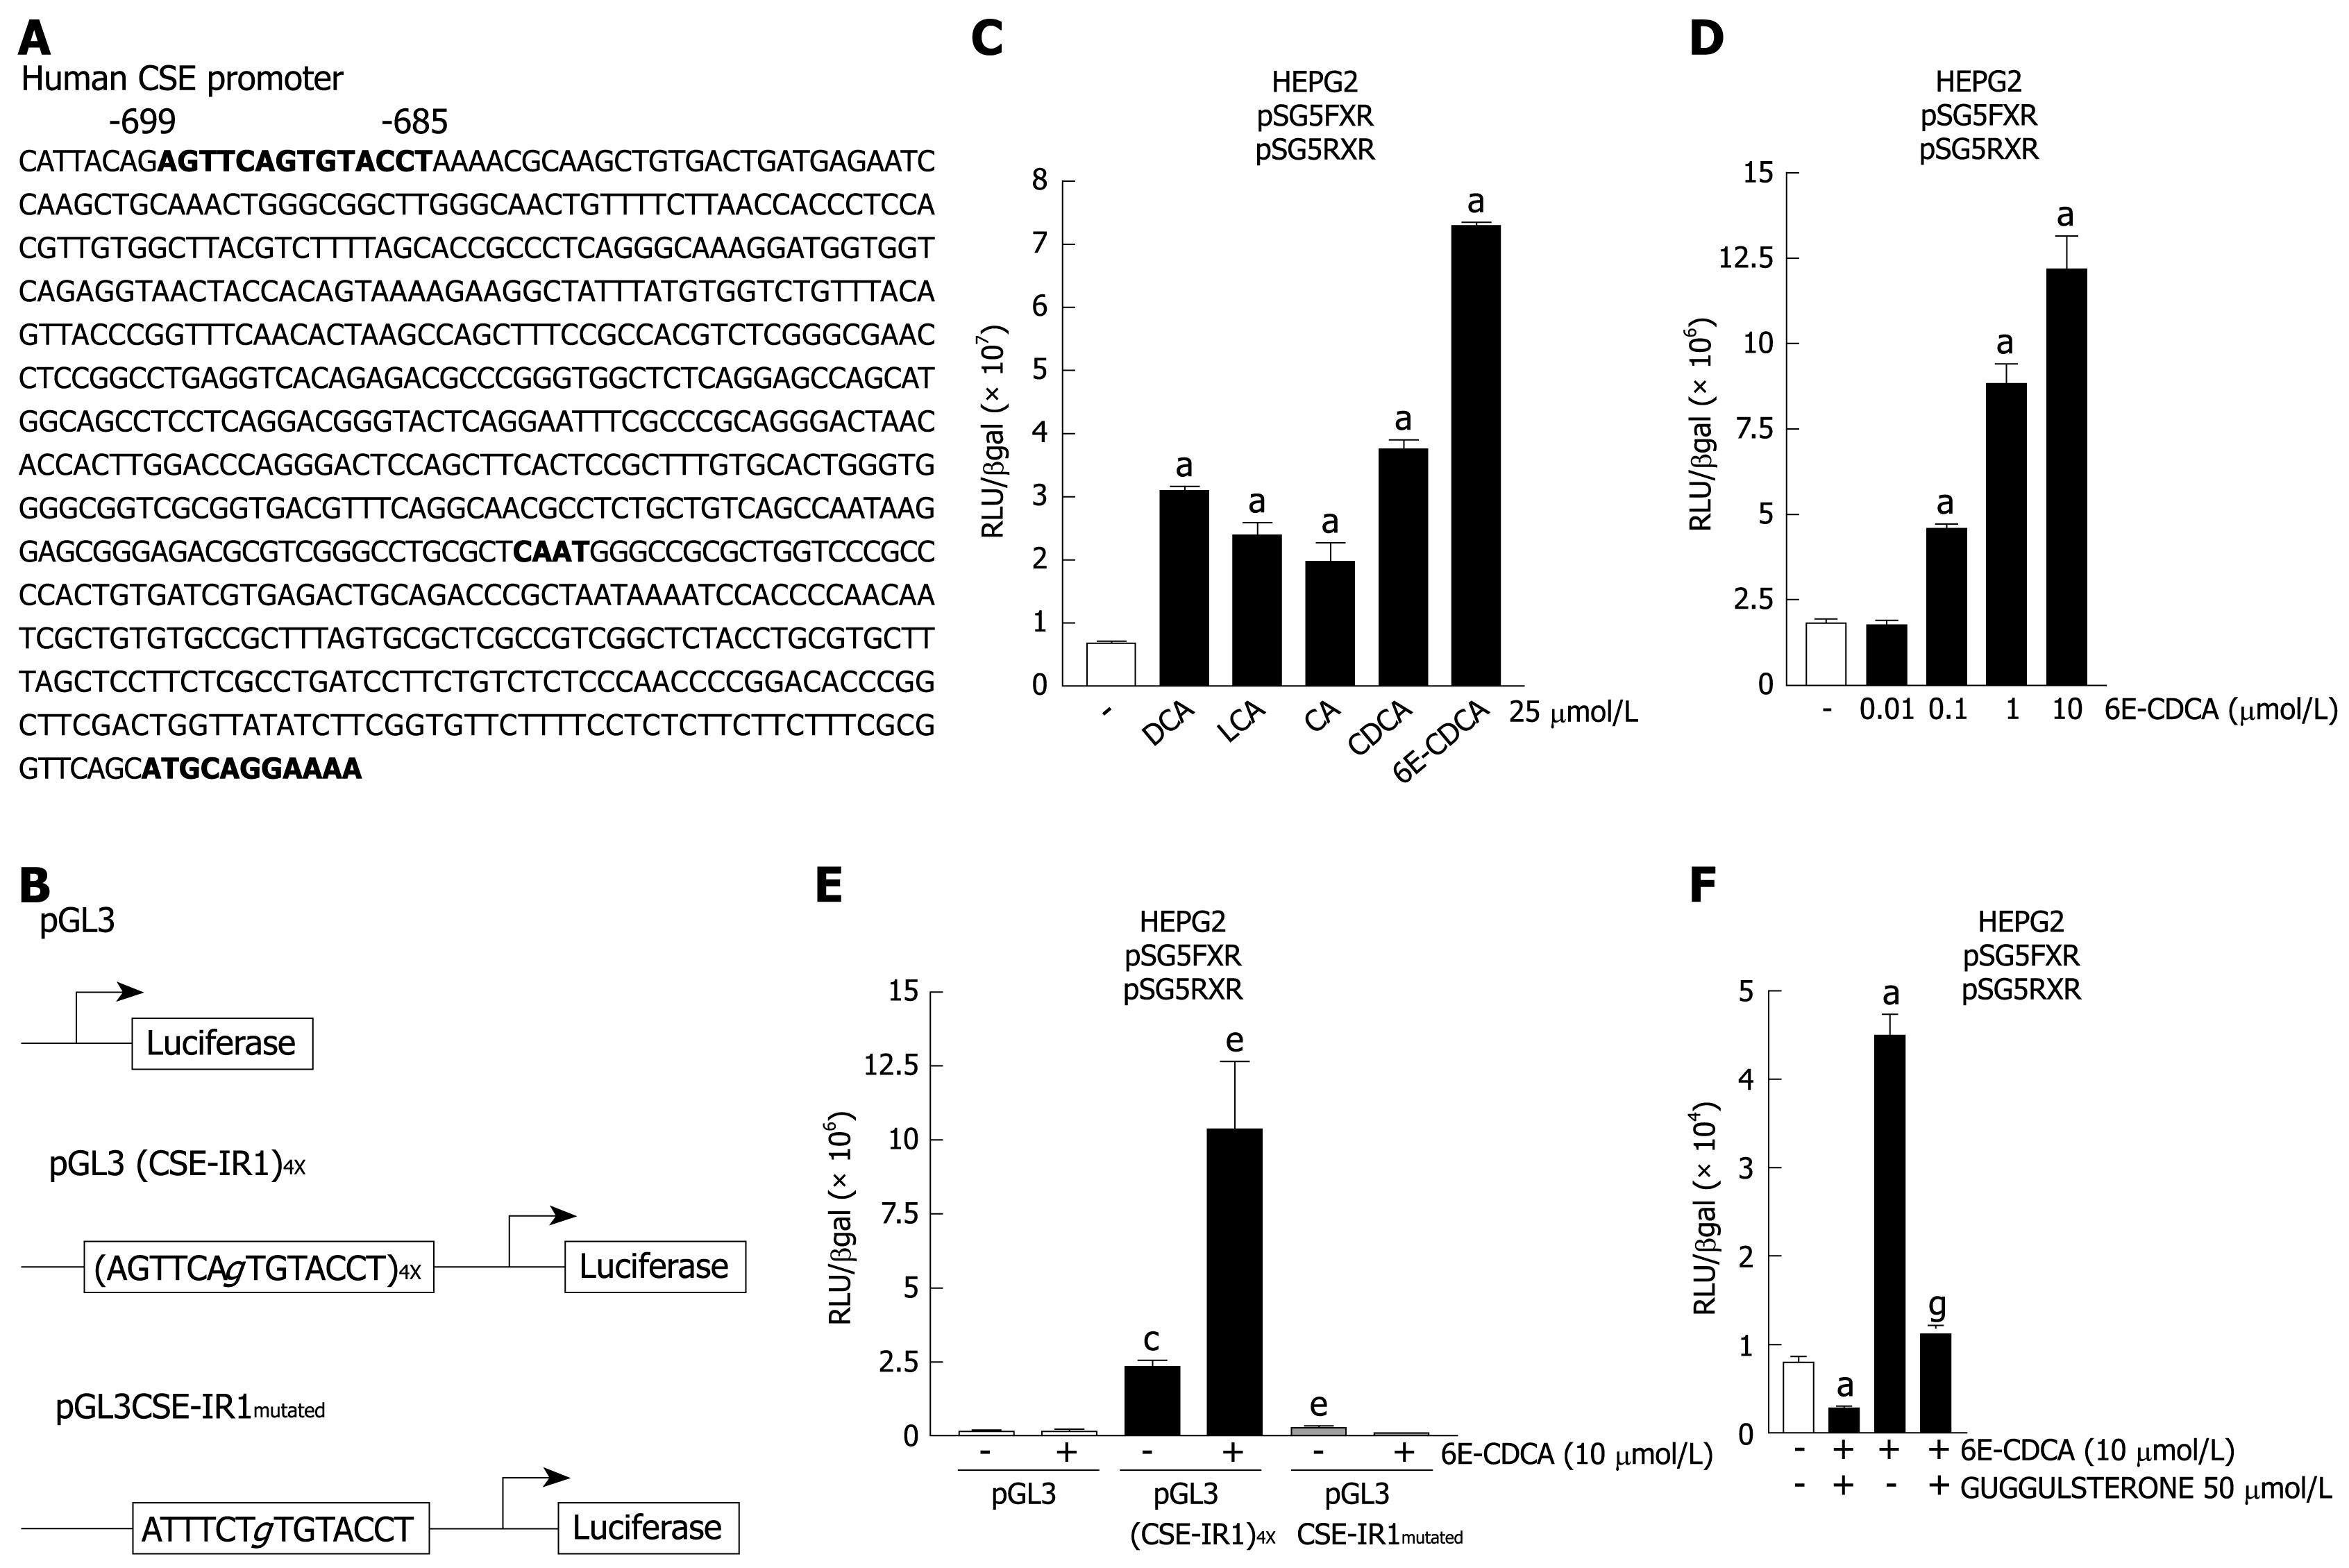
Figure 2 An FXR responsive element is expressed in the CSE promoter.
A: Analysis of the promoter of the human CSE gene, showing a putative IR-1 site at -699/-685 base pairs upstream of the transcriptional start site ATG; B: Schematic representation of reporter constructs containing four CSE-IR1 elements [pGL3 (CSE-IR1)4X] or the mutated CSE-IR1 (pGL3CSE-IR1mutated); C: HepG2 cells were transfected with pSG5-FXR and pSG5-RXR expression vectors and with the construct containing four copies of the CSE-IR1 [pGL3 (CSE-IR1)4X]. Forty-eight hours after transfection, cells were stimulated with 25 &mgr;mol/L of DCA, LCA, CA, CDCA and 6E-CDCA for 18 h. Luciferase activity is shown as the ratio of luciferase to β-galactosidase activities. aP < 0.05 versus not treated cells; D: Dose-dependent induction of Luciferase activity by 6E-CDCA. aP < 0.05 versus not treated cells; E: Mutagenesis of CSE-IR1 results in a loss of activation by FXR ligands. HepG2 cells were transfected with pSG5-FXR and pSG5-RXR expression vectors and with pGL3 or pGL3 (CSE-IR1)4X or pGL3CSE-IR1mutated. Forty-eight hours after transfection, cells were stimulated with 10 &mgr;mol/L of 6E-CDCA for 18 h. Luciferase activity is show as the ratio of luciferase to β-galactosidase activities. cP < 0.05 versus not stimulated pGL3 transfected cells. eP < 0.05 versus not stimulated pGL3 (CSE-IR1)4X transfected cells; F: Guggulsterone abolished the transactivation of the CSE-IR1 element. HepG2 cells co-transfected with pSG5-FXR and pSG5-RXR expression vectors and with pGL3 (CSE-IR1)4X were stimulated with 50 &mgr;mol/L of guggulsterone alone or in combination with 10 &mgr;mol/L of 6E-CDCA. aP < 0.05 versus not treated cells. gP < 0.05 versus 6E-CDCA stimulated cells. Data represent the mean ± SD of three experiments.
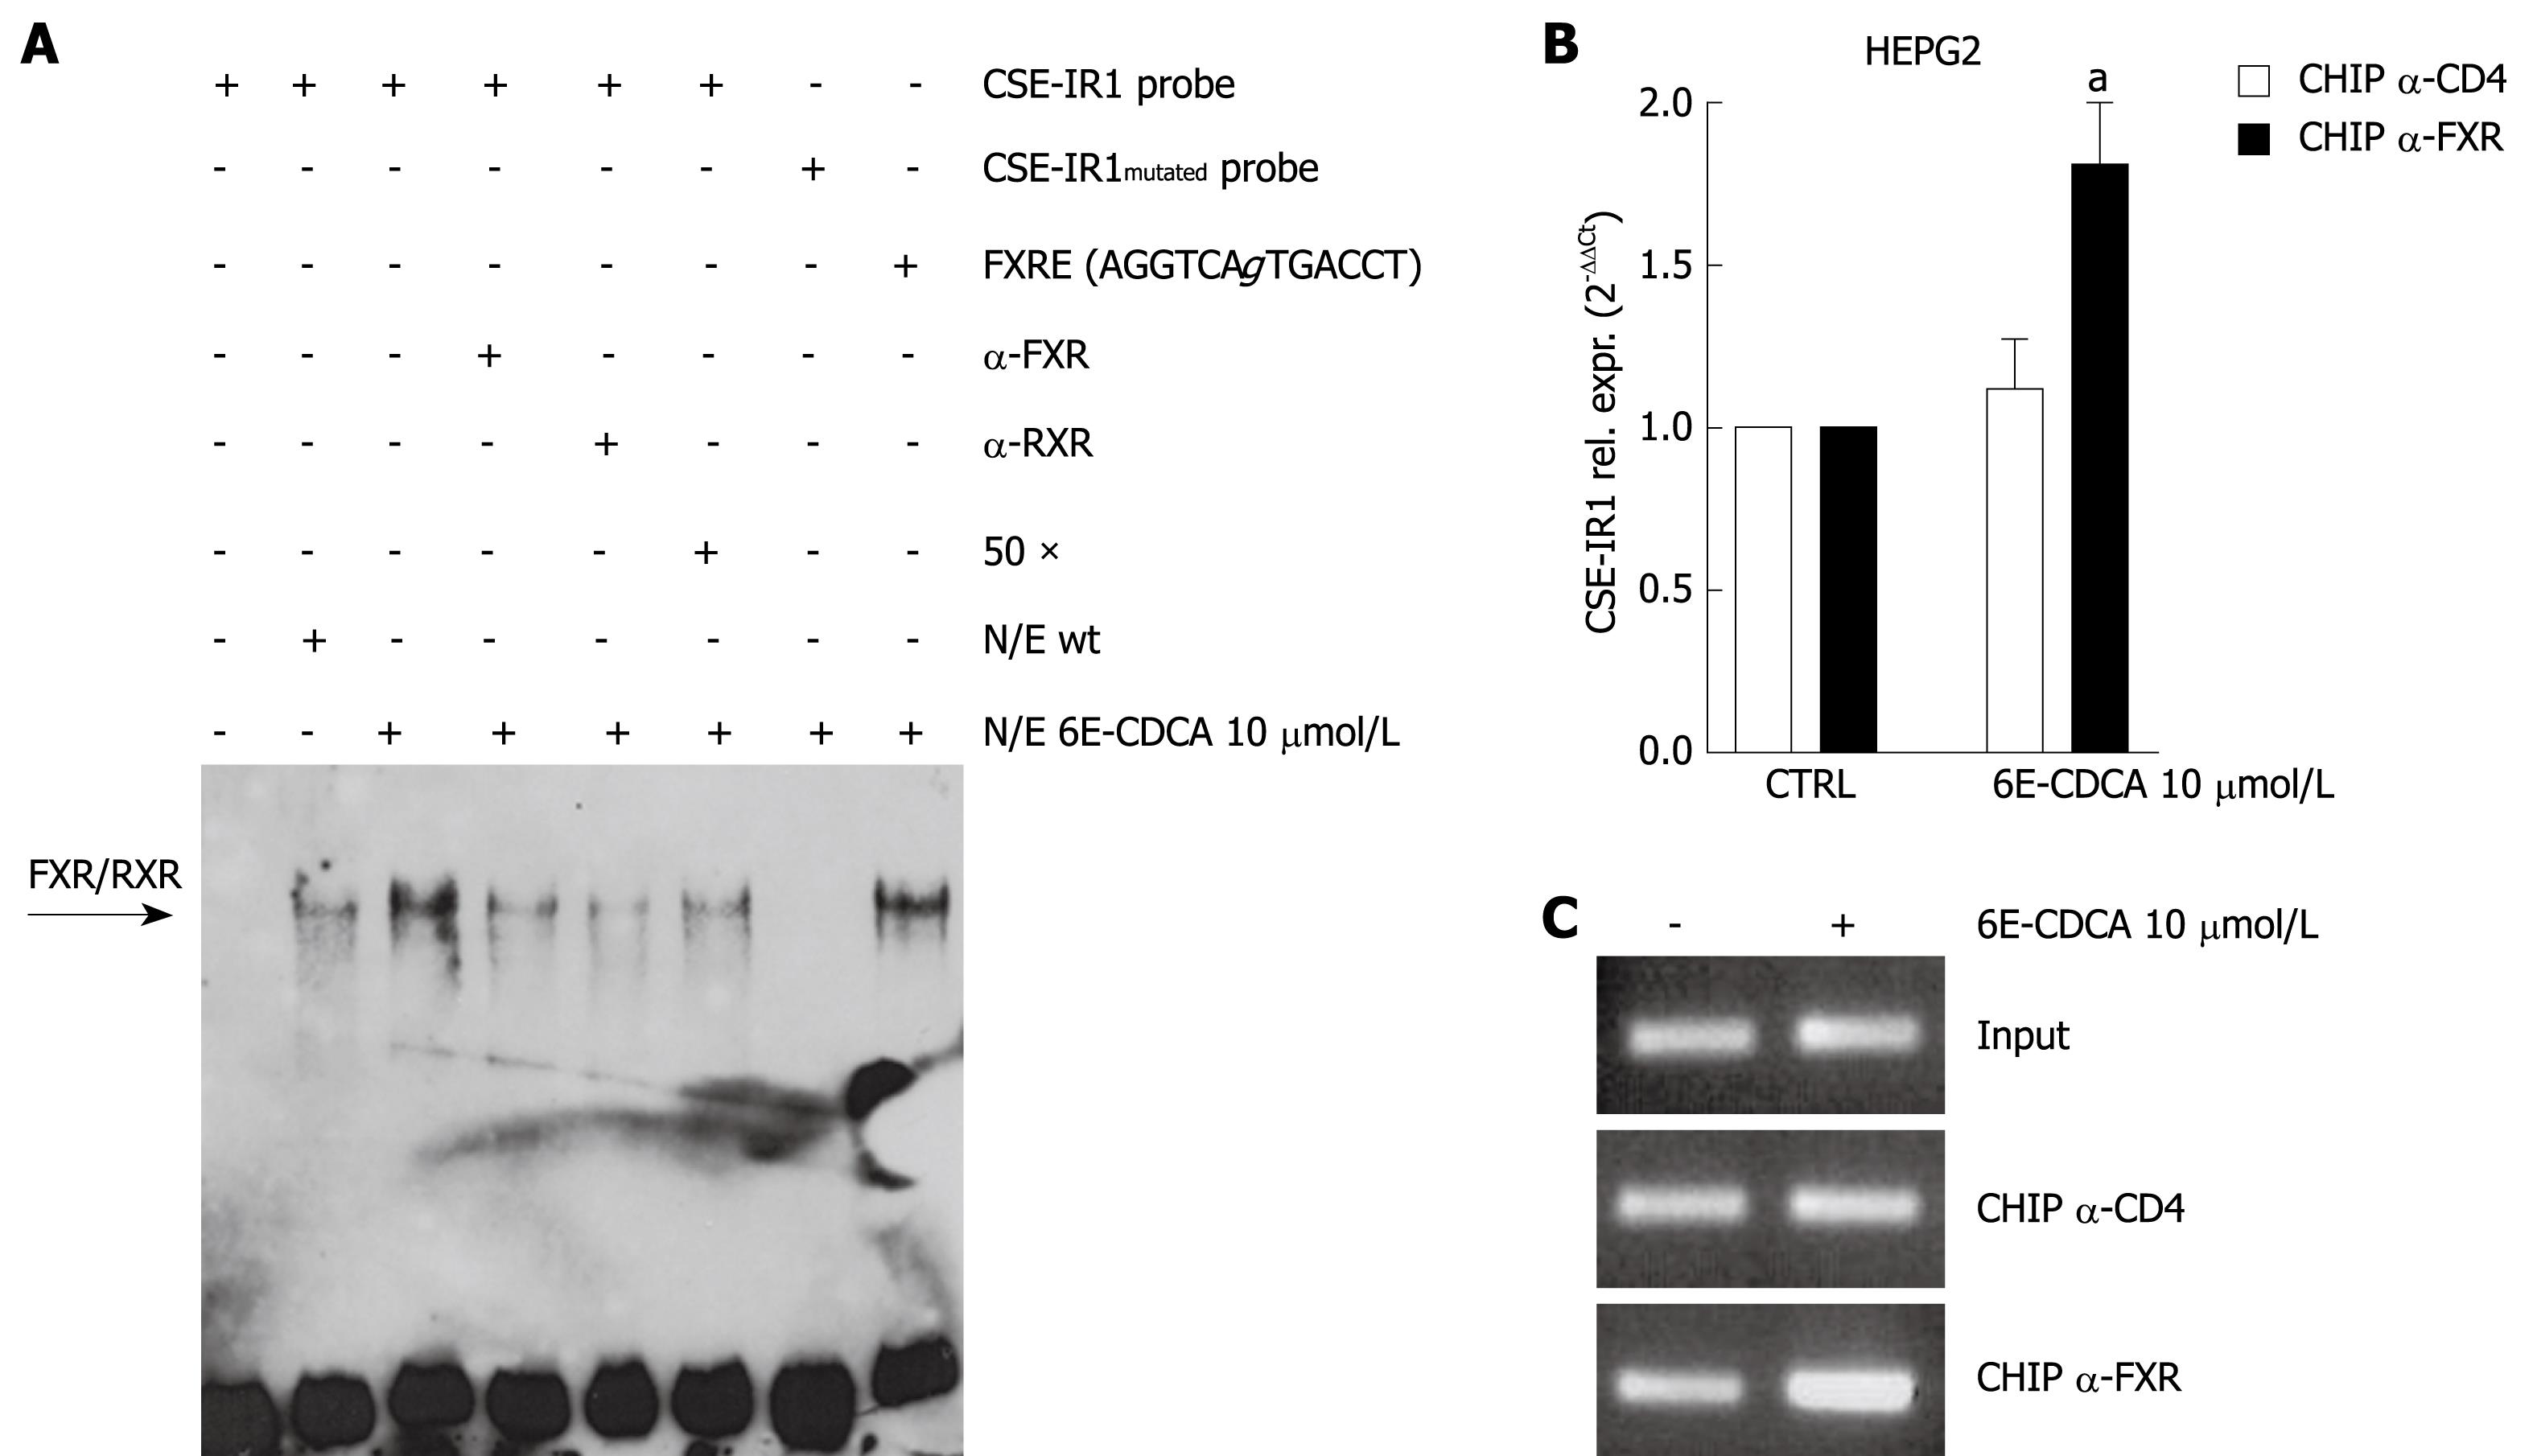
Figure 3 Activation of FXR regulates CSE expression.
A: FXR/RXR bind to CSE-IR1 of the CSE gene. EMSAs were performed to analyze binding of FXR/RXR to the putative IR1 sequence in the CSE gene. CSE-IR1, CSE-IR1mutated and FXRE-IR1 probes, biotin-labeled, were used in this experiment. CSERE-IR1 probe was incubated with nuclear extracts from HepG2 cells not treated or treated with 6E-CDCA 10 &mgr;mol/L for 18 h. Competition experiments were performed using a 50-fold excess of unlabeled oligo or 1 &mgr;g of FXR antibody or 1 &mgr;g of RXR antibody. CSE-IR1mutated and FXRE-IR1 probes were incubated with nuclear extracts from HepG2 stimulated cells; B: CSE-IR1 site binds FXR in the context of intact chromatin structures. ChIP experiments were performed with HepG2 cells. Chromatin was prepared and immunoprecipitated with antibodies directed against FXR and CD4. CD4 antibody was used as a negative control. Real-time PCR of the immunoprecipitated DNA by using the primer pairs indicated in Table 1. Data represent the mean ± SD of three experiments. aP < 0.05 versus not treated cells; C: Qualitative PCR of the immunoprecipitated DNA by using the primer pairs indicated in Table 1.
Figure 4 CSE expression/activity is regulated with an FXR ligand in vivo.
A: FXR +/+ and FXR -/- mice were treated for 3 d with vehicle or with 6E-CDCA 5 mg/kg body weight. Total RNA from liver of FXR +/+ and FXR -/- mice was subjected to real-time PCR quantification of CSE gene expression. aP < 0.05 versus FXR +/+ control mice; B: FXR +/+ and FXR -/- mice were treated for three days with vehicle or with 6E-CDCA 5 mg/kg body weight. Livers from FXR +/+ and FXR -/- mice were homogenized in cold PBS to evaluate CSE activity. aP < 0.05 versus FXR +/+ control mice. cP < 0.05 versus FXR -/- control mice; C: FXR +/+ and FXR -/- mice were treated for 3 d with vehicle or with 6E-CDCA 5 mg/kg body weight. Livers from FXR +/+ and FXR -/- mice were homogenized in cold PBS to evaluate H2S production. aP < 0.05 versus FXR +/+ control mice. Data represent the mean ± SD of six experiments.
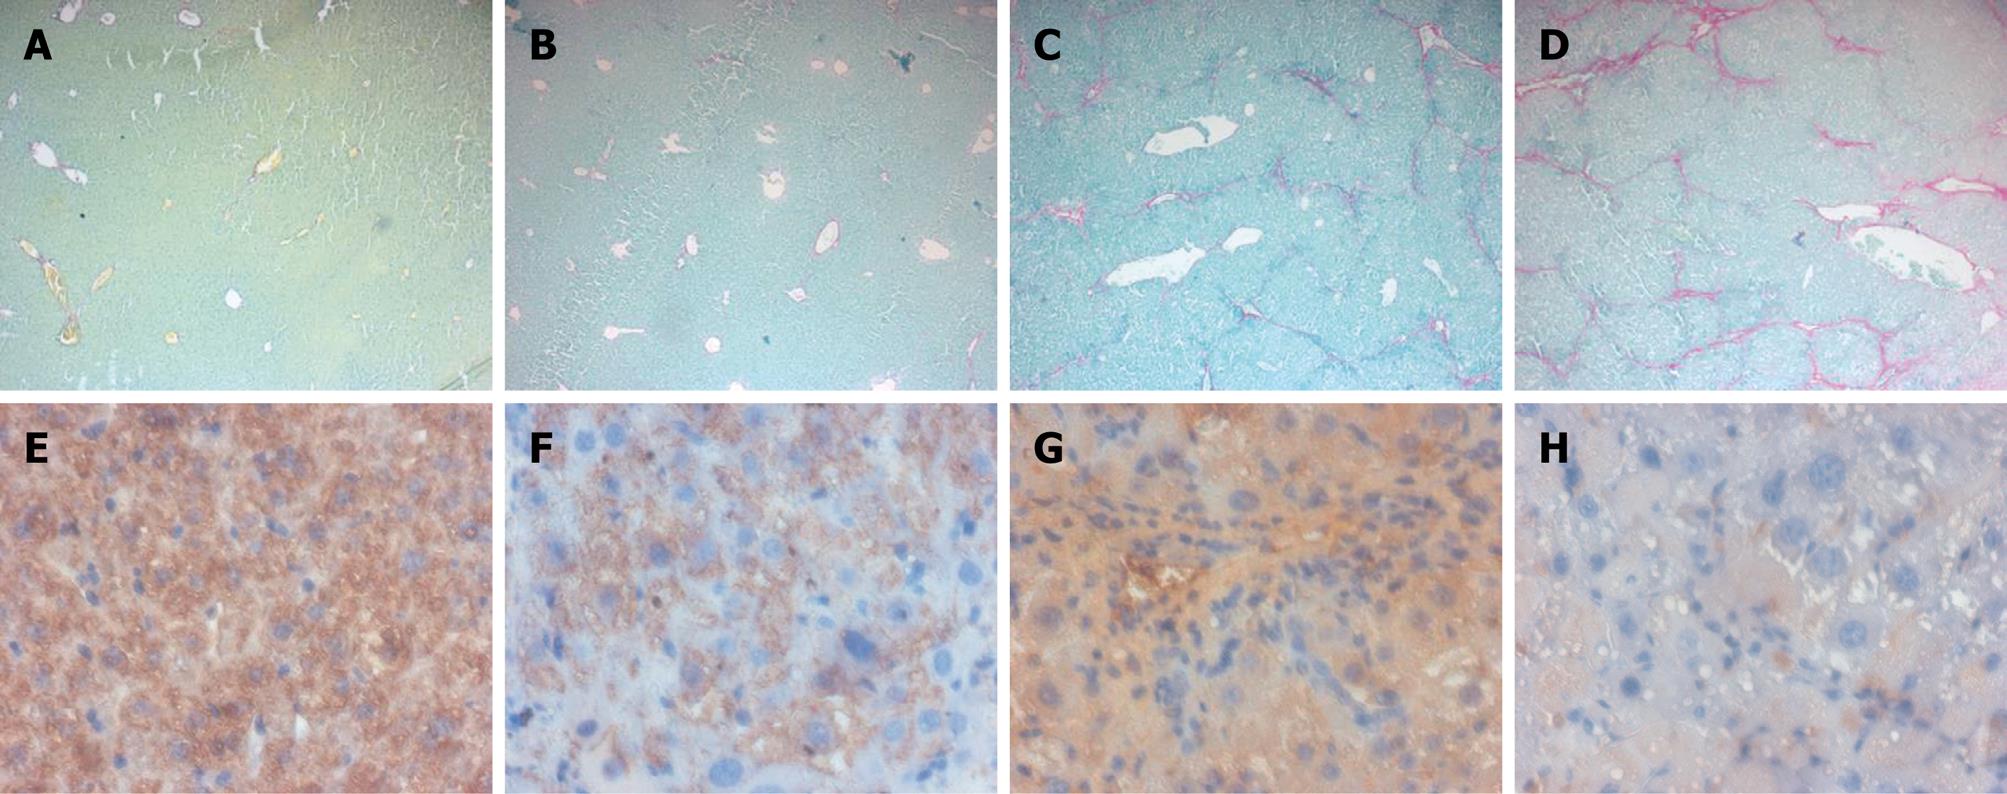
Figure 5 FXR loss of function sensitizes mice to CCl4-induced liver fibrosis.
A: Sirius red staining of liver section obtained from FXR +/+ mice; B: Sirius red staining of liver section obtained from FXR -/- mice; C: Sirius red staining of liver section obtained from FXR +/+ mice treated with CCl4; D: Sirius red staining of liver section obtained from FXR -/- mice treated with CCl4; E: Liver section stained with CSE monoclonal antibody obtained from FXR +/+ mice; F: Liver section stained with CSE monoclonal antibody obtained from FXR -/- mice; G: Liver section stained with CSE monoclonal antibody obtained from FXR +/+ mice treated with CCl4; H: Liver section stained with CSE monoclonal antibody obtained from FXR -/- mice treated with CCl4.
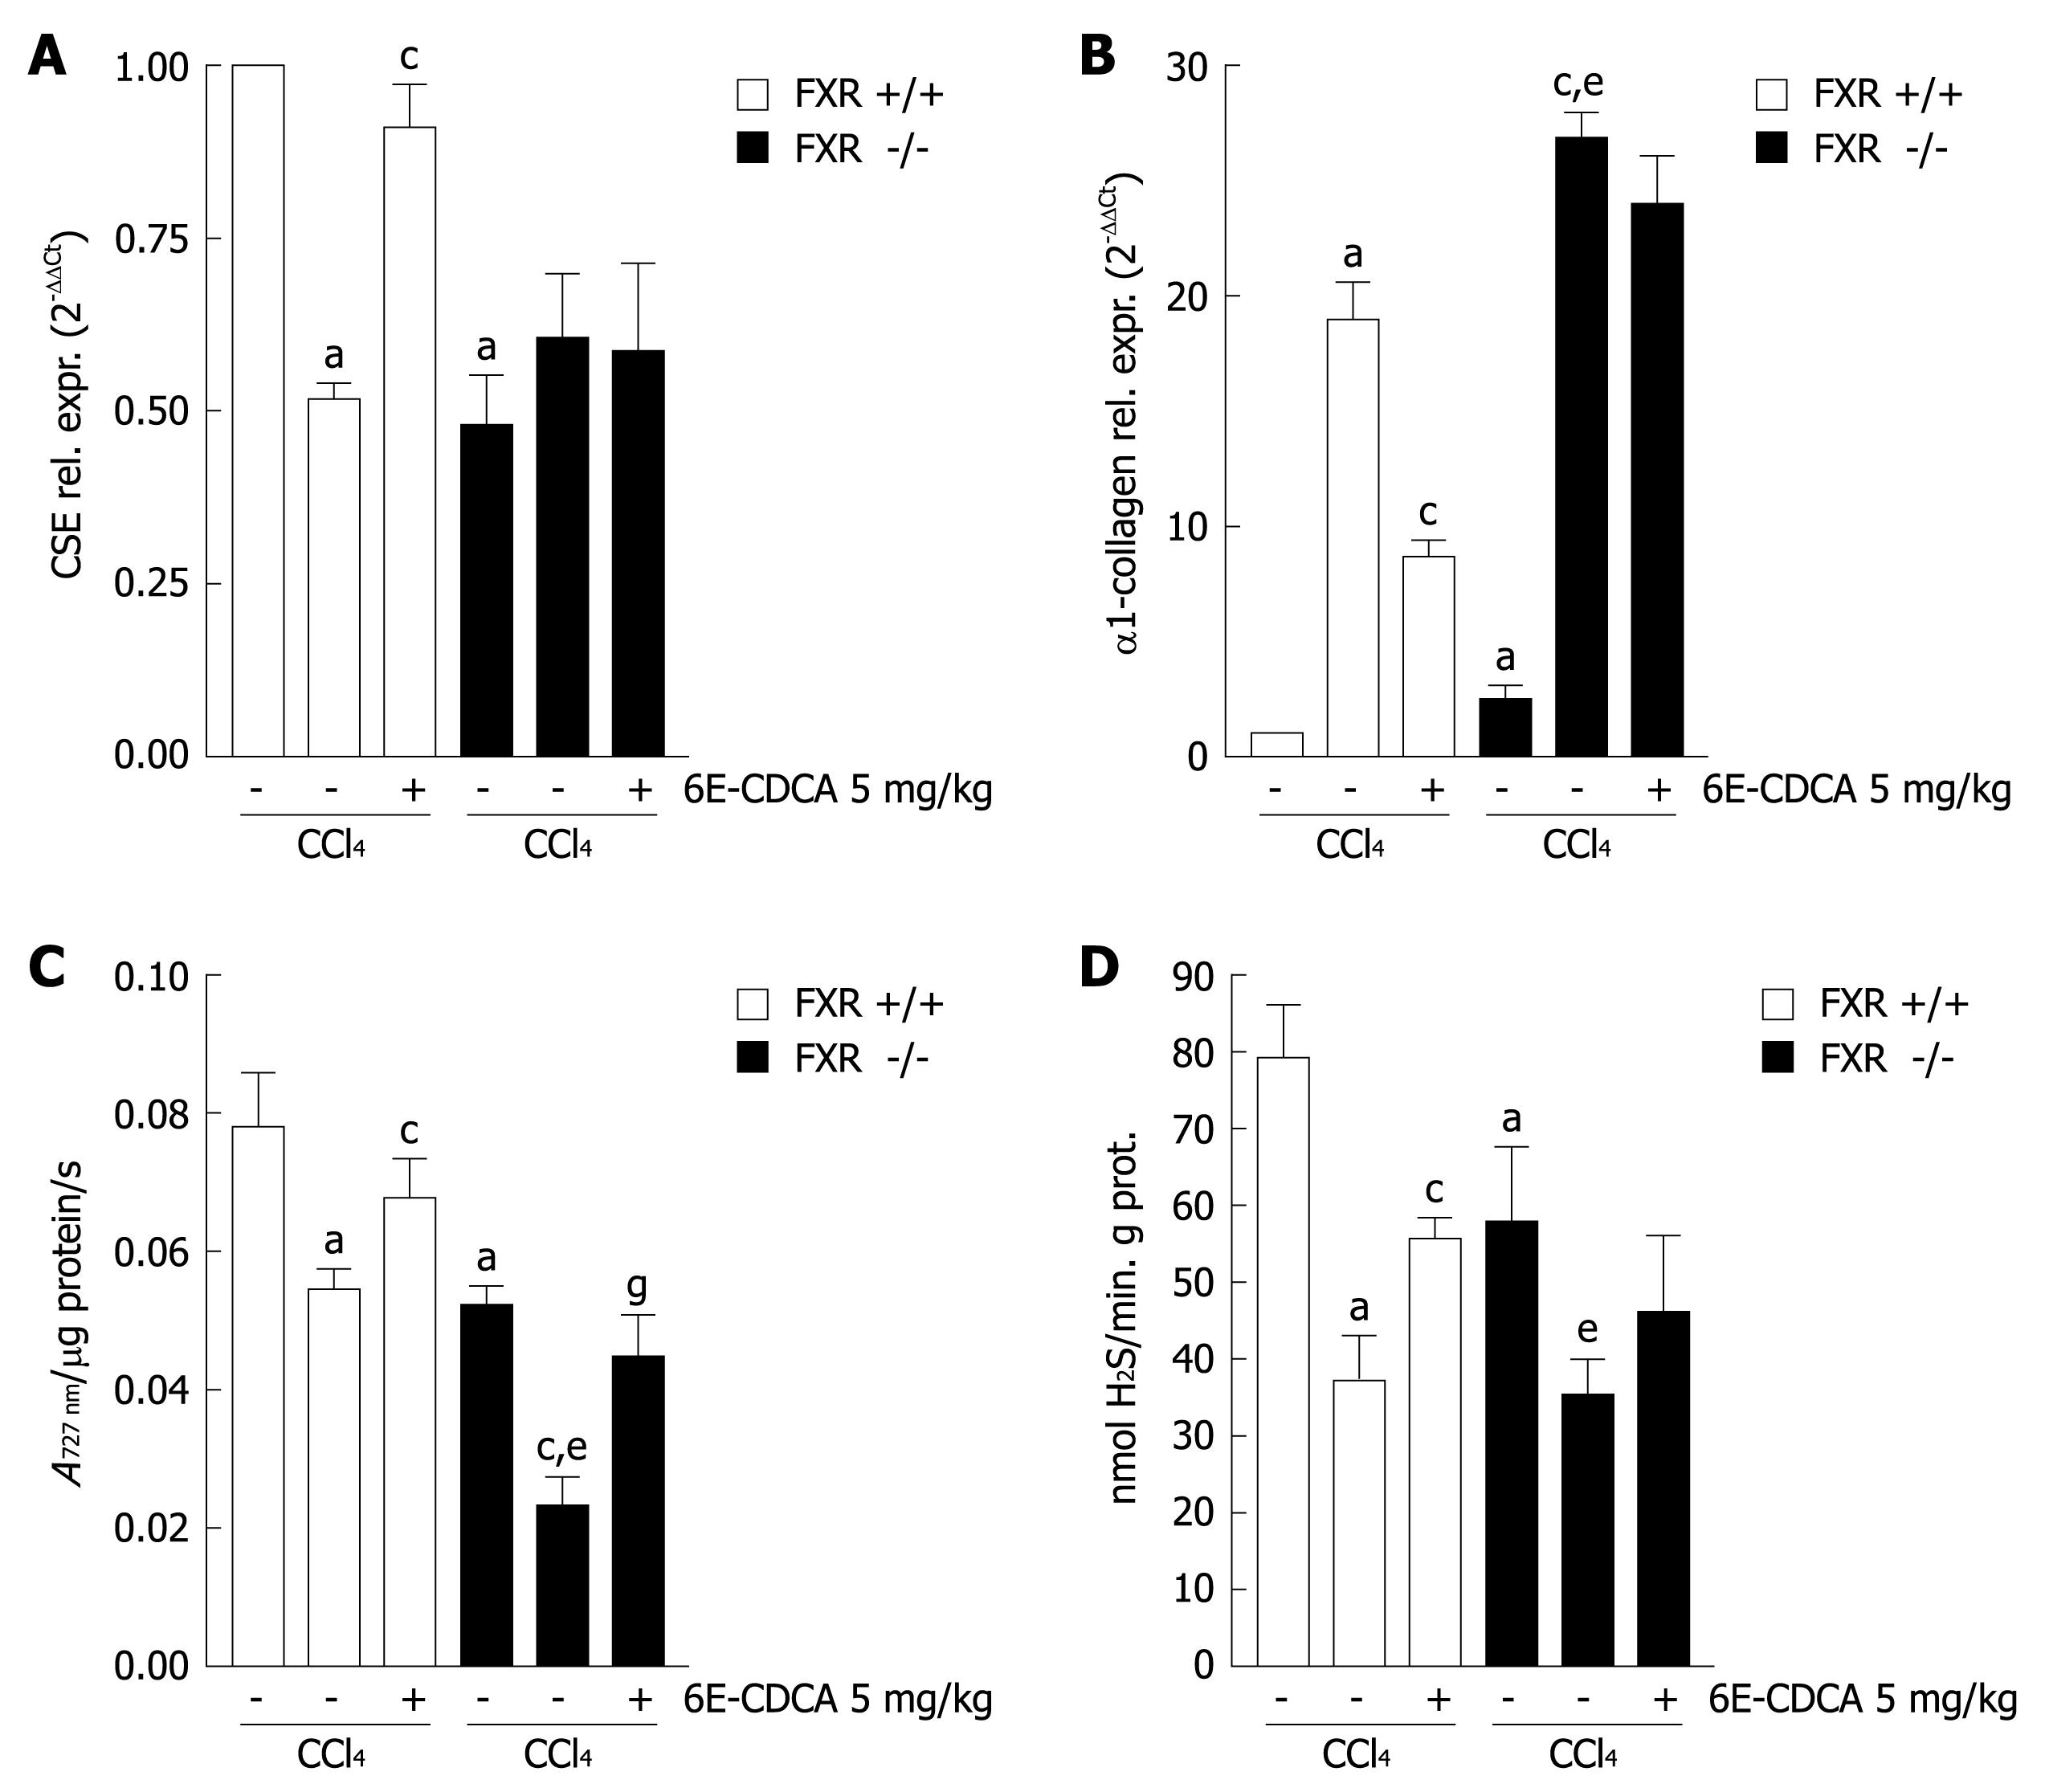
Figure 6 FXR activation induces CSE gene expression and regulated CSE activity in the liver with cirrhosis.
FXR +/+ and FXR -/- mice were treated with CCl4 and 6E-CDCA as described in the methods section. A and B: Quantitative real-time PCR of CSE mRNA and α1-collagen mRNA from FXR +/+ and FXR -/- liver homogenates; C: Liver CSE activity; D: Liver H2S production. Data are mean ± SD of six mice. aP < 0.05 versus FXR+/+ control mice. cP < 0.05 versus CCl4 FXR +/+ mice. eP < 0.05 versus FXR -/- control mice. gP < 0.05 versus CCl4 FXR -/- mice.
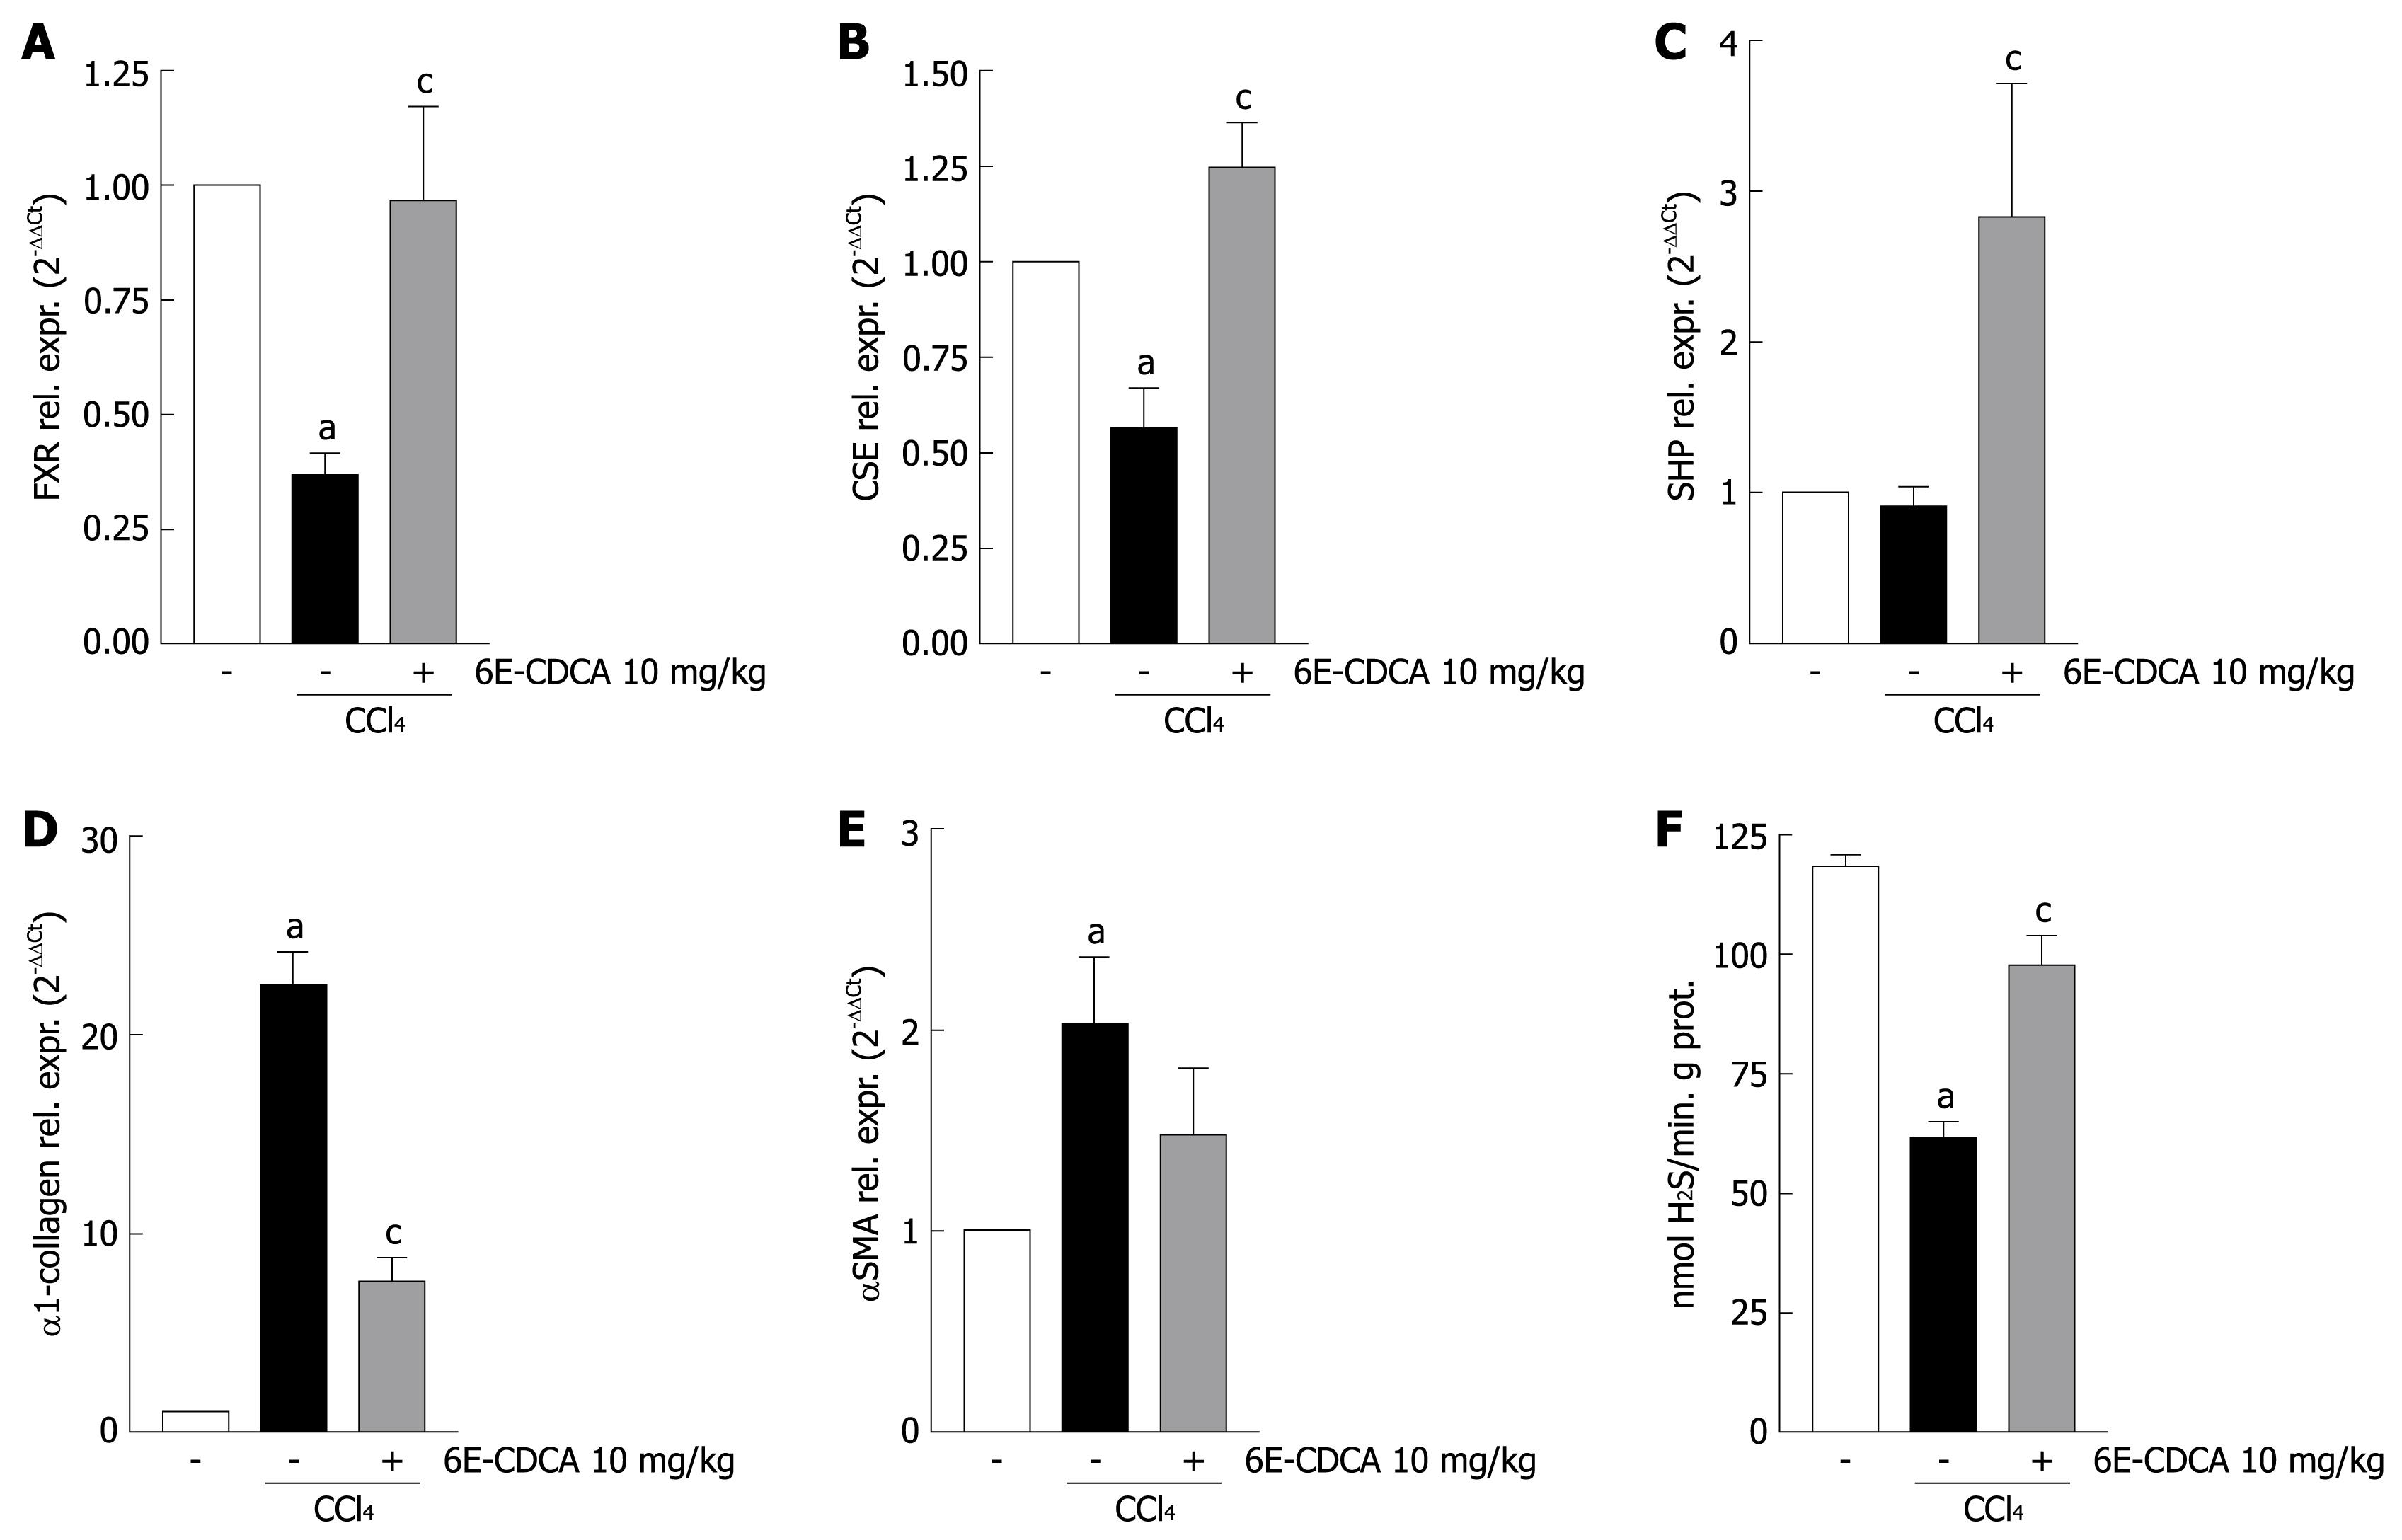
Figure 7 FXR activation induces both CSE mRNA expression and activity in rats with liver cirrhosis.
Quantitative real-time PCR of (A) FXR mRNA, (B) CSE mRNA, (C) SHP mRNA, (D) α1-collagen mRNA, (E) αSMA mRNA from rats liver homogenates and (F) Rat liver CSE activity. Data are mean ± SD of six mice. aP < 0.05 versus control rats. cP < 0.05 versus CCl4 rats.
Figure 8 FXR activation induces CSE protein expression and reduces αSMA protein level in rat’s liver with cirrhosis.
Western blotting analysis of CSE, αSMA and tubulin on liver homogenates. From left to right: Lanes 1-3, liver samples from control rats; Lanes 4-6, liver samples from rats administered CCl4; Lanes 7-9, liver samples from rats administered CCl4 and 10 mg/kg 6E-CDCA.
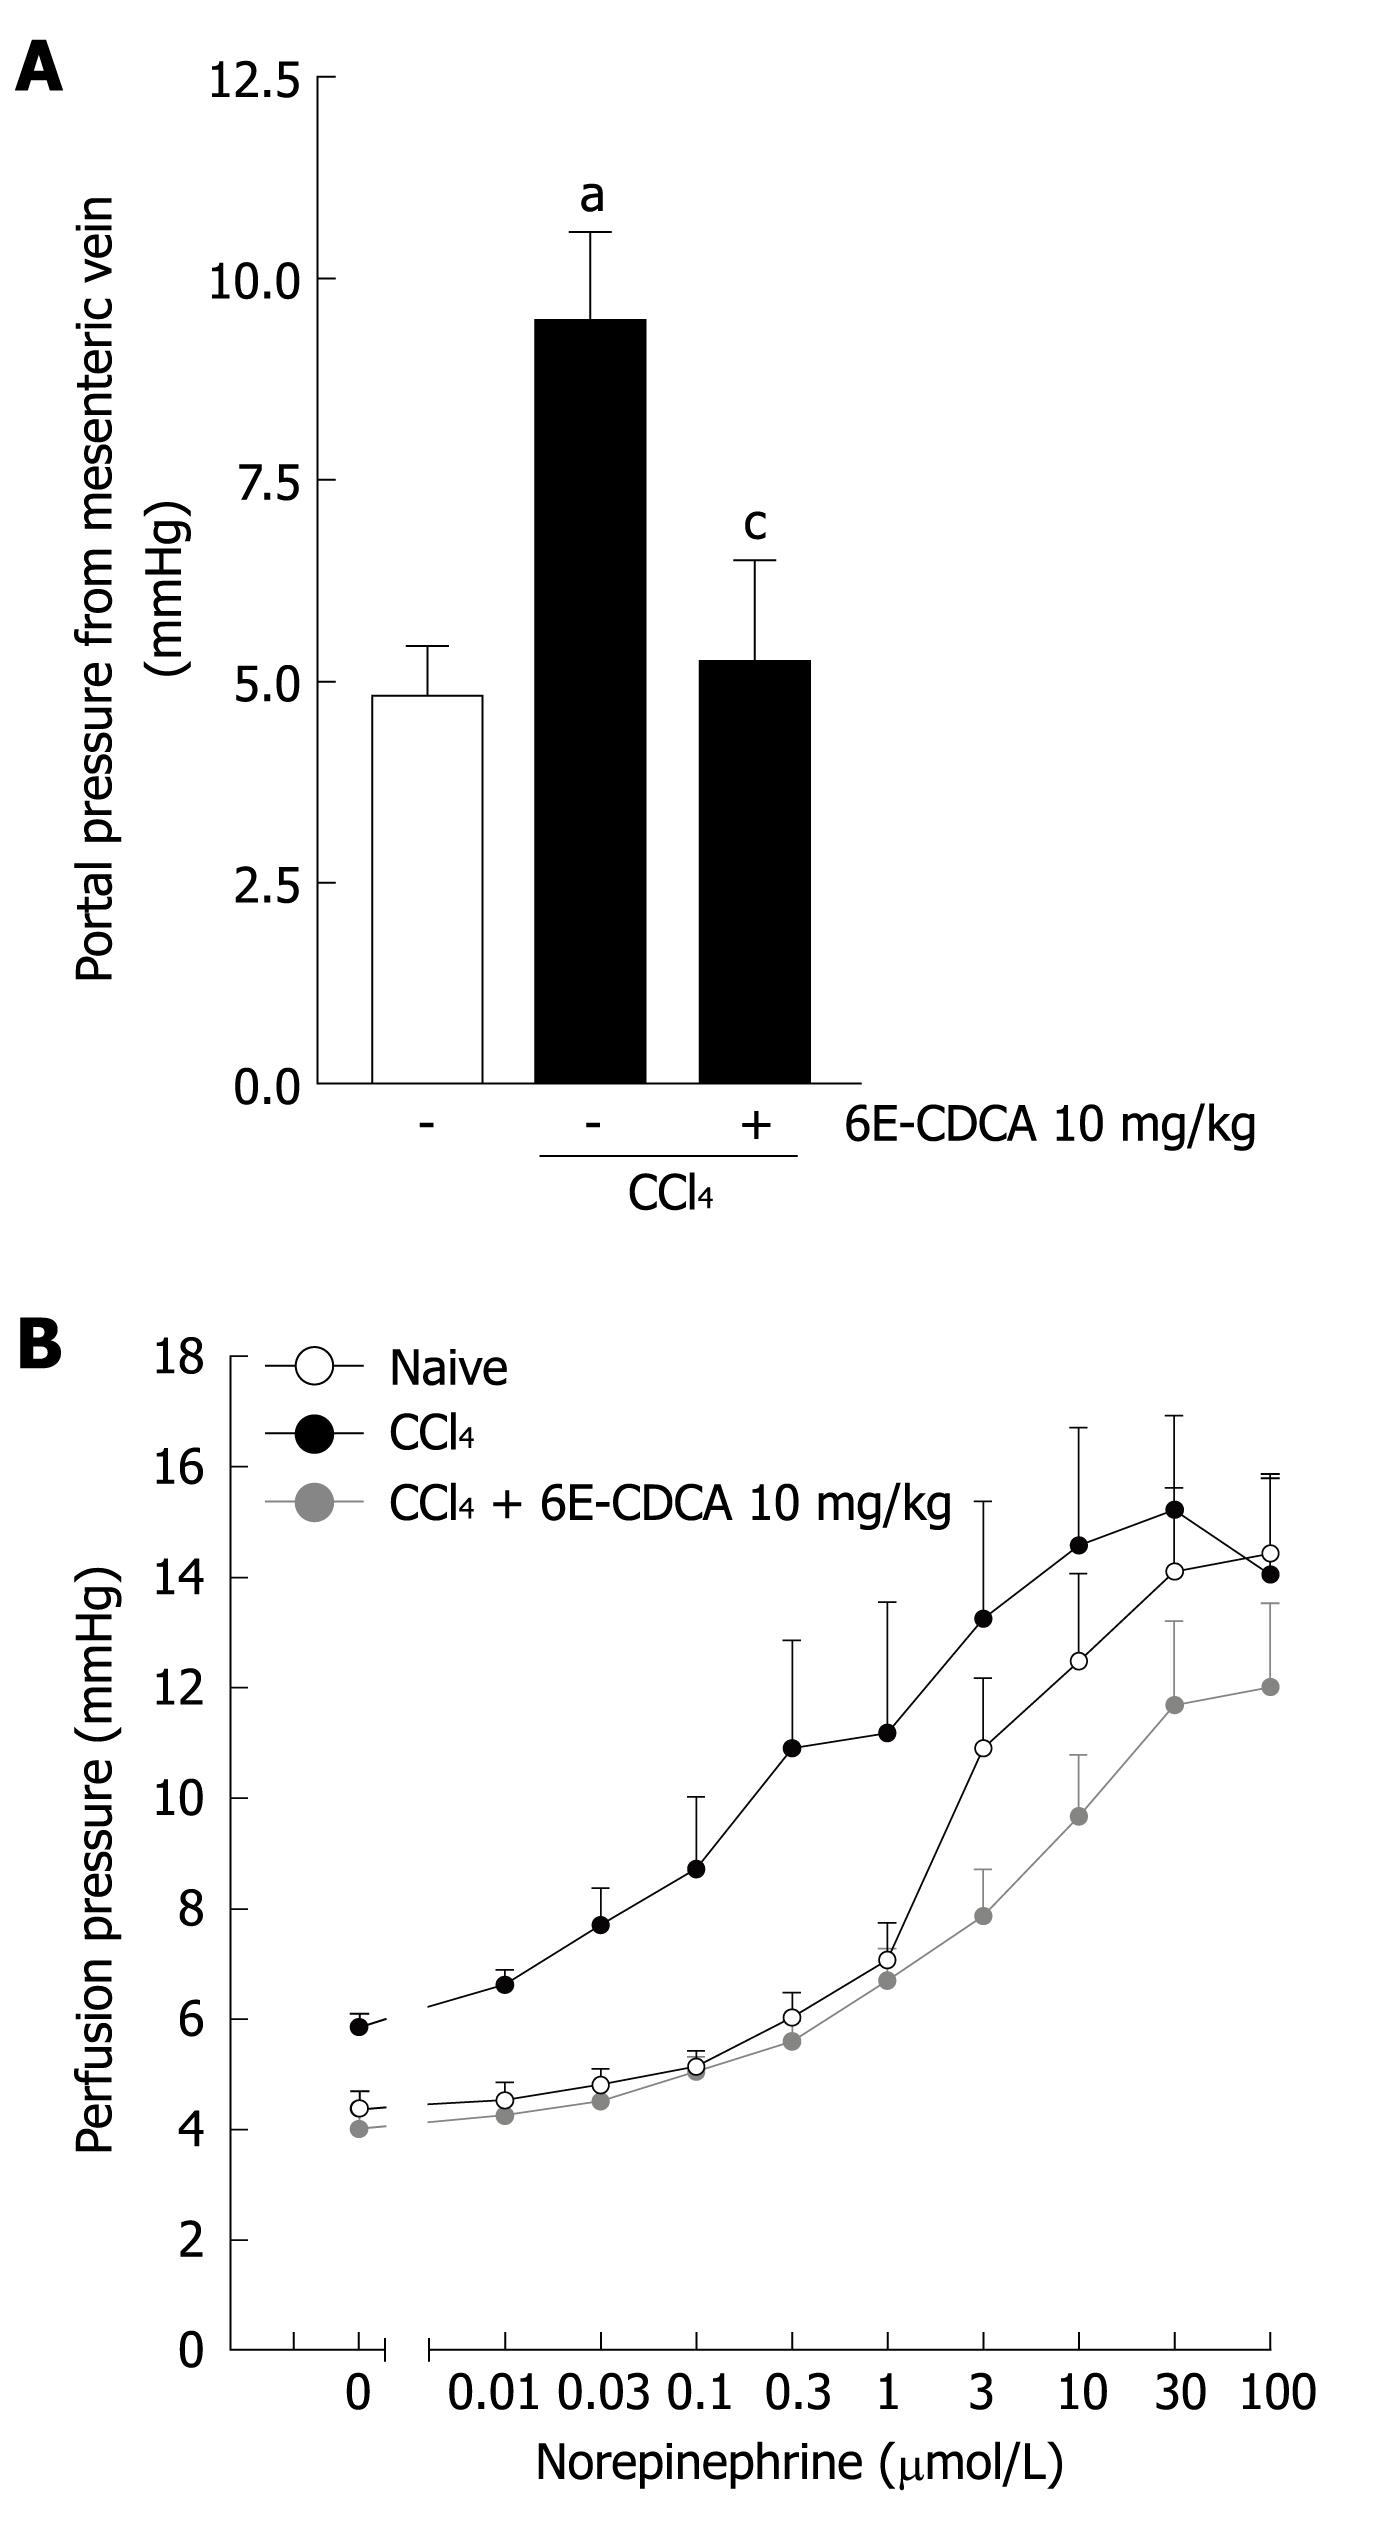
Figure 9 FXR activation reduces portal pressure in rat liver with cirrhosis.
Data are mean ± SD of six mice. A: Basal portal pressure from mesenteric vein. aP < 0.05 versus control rats. cP < 0.05 versus CCl4 rats; B: Effects of 6E-CDCA on pre-contracted rat liver with cirrhosis. aP < 0.05 versus control rats. cP < 0.05 versus CCl4 rats.
- Citation: Renga B, Mencarelli A, Migliorati M, Distrutti E, Fiorucci S. Bile-acid-activated farnesoid X receptor regulates hydrogen sulfide production and hepatic microcirculation. World J Gastroenterol 2009; 15(17): 2097-2108
- URL: https://www.wjgnet.com/1007-9327/full/v15/i17/2097.htm
- DOI: https://dx.doi.org/10.3748/wjg.15.2097


