Copyright
©2009 The WJG Press and Baishideng.
World J Gastroenterol. Apr 7, 2009; 15(13): 1548-1553
Published online Apr 7, 2009. doi: 10.3748/wjg.15.1548
Published online Apr 7, 2009. doi: 10.3748/wjg.15.1548
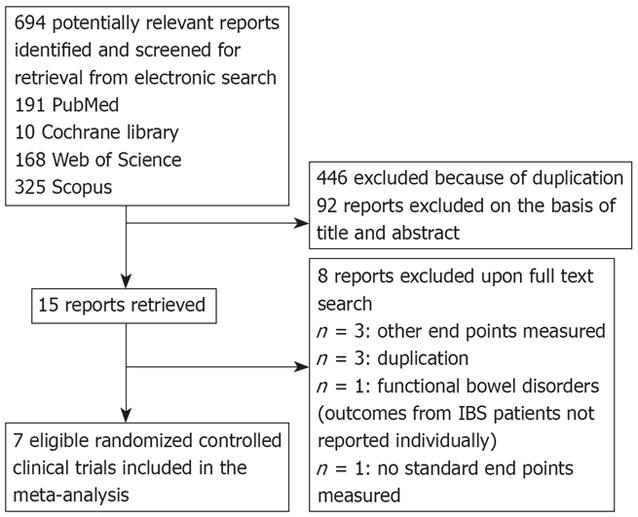
Figure 1 Flow diagram of the study selection process.
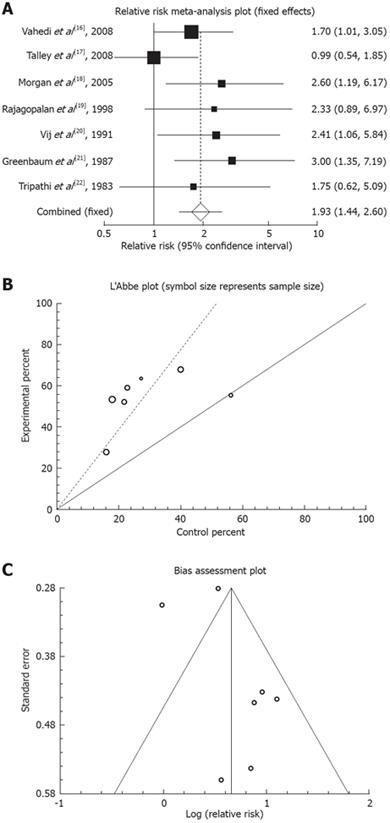
Figure 2 Outcome of “clinical response” in the studies considering TCAs vs placebo therapy.
A: Individual and pooled relative risk; B: Heterogeneity indicators; C: Publication bias funnel plot.
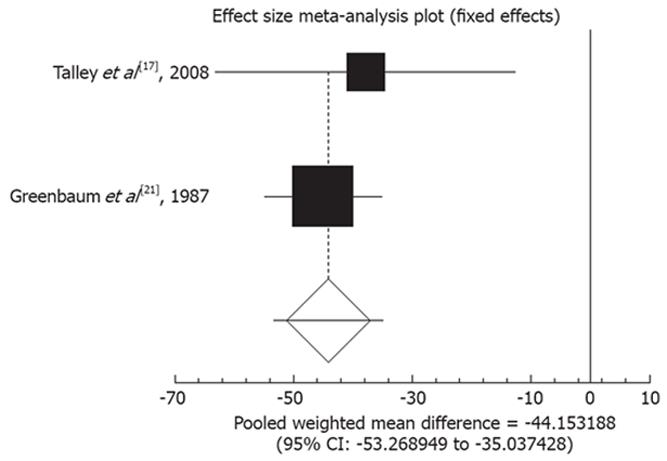
Figure 3 Pooled weighted mean difference for the outcome of “mean change in abdominal pain score” in the studies considering TCAs vs placebo.
- Citation: Rahimi R, Nikfar S, Rezaie A, Abdollahi M. Efficacy of tricyclic antidepressants in irritable bowel syndrome: A meta-analysis. World J Gastroenterol 2009; 15(13): 1548-1553
- URL: https://www.wjgnet.com/1007-9327/full/v15/i13/1548.htm
- DOI: https://dx.doi.org/10.3748/wjg.15.1548


