Copyright
©2009 The WJG Press and Baishideng.
World J Gastroenterol. Mar 21, 2009; 15(11): 1319-1330
Published online Mar 21, 2009. doi: 10.3748/wjg.15.1319
Published online Mar 21, 2009. doi: 10.3748/wjg.15.1319
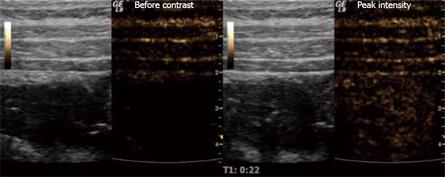
Figure 1 Stenosis of the terminal ileum in a patient with CD examined with ultrasound contrast.
The grey-toned images are the B-mode scouts while the brown-toned images portray the harmonic signals that are almost exclusively from micro-bubbles at a low MI. The right image shows the situation before contrast injection, while the left picture is taken at peak intensity.
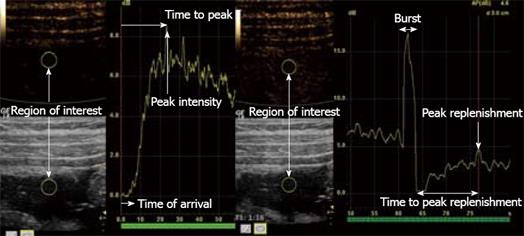
Figure 2 Stenosis of the terminal ileum in a patient with CD.
The right image shows a TIC using bolus tracking. The left image shows burst replenishment without constant infusion in the same patient. When the micro-bubbles are hit by ultrasound with a high MI, this causes them to burst, which produces high-intensity images (Burst). Quantifiable parameters such as time of arrival, peak intensity, time to peak, peak replenishment and time to peak replenishment are shown in the illustration.
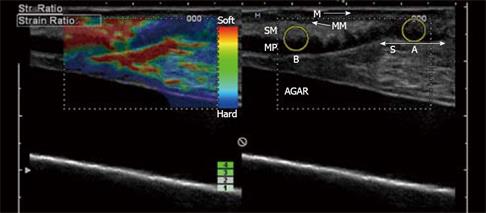
Figure 3 In vitro examination of a stenotic terminal ileum in a patient with CD.
The intestine has been cut open longitudinally and is resting on agar. The image was acquired with a 13-MHz linear probe (Hitachi Medical Systems Europe Holding AG, Zug, Switzerland) applied directly to the mucosa. The left image is an ordinary B-mode image showing the thickened GI wall (> 1 cm in vitro) with the muscularis propria (MP), submucosa (SM), mucosa (M) and a thickened muscularis mucosa (MM). Towards the stenosis (S), the stratification is lost. In the right corresponding elastography image, there is a clear transition between the blue (hard) stenotic area and the red (soft) pre-stenotic area. The strain measured in region A and B (yellow circles) differ with a ratio of 3.77 ( A: 0.27%; B: 1.02%; B/A: 3.77), which indicates a distinct difference in elasticity. Histology confirmed a fibrotic stenosis (Bar indicates 0.5 cm/unit).
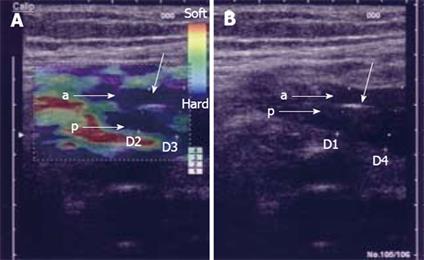
Figure 4 Elastography image acquired transabdominally in a patient with CD and stenosis of the terminal ileum.
In the left image, the bowel wall is thickened without stratification and the anterior (A) and posterior (B) bowel wall is separated by luminal air (unmarked arrow). In the right elastography image, the stenotic area is colored blue relative to the surrounding tissue, which indicates that it is hard. The patient was operated upon and the histology confirmed a fibrotic stenosis. D1: 9.5 mm; D2: 8.8 mm; D3: 10.0 mm; D4: 13.0 mm.
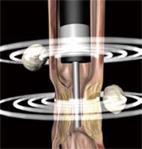
Figure 5 Illustration of EUS performed with an echoendoscope and an ultrasound miniprobe simultaneously.
The echoendoscope can not pass a stenotic area which, however, can be further examined with a miniprobe. Lymph nodes are seen outside the GI wall.
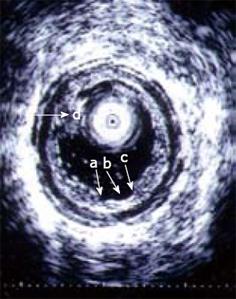
Figure 6 An ultrasound miniprobe (20 MHz) is placed in the ascending part of the partly water-filled jejunal lumen in a patient with CD.
The layers of the wall are seen and also an erosion/superficial ulcer (b) can be observed. The edge of the lesion is indicated (a, c). A mucosal polypoid elevation is also seen (d).
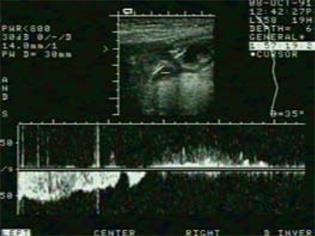
Figure 7 Scan of the transpyloric area with velocity curve of gastric emptying episode (left) and duodenogastric reflux episode (right).
Calibration bars indicate cm/s and 0.2 s on the y-axis and x-axis, respectively.
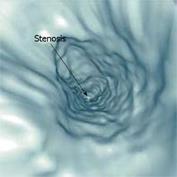
Figure 8 VE of the ileum demonstrating stenosis of the intestinal lumen (arrow) (Rogalla et al[90]).
- Citation: Nylund K, Ødegaard S, Hausken T, Folvik G, Lied GA, Viola I, Hauser H, Gilja OH. Sonography of the small intestine. World J Gastroenterol 2009; 15(11): 1319-1330
- URL: https://www.wjgnet.com/1007-9327/full/v15/i11/1319.htm
- DOI: https://dx.doi.org/10.3748/wjg.15.1319


