Copyright
©2009 The WJG Press and Baishideng.
World J Gastroenterol. Mar 21, 2009; 15(11): 1289-1300
Published online Mar 21, 2009. doi: 10.3748/wjg.15.1289
Published online Mar 21, 2009. doi: 10.3748/wjg.15.1289
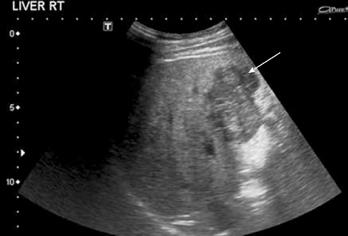
Figure 1 HCC.
B-mode US demonstrates a heterogeneous hypoechoic solid liver lesion (arrow) in segment IV, confirmed to be HCC at histological examination. Note the background of an echogenic liver with an irregular surface.
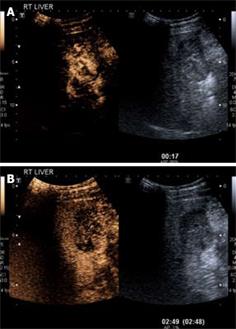
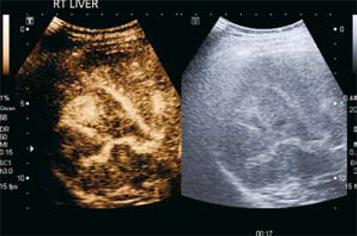
Figure 2 HCC.
A: CEUS in the arterial phase (17 s following injection) demonstrates arterial phase enhancement of the solid lesion (corresponding grey scale image of the lesion is shown on the right hand side; software known as “twin view” which helps the sonologist track the lesion through the phases of enhancement). Note the “basket weave” pattern of angiogenic vessels with haphazard enhancement of this lesion; B: Twin view of the same segment IV lesion in the delayed phase (2 min 49 s following injection) of the same lesion as Figure 2A demonstrates contrast wash-out compared to the surrounding liver parenchyma which are features of a malignant lesion.
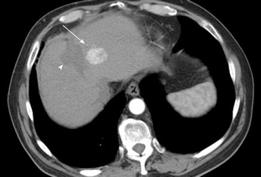
Figure 3 HCC.
Contrast enhanced CT demonstrates heterogeneous arterial phase enhancement of a focal liver lesion (arrow) adjacent to a low attenuation area representing a previous radiofrequency ablation site (arrowhead).
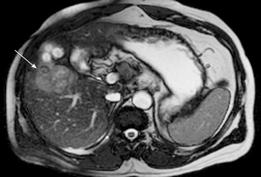
Figure 4 HCC.
T2-weighted gradient echo sequence shows a solid lesion in segment V (arrow) of the liver which is of intermediate signal hyperintensity compared to the surrounding liver parenchyma.
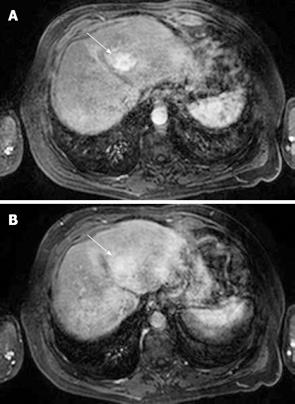
Figure 5 HCC.
A: T1-weighted fat-suppressed sequence following gadolinium intravenous injection shows arterial phase enhancement of a focal liver lesion in segment IV (arrow); B: HCC: The same lesion as shown in Figure 5A becomes relatively less conspicuous on the portal phase images (arrow) as the surrounding liver parenchyma begins to enhance.
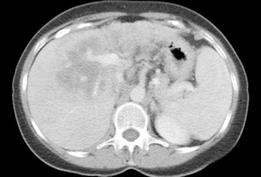
Figure 6 Cholangiocarcinoma.
Contrast enhanced CT in the portal venous-dominant phase demonstrates a poorly-enhancing central liver lesion. The hypodensity appears to follow some of the biliary radicals.
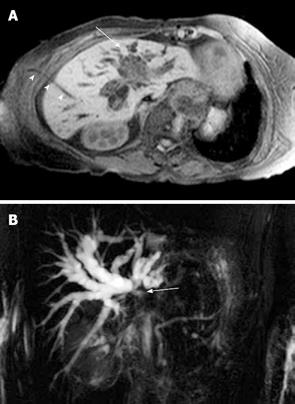
Figure 7 Cholangiocarcinoma.
A: Contrast-enhanced T1-weighted magnetic resonance sequence shows irregular central liver mass (arrow) which enhances poorly in comparison to the adjacent liver parenchyma. There is intrahepatic bile duct dilatation and an external biliary drain (arrowheads); B: Maximum intensity projection image of the MRCP study of the same case as shown in Figure 7A demonstrates marked intrahepatic bile duct dilatation and abrupt cut-off at the liver hilum (due to obstructing tumour) (arrow) with non-visualisation of the extrahepatic ducts.
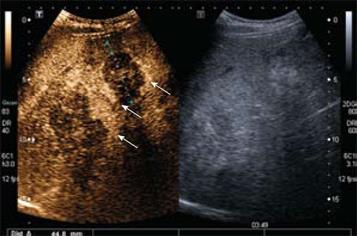
Figure 8 Hepatic metastases.
Delayed phase CEUS (3 min 49 s following contrast injection) demonstrates two hypoechoic liver metastases following contrast washout with a residual peripheral rim of enhancement (arrows). Note that the adjacent image demonstrates that these lesions are echogenic on grey-scale and are poorly defined. The margins are better defined with contrast enhancement (right hand image).
Figure 9 Hepatic metastases.
CEUS obtained in the arterial phase (17 s following contrast injection) demonstrates enhancement of a hypervascular liver metastasis from a colorectal primary tumor. It is the washout with peripheral rim enhancement in the delayed phase (see Figure 8) which helps confirm this to be a metastasis.
- Citation: Ariff B, Lloyd CR, Khan S, Shariff M, Thillainayagam AV, Bansi DS, Khan SA, Taylor-Robinson SD, Lim AK. Imaging of liver cancer. World J Gastroenterol 2009; 15(11): 1289-1300
- URL: https://www.wjgnet.com/1007-9327/full/v15/i11/1289.htm
- DOI: https://dx.doi.org/10.3748/wjg.15.1289


