Copyright
©2008 The WJG Press and Baishideng.
World J Gastroenterol. Mar 7, 2008; 14(9): 1353-1357
Published online Mar 7, 2008. doi: 10.3748/wjg.14.1353
Published online Mar 7, 2008. doi: 10.3748/wjg.14.1353
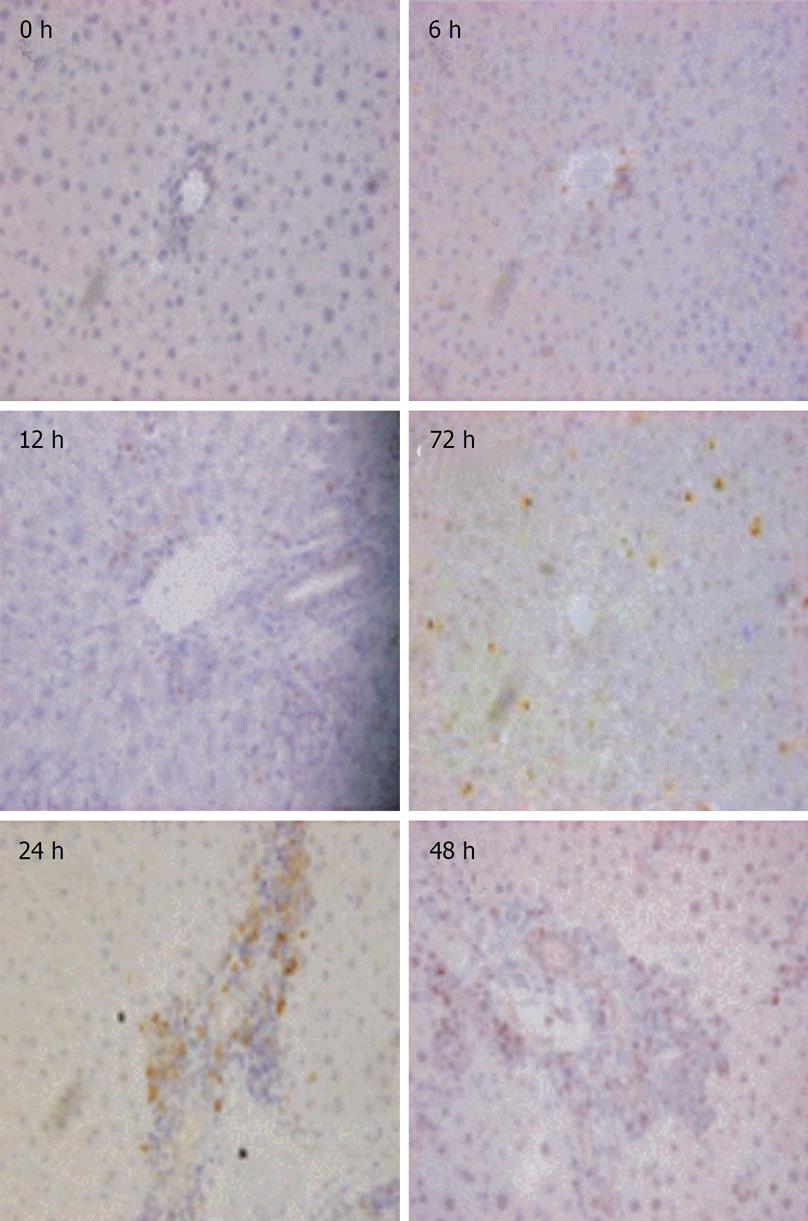
Figure 1 Rat liver stained using anti-TACE antibodies at various time points after hepatectomy.
None of the parenchymal cells was stained at any of the time points. MNC accumulated markedly at periportal sites from 24 to 48 h after hepatectomy while intense TACE staining was seen. MNC declined and distributed to the intermediate regions after 72 h (× 400).
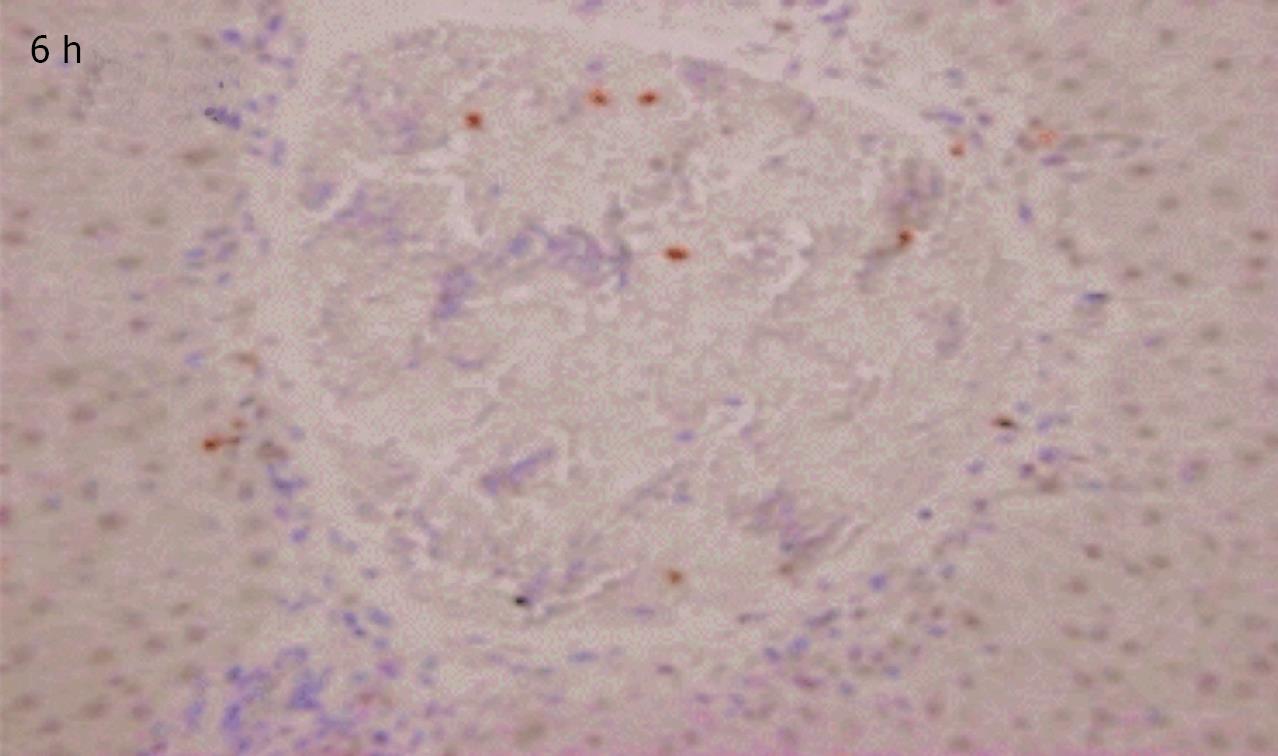
Figure 2 The TACE stained MNC in portal vein current 6 h after hepatectomy.
The MNC infiltrated to periportal sites through portal triad vein endothelial cells (× 400).
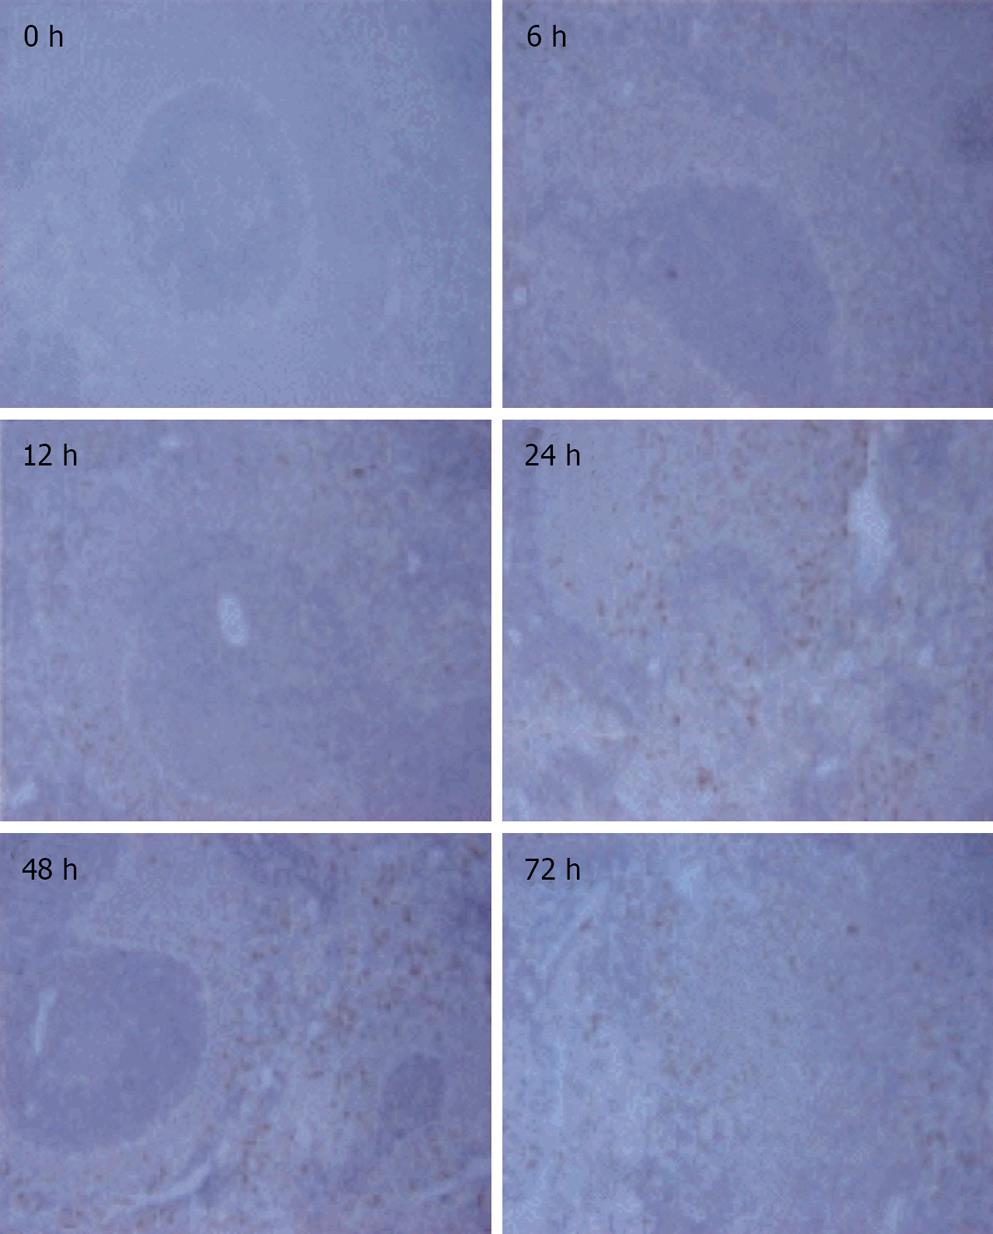
Figure 3 Immunostaining of TACE in rat spleen tissue at various time points.
The TACE-stained MNC increased, reaching a peak at similar time points with liver. The positively stained MNC distributed at the marginal zone and splenic sinus. Numbers indicate the time points after hepatectomy (× 400).
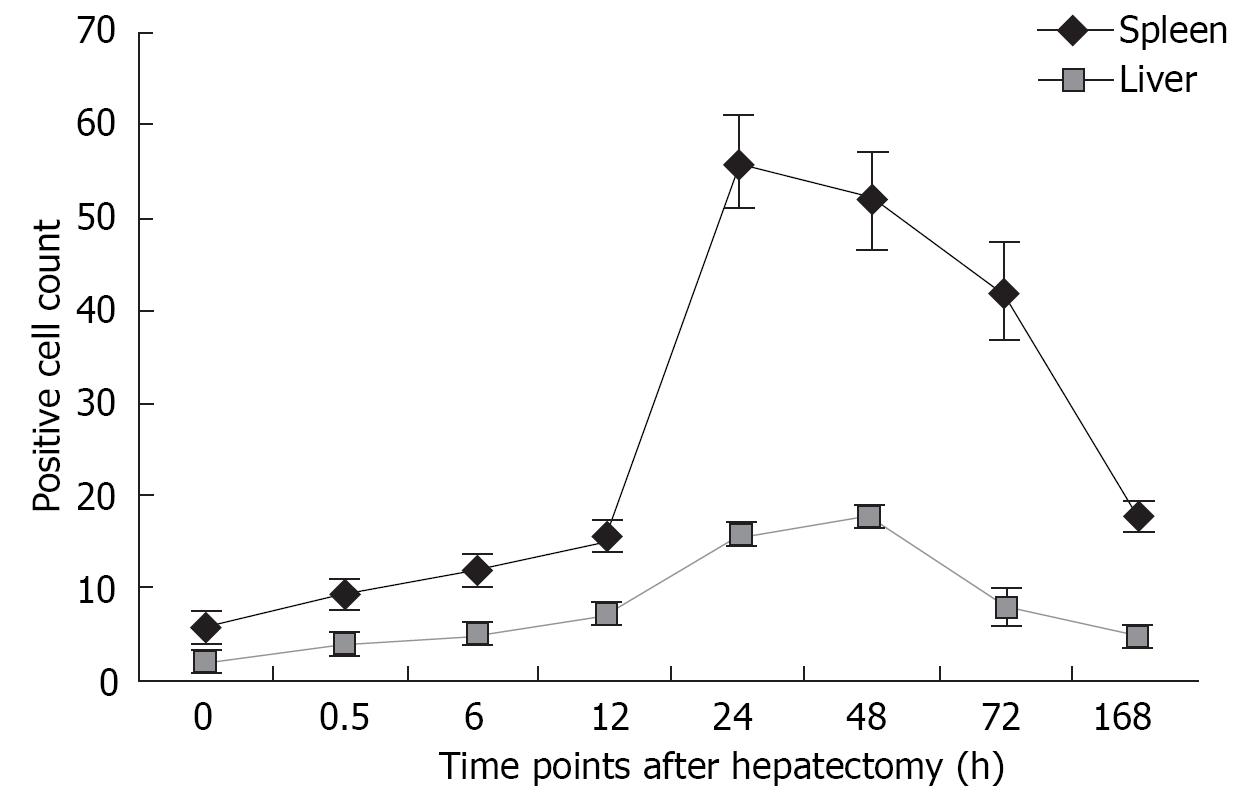
Figure 4 TACE-positive MNC in liver and spleen at various time points after hepatectomy.
Data are mean ± SD, n = 7 animals in each group.
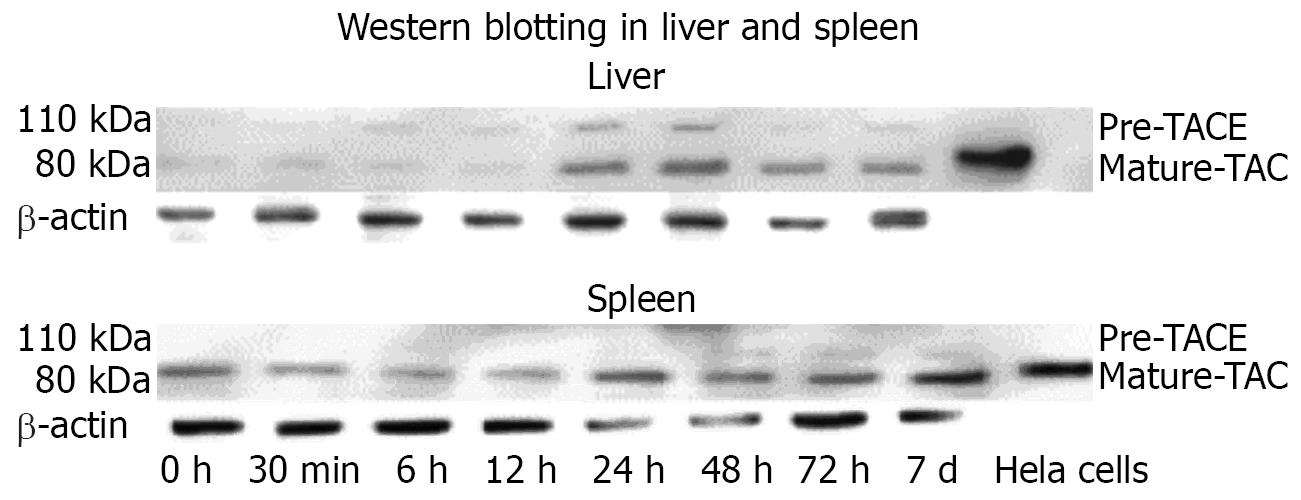
Figure 5 TACE protein level in rat liver and spleen following partial hepatectomy.
Rat liver and spleen tissue samples taken at various time points were processed and subjected to Western blot analysis using anti-TACE antibodies. The hela cells were lysed and the proteins were loaded as a positive control. Expression of TACE in liver and spleen after hepatectomy is a time-dependent alteration, reaching a maximal level between 24 and 48 h.
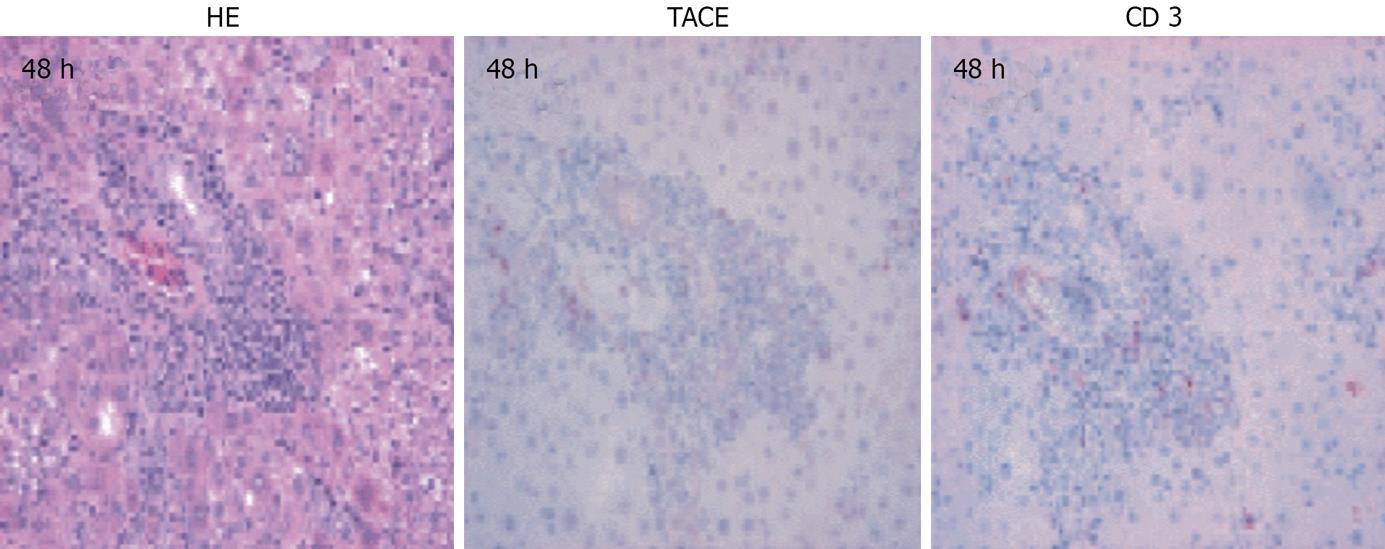
Figure 6 The serial paraffin sections of liver tissue at 48 h after hepatectomy were stained with HE and immunostained with anti-TACE antibodies and anti-CD3 antibodies.
TACE-positive MNC partially overlapped with CD3+ T lymphocytes (× 400).
- Citation: Lin XM, Liu YB, Zhou F, Wu YL, Chen L, Fang HQ. Expression of tumor necrosis factor-alpha converting enzyme in liver regeneration after partial hepatectomy. World J Gastroenterol 2008; 14(9): 1353-1357
- URL: https://www.wjgnet.com/1007-9327/full/v14/i9/1353.htm
- DOI: https://dx.doi.org/10.3748/wjg.14.1353


