Copyright
©2008 The WJG Press and Baishideng.
World J Gastroenterol. Feb 28, 2008; 14(8): 1212-1217
Published online Feb 28, 2008. doi: 10.3748/wjg.14.1212
Published online Feb 28, 2008. doi: 10.3748/wjg.14.1212
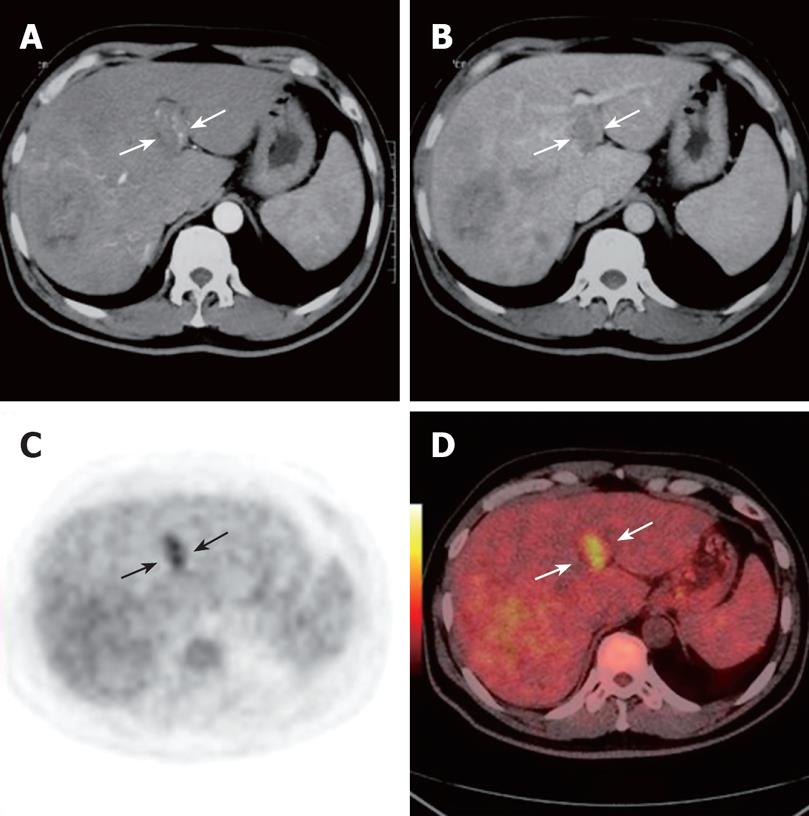
Figure 1 Contrast CT scan showing right lobe and caudate lobe mass and portal vein thrombus in a 55-year-old man.
During the arterial phase, the thrombus appears as an iso- to hypodense intraluminal area with dense linear enhancement (white arrows, A). A filling defect was detected in the left branch during the portal phases (white arrows, B). PET (black arrows, C) and PET/CT fused images (white arrows, D) reveal a highly metabolic thrombus in the left branch.
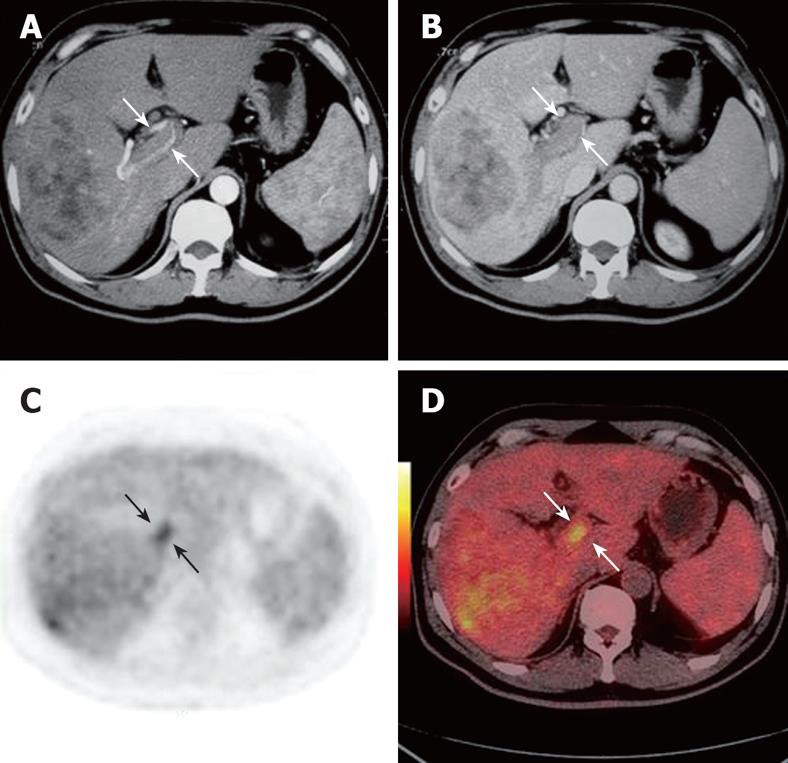
Figure 2 Contrast CT scan showing right lobe and caudate lobe mass and portal vein thrombus of the right branch in the same patient.
During the arterial phase, the thrombus appears as an iso- to hypodense intraluminal area with dense linear enhancement (white arrows, A). A filling defect was detected in the right branch during the portal phases (white arrows, B). PET (black arrows, C) and PET/CT fused images (white arrows, D) reveal a highly metabolic thrombus in the left branch.
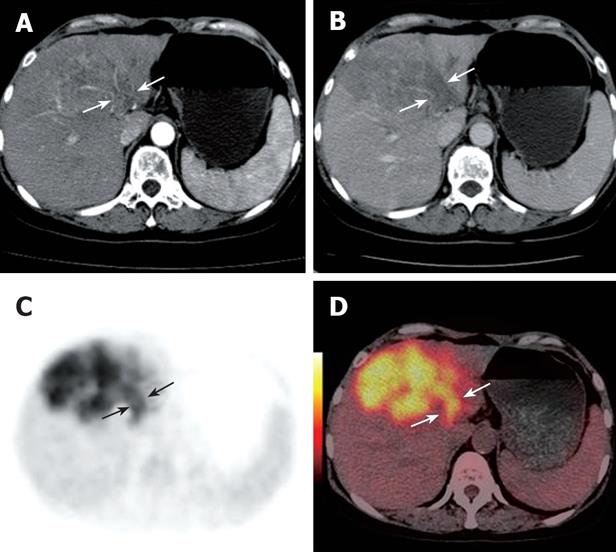
Figure 3 Contrast CT scan demonstrating a left lobe mass and portal vein thrombus in a 60-year-old woman.
During the arterial phase, the thrombus appears as a hypodense intraluminal area with dense linear enhancement (white arrows, A). A filling defect was detected in the left branch during the portal phases (white arrows, B). PET (black arrows, C) and PET/CT fused images (white arrows, D) reveal a highly metabolic thrombus in the left branch.
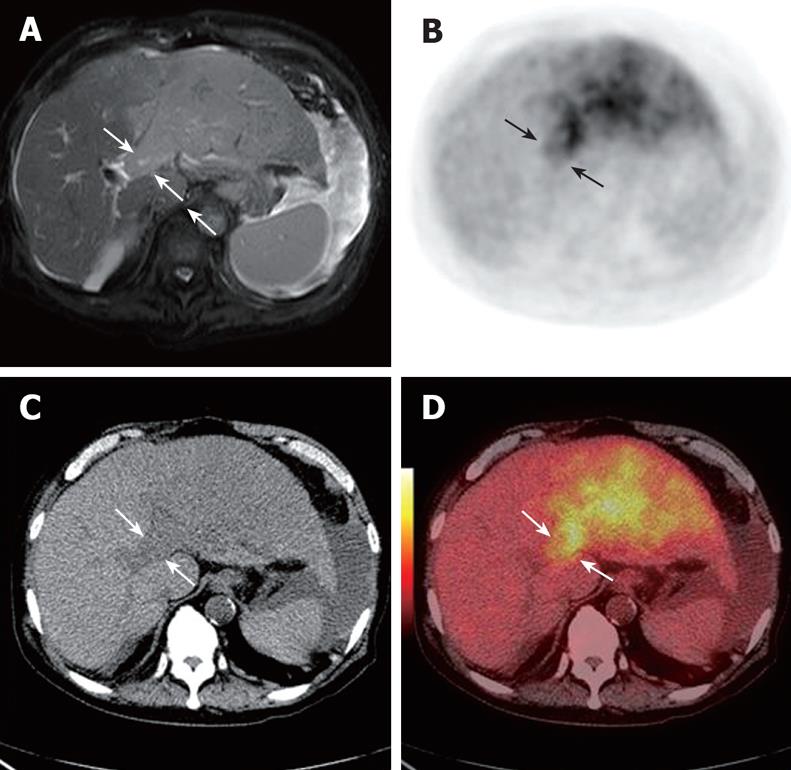
Figure 4 MRI scan showing a left lobe mass and portal vein thrombus in an 80-year-old man (white arrows, A).
CT detected a low-density lesion in the left branch (white arrows, C). PET (black arrows, B) and PET/CT fused images (white arrows, D) reveal a highly metabolic thrombus in the left branch.
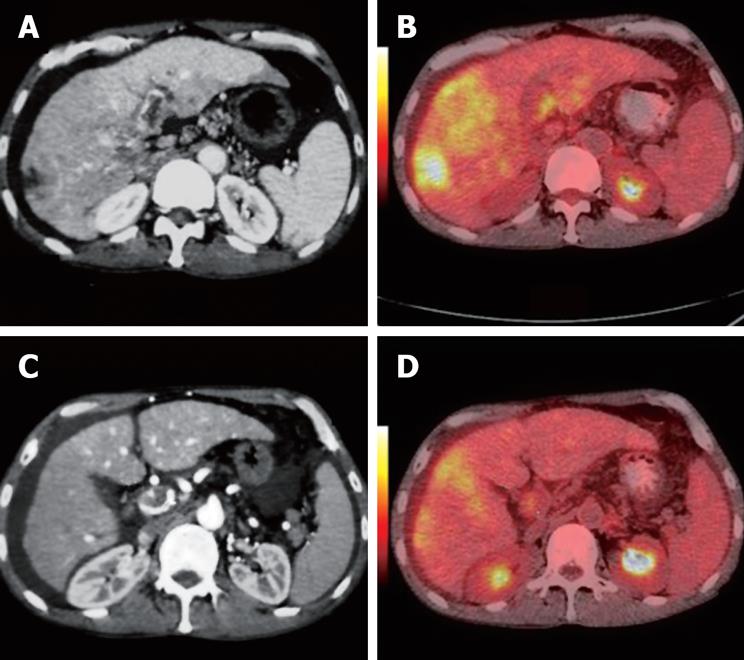
Figure 5 Contrast CT scan showing a diffuse tumor and portal vein thrombus in a 44-year-old man.
During the arterial phase, the thrombus appears as a hypodense intraluminal area with mild enhancement at the LV (white arrows, A) and PV (white arrows, C). PET/CT fused images reveal a highly metabolic mass and a highly metabolic thrombus at the LV and PV, respectively (white arrows, B, D).
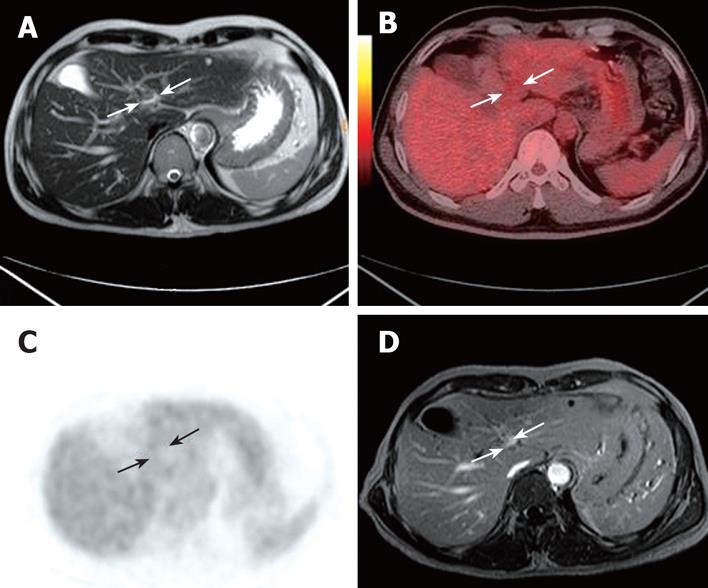
Figure 6 MRI showing a portal vein thrombus in a 44-year-old man six months after HCC resection (white arrows, A).
PET/CT fused images (white arrows, B) and PET (black arrows, C) reveal no highly metabolic thrombus in the left branch. LP was recanalized in the contrast MRI at 10 mo follow-up (white arrows, D).
- Citation: Sun L, Guan YS, Pan WM, Chen GB, Luo ZM, Wei JH, Wu H. Highly metabolic thrombus of the portal vein: 18F fluorodeoxyglucose positron emission tomography/computer tomography demonstration and clinical significance in hepatocellular carcinoma. World J Gastroenterol 2008; 14(8): 1212-1217
- URL: https://www.wjgnet.com/1007-9327/full/v14/i8/1212.htm
- DOI: https://dx.doi.org/10.3748/wjg.14.1212


