Copyright
©2008 The WJG Press and Baishideng.
World J Gastroenterol. Feb 28, 2008; 14(8): 1175-1181
Published online Feb 28, 2008. doi: 10.3748/wjg.14.1175
Published online Feb 28, 2008. doi: 10.3748/wjg.14.1175
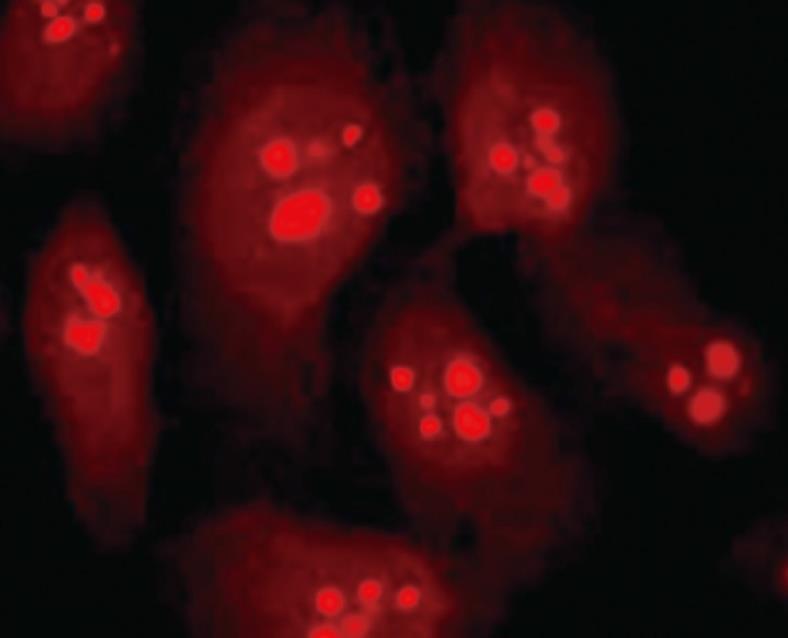
Figure 1 Localization of endogenous RhoA in SGC-7901 cells.
RhoA was immunofluorescently stained with a specific mAb and it was localized in the cytoplasm, the membrane, and the nucleus (× 400).
Figure 2 Distribution of RhoA in membrane, cytosol, and nucleus in SGC-7901 cells.
SGC-7901 cells were lysed and membrane (A), cytosol (B) and nuclear (C) fractions were obtained. Expression of RhoA in each fraction was detected by Western blotting using a specific anti-RhoA mAb.
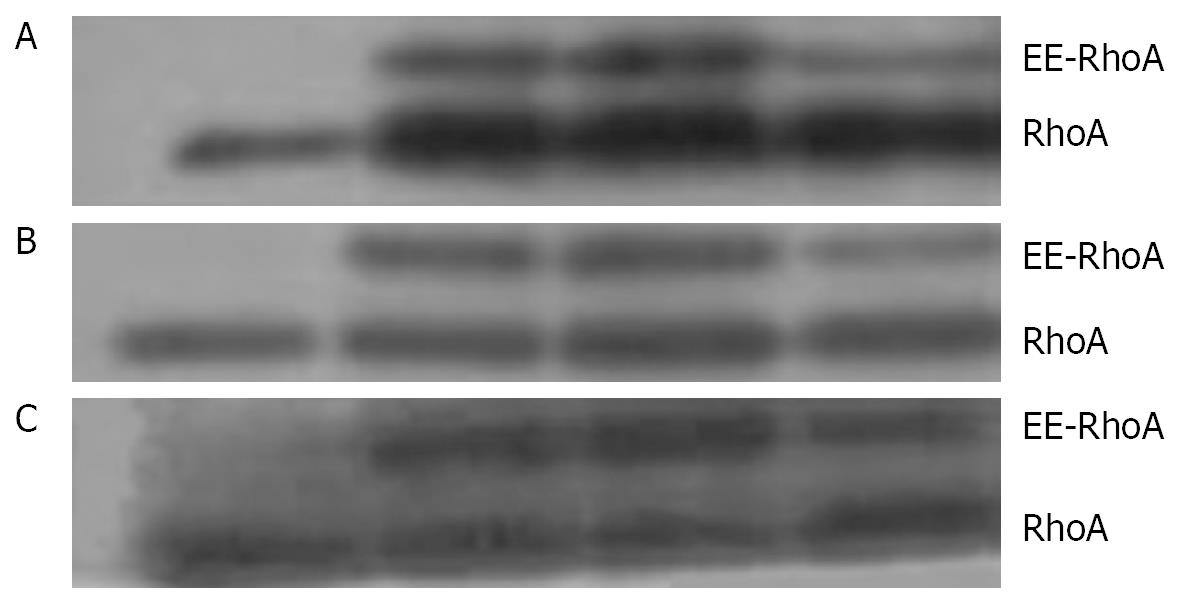
Figure 3 Distribution of endogenous and exogenous RhoA in membrane, cytosol, and nucleus in SGC-7901 cells.
SGC-7901 cells were transfected with three types of exogenous EE-tagged RhoA plasmids, and 24 h later, cells were lysed and membrane (A), cytosolic (C) and nuclear (B) fractions were obtained. The expression of different RhoA proteins (lane 1 mock, lane 2 wild type, lane 3 63L, lane 4 N19) in each fraction was detected by Western blotting with mAb against RhoA.
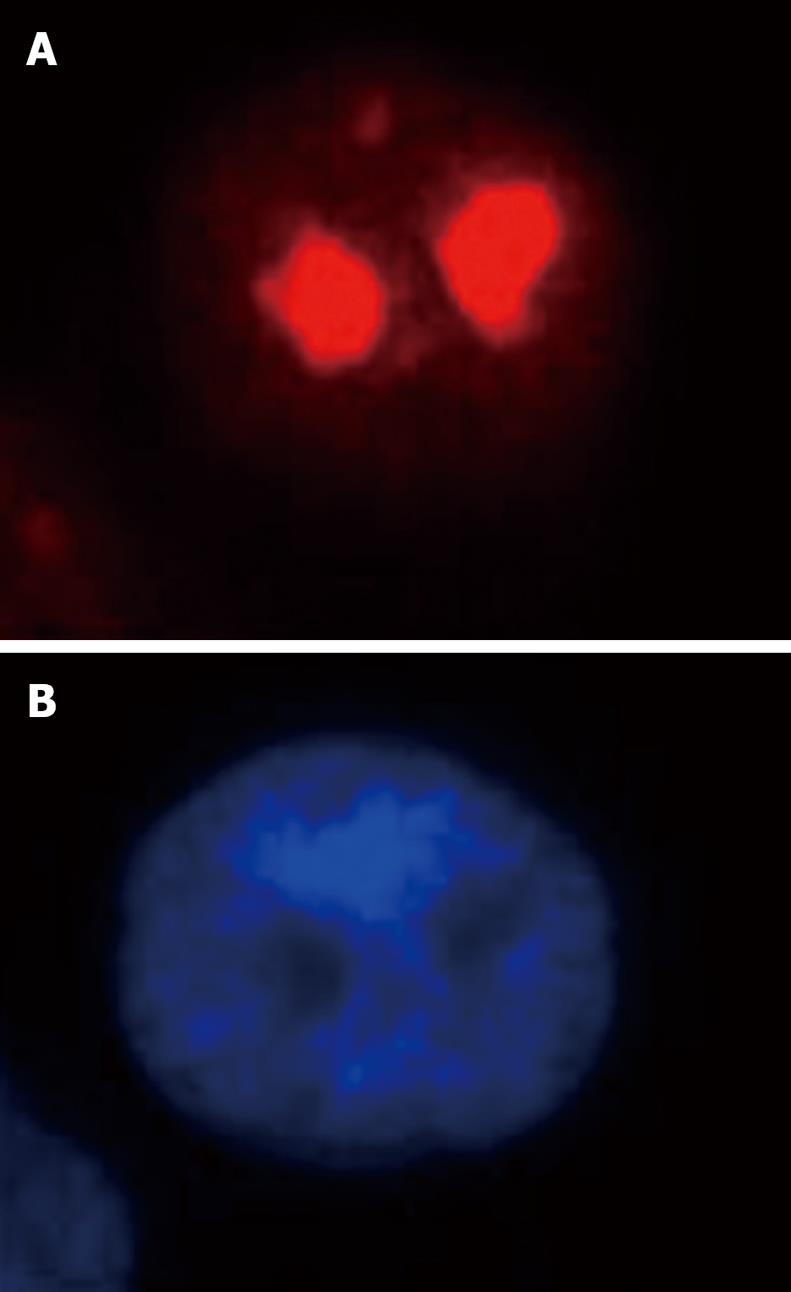
Figure 4 Localization of RhoA in the nucleolus of interphase SGC-7901 cells.
RhoA in SGC-7901 cells of interphase was immunofluorescently stained with monoclonal antibody against RhoA (A). The chromosomes were stained with Hoechst 33342 (B) (× 1000).
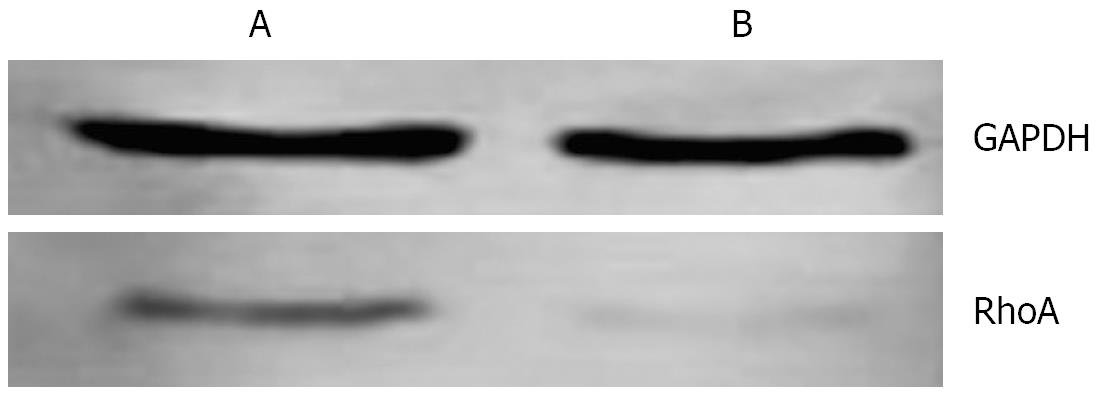
Figure 5 RhoA could be detected in nucleolus in SGC-7901 cells.
SGC-7901 cells were lysed and the nucleolus fraction was obtained. Expression of RhoA in the nucleolus fraction (B) was detected by Western blotting with a mAb directed against RhoA, and total protein obtained from SGC-7901 cells (A) served as the positive control.
Figure 6 The expression of RhoA protein was higher in interphase than in mitosis phase in HeLa cells.
HeLa cells were treated with Taxol (5 &mgr;g/mL, 12 h). Control (attached) (A) or mitotic (“shake off”) (B) cells were lysed and the expressions of RhoA and GAPDH were detected by Western blotting with mABs directed against RhoA and GAPDH.
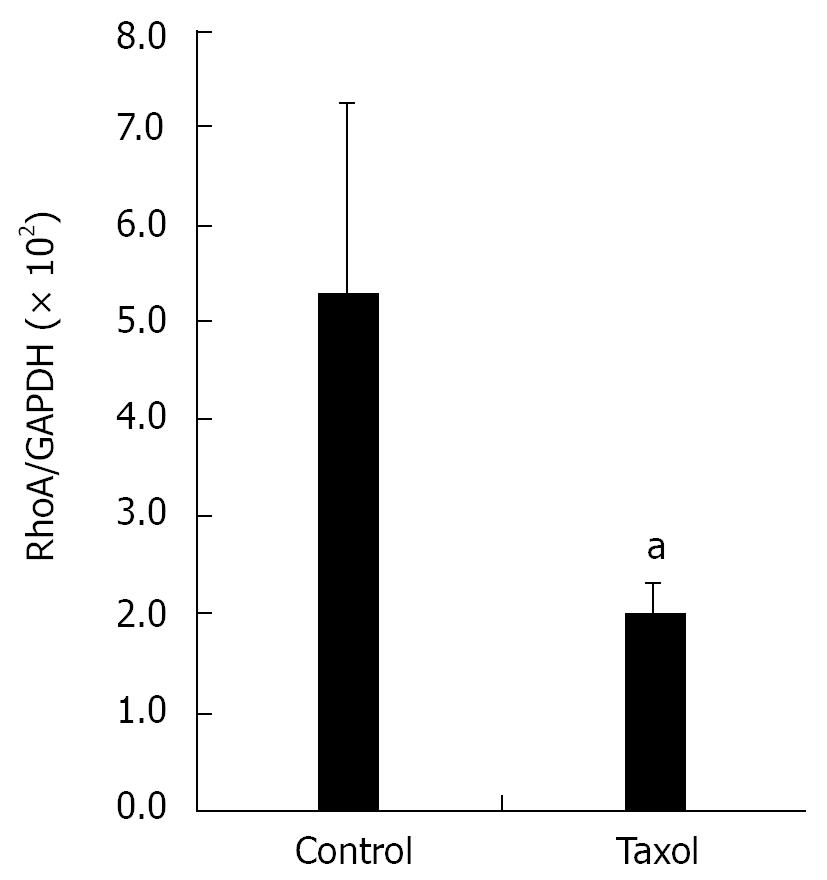
Figure 7 The mRNA expression of RhoA gene was higher in interphase than in mitosis phase in HeLa cells.
HeLa cells were treated with Taxol (5 &mgr;g/mL, 12 h). Total mRNA was isolated from control (attached) and mitotic (“shake off”) cells, and the expression of RhoA gene was detected by real-time quantitative PCR. Each bar represents mean ± SE obtained from five independent experiments. aP < 0.05.
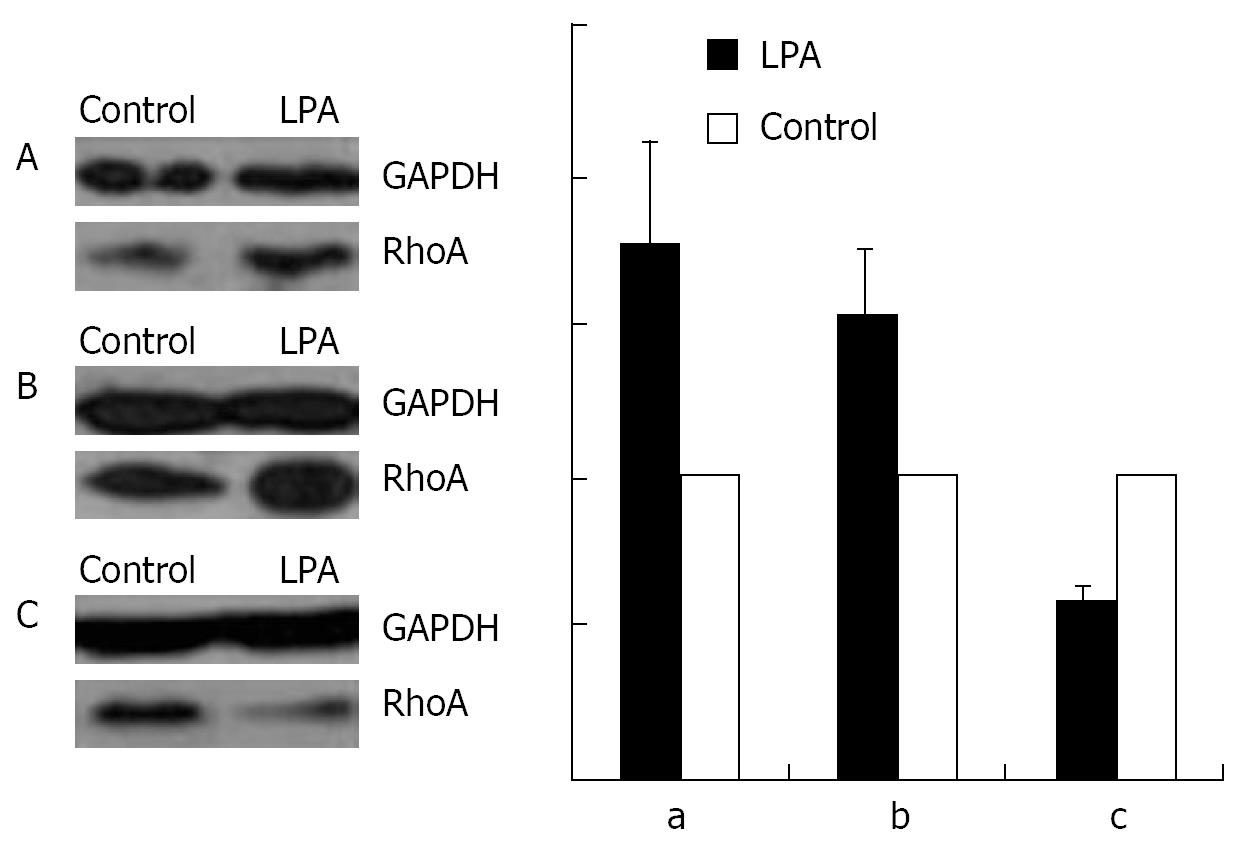
Figure 8 LPA-induced RhoA translocation from cytosol towards membrane and nucleus in SGC-7901 cells.
SGC-7901 cells were treated with or without LPA (1 &mgr;mol/L, 15 min). Control or LPA -treated cells were lysed and the membrane (A), cytosolic (C), and nuclear (B) fractions were obtained. Expressions of RhoA and GAPDH proteins in each fraction were detected by Western blotting, and the representative band images were shown in the left panels. Densitometric analysis of the bands was shown in the right panels. Each bar represents mean ± SE obtained from five independent experiments. aP < 0.05.
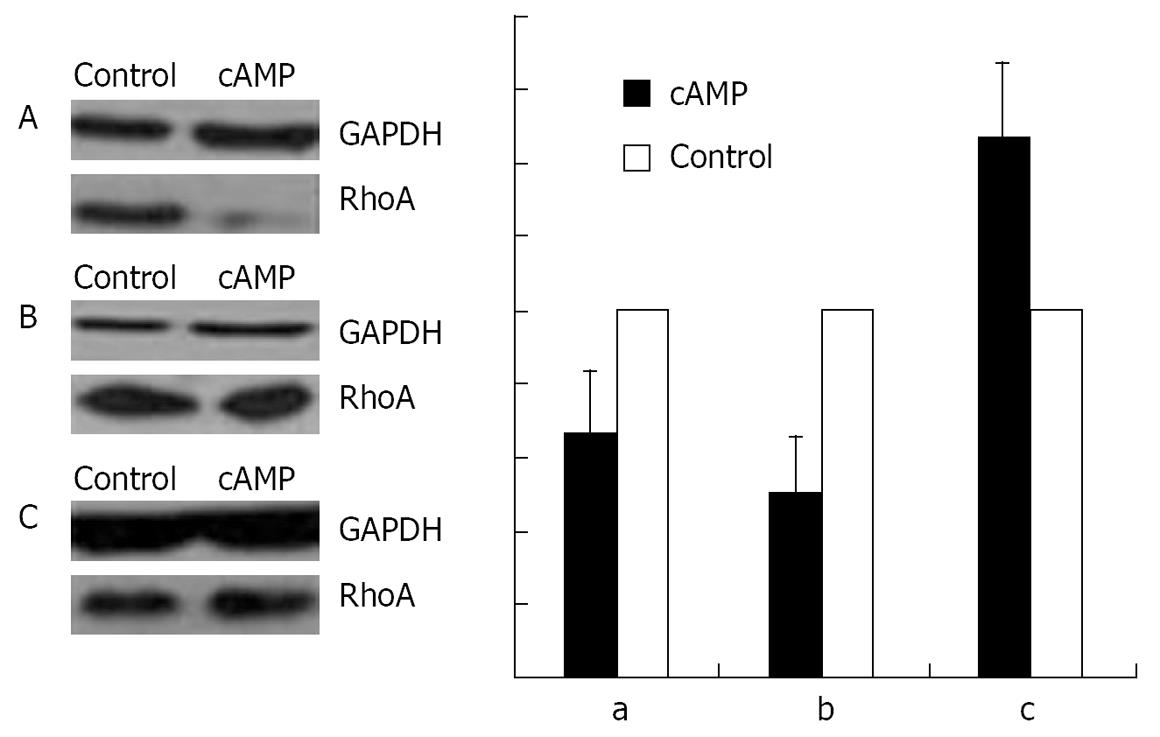
Figure 9 cAMP-induced RhoA translocation from membrane and nucleus towards cytosol in SGC-7901 cells.
SGC-7901 cells were treated with or without CPT-cAMP (250 &mgr;mol/L, 30 min). Control or CPT-cAMP -treated cells were lysed, and membrane (A), cytosolic (C), and nuclear (B) fractions were obtained. Expressions of RhoA and GAPDH proteins in each fraction were detected by Western blotting, and the representative band images were shown in the left panels. Densitometric analysis of the bands was shown in the right panels. Each bar represents mean ± SE obtained from five independent experiments. aP < 0.05.
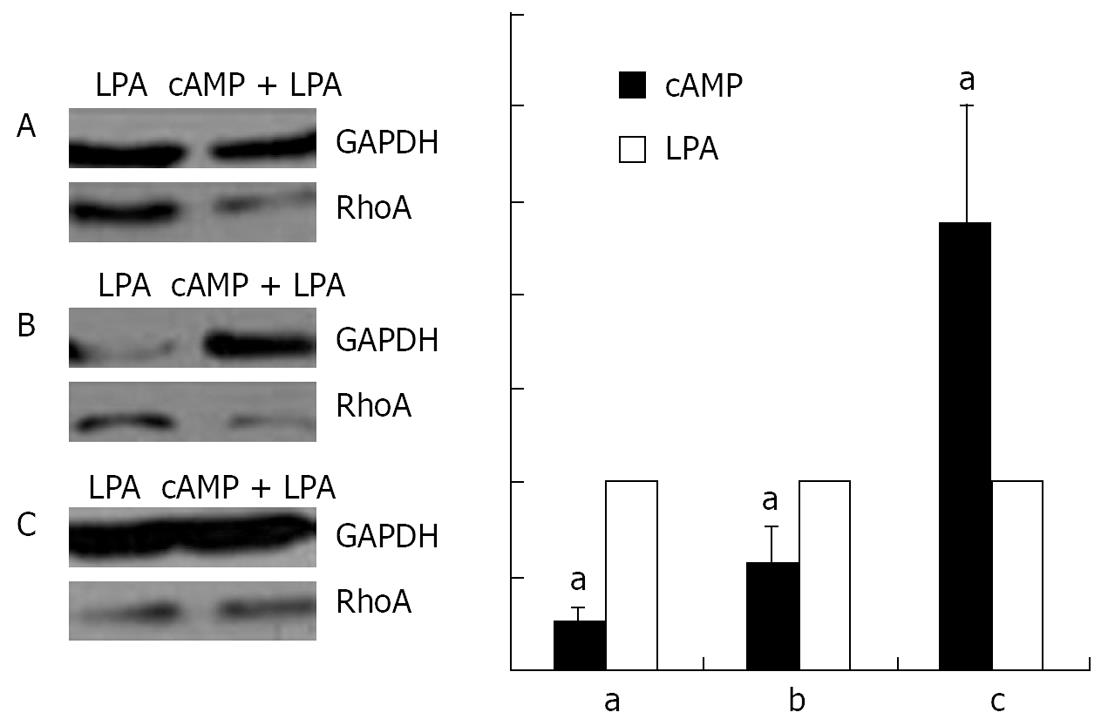
Figure 10 cAMP could block LPA-induced RhoA translocation in SGC-7901 cells.
SGC-7901 cells were pretreated with CPT-cAMP (250 &mgr;mol/L, 30 min), and then with or without LPA (1 &mgr;mol/L, 15 min) treatment. LPA or CPT-cAMP+LPA -treated cells were lysed and membrane (A), cytosolic (C), and nuclear (B) fractions were obtained. Expressions of RhoA and GAPDH proteins in each fraction were detected by Western blotting, and the representative band images were shown in the left panels. Densitometric analysis of the bands was shown in the right panels. Each bar represents mean ± SE obtained from five independent experiments. aP < 0.05.
- Citation: Tao Y, Chen YC, Li YY, Yang SQ, Xu WR. Localization and translocation of RhoA protein in the human gastric cancer cell line SGC-7901. World J Gastroenterol 2008; 14(8): 1175-1181
- URL: https://www.wjgnet.com/1007-9327/full/v14/i8/1175.htm
- DOI: https://dx.doi.org/10.3748/wjg.14.1175


