Copyright
©2008 The WJG Press and Baishideng.
World J Gastroenterol. Feb 14, 2008; 14(6): 884-891
Published online Feb 14, 2008. doi: 10.3748/wjg.14.884
Published online Feb 14, 2008. doi: 10.3748/wjg.14.884
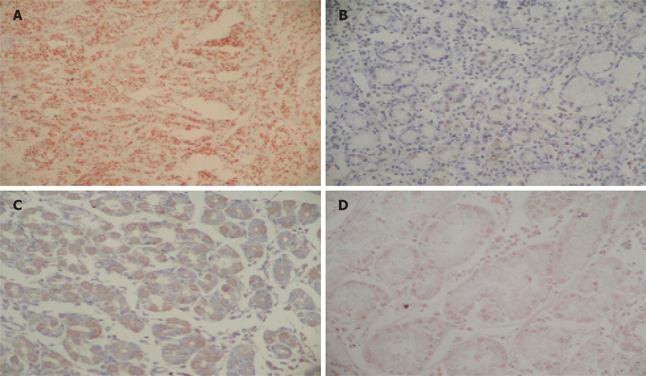
Figure 1 A: In situ hybridization detection of EBV RNA in gastric cancer (X400); B: Bcl-2 expression in gastric carcinoma (× 400); C: Bax expression in gastric carcinoma (×400); D: c-Myc expression in gastric carcinoma (× 400).
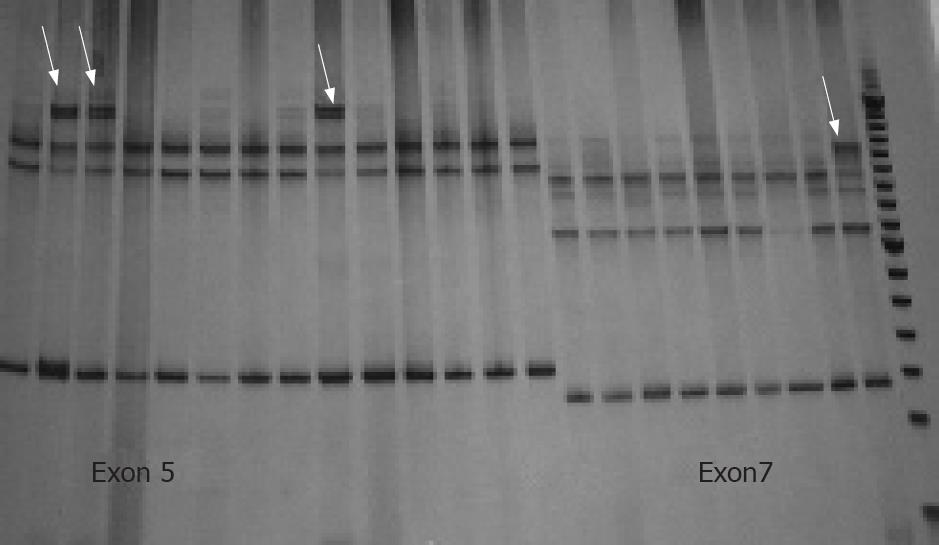
Figure 2 SSCP gel of p53 gene.
The arrows show the different migration patterns of exon 5 (lines 1 to 14) and 7 (lines 15 to 23).
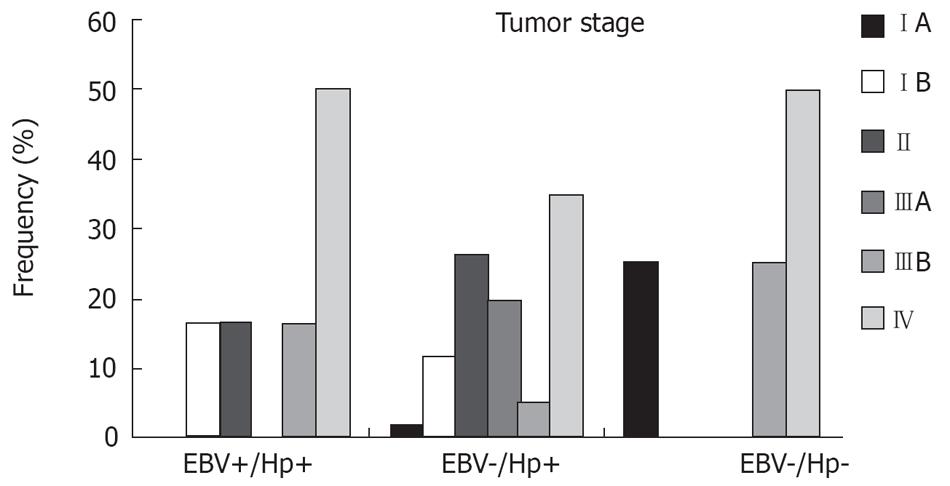
Figure 3 Distribution of the cases by tumor stage in the three defined groups: Hp(+)/EBV(+); Hp(+)/EBV(-); and Hp(-)/EBV(-).
P = 0.179.
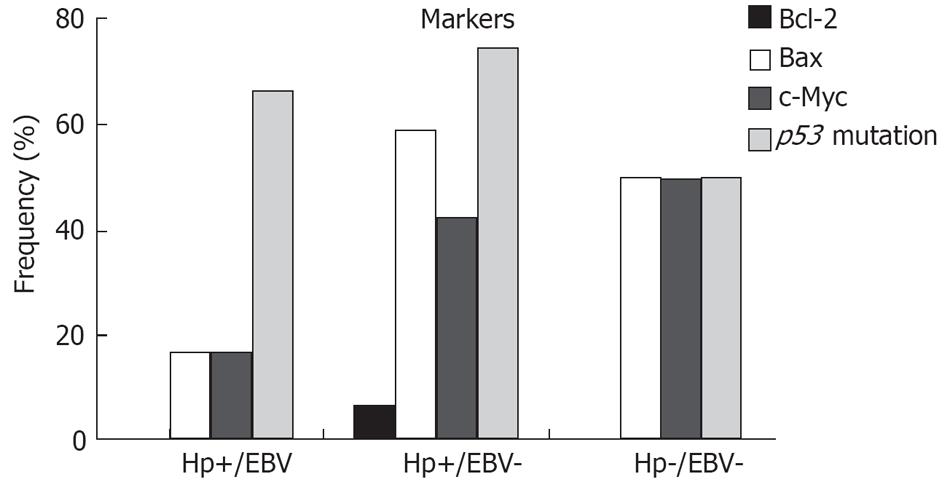
Figure 4 Frequencies of positive cases for the oncoproteins in the three defined groups: Hp(+)/EBV(+); Hp(+)/EBV(-); and Hp(-)/EBV(-).
Bcl-2, P = 0.706; Bax P = 0.135; c-Myc, P = 0.433; p53, P = 0.501.
-
Citation: Lima VP, Lima MAP, André AR, Ferreira MVP, Barros MAP, Rabenhorst SHB.
H pylori (Cag A) and Epstein-Barr virus infection in gastric carcinomas: Correlation withp53 mutation and c-Myc, Bcl-2 and Bax expression. World J Gastroenterol 2008; 14(6): 884-891 - URL: https://www.wjgnet.com/1007-9327/full/v14/i6/884.htm
- DOI: https://dx.doi.org/10.3748/wjg.14.884


