Copyright
©2008 The WJG Press and Baishideng.
World J Gastroenterol. Dec 28, 2008; 14(48): 7345-7352
Published online Dec 28, 2008. doi: 10.3748/wjg.14.7345
Published online Dec 28, 2008. doi: 10.3748/wjg.14.7345
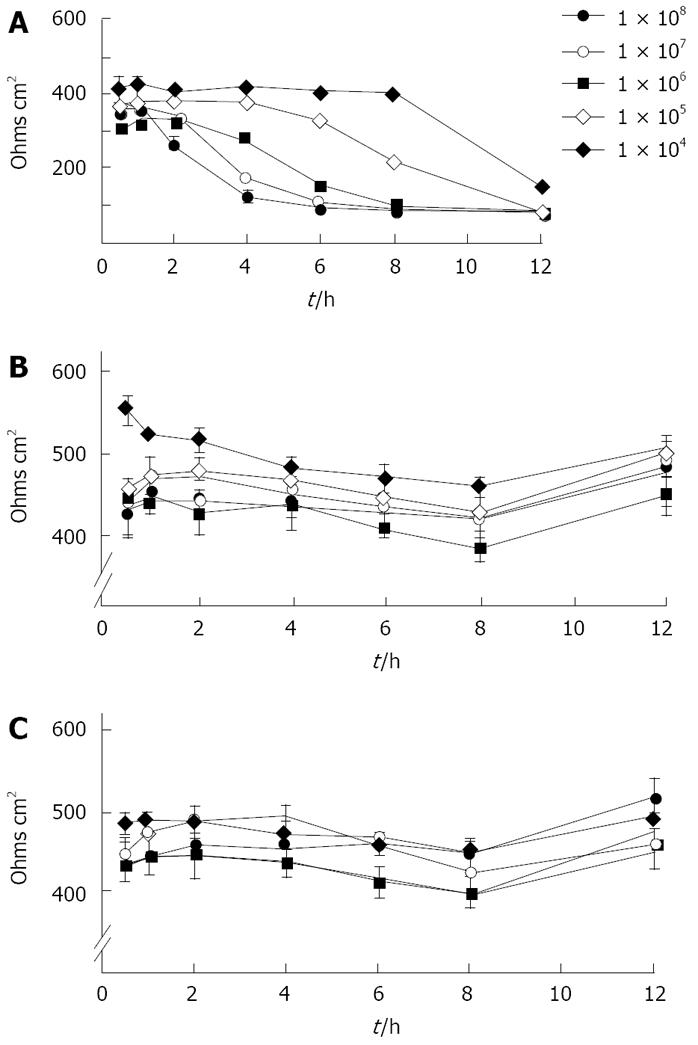
Figure 1 Time course and dose-response of changes in transepithelial resistance after inoculation of T84 cells with three different strains of C jejuni.
A: Strain 2801055 reduced resistance to baseline over 6 h in a time- and dose-dependent manner [data are mean ± SE, n = 3 for each bacterial concentration; P < 0.05 compared with controls (uninfected monolayers)]. Baseline resistance across the filter membrane was 100 Ω.cm2; B: Strain 12189 had no effect on resistance across the monolayer; C: Strain 2102011 had no effect on resistance across the monolayer.
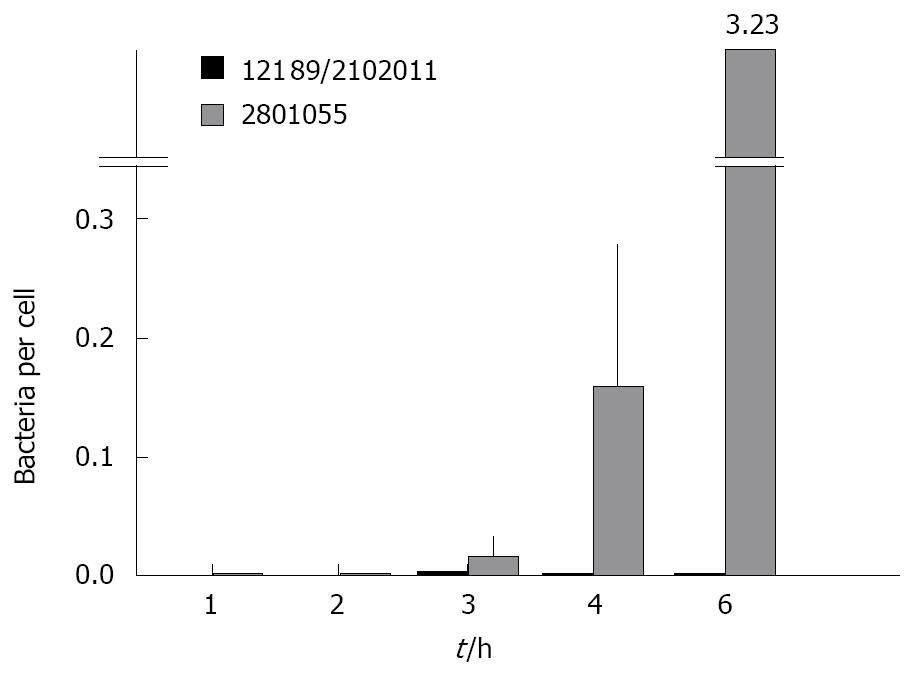
Figure 2 Invasion of monolayers of HCA-7 cells determined by a gentamicin protection assay, corrected for the number of cells remaining per monolayer.
C. jejuni strain 2801055 invaded the cells of the monolayer in a time-dependent manner, while strains 12189 and 2102011 showed no cellular invasion. Data are mean ± SE, n = 4. Analysis of variance showed that the total number of C. jejuni per monolayer was higher for those strains that abrogated transepithelial resistance compared to those that did not (P = 0.033), and that this increased with time (P = 0.02).
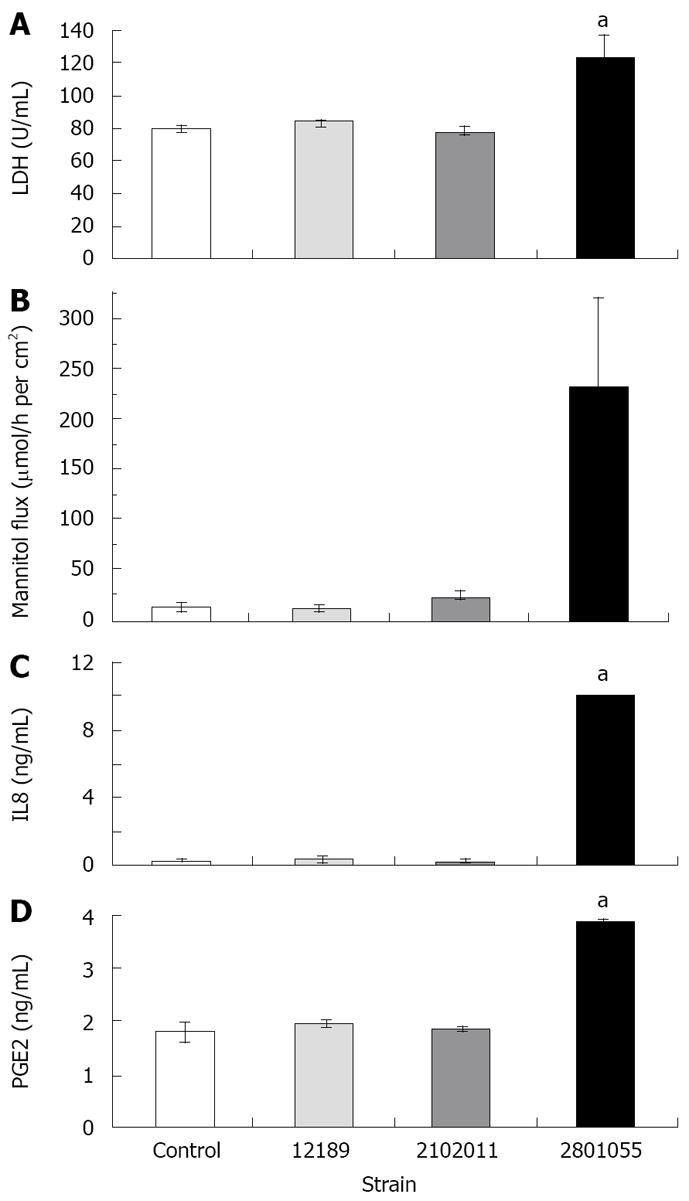
Figure 3 HCA-7 monolayer release of LDH, [3H] mannitol flux and release of IL8 and PGE2 after inoculation with different strains of C.
jejuni. All data are mean ± SE at 4 h, (n = 4). A: Strain 2801055 showed a significantly higher LDH release after 4 h (aP < 0.05) incubation compared to the other two strains, which were similar to control values; B: Strain 2801055 induced a significantly higher flux rate across the monolayer after 4 h (aP < 0.05) incubation compared to the other two strains, which were similar to control values; C: Strain 2801055 showed a significantly higher IL8 release after 4 h (aP < 0.05) incubation compared to the other two strains, which were similar to control values; D: Strain 2801055 showed a significantly higher PGE2 release after 4 h (aP < 0.05) incubation compared to the other two strains, which were similar to control values.
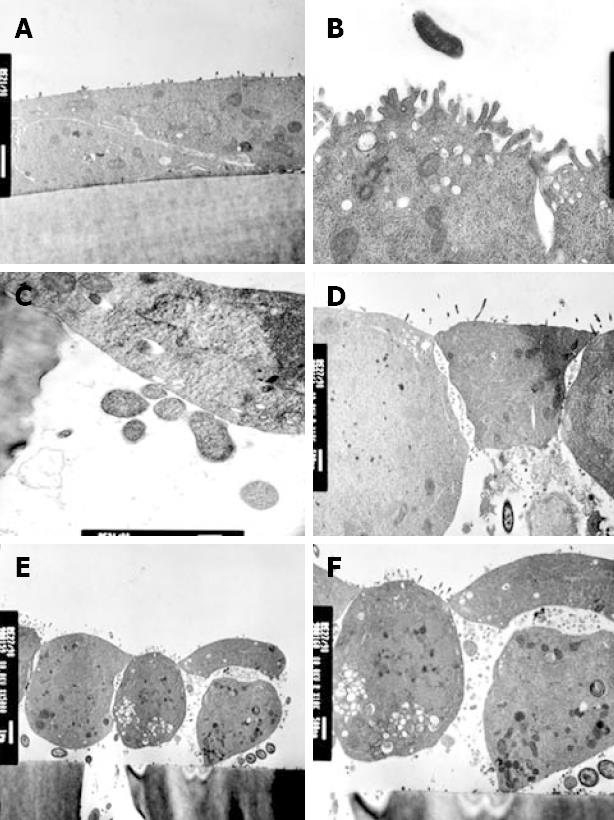
Figure 4 Comparison of the effects of strains 12189 and 2801055 on transmission electron micrograph appearance of monolayers of HCA-7 cells.
A: Following inoculation of strain 12189, 107 bacteria/0.5 mL, on the apical side for 6 h, there was no disruption of monolayer integrity; B: There were normal tight junctions and normal apical microvilli; C: Close cell-to-cell contact is seen with occasional bacteria located in the pores of the filter membrane; D: Following inoculation of strain 12189, 107 bacteria/0.5 mL, on the apical side for 6 h, monolayer integrity was compromised with disruption of tight junctions; E: Monolayers showed condensation of the plasma membrane with lifting and rounding of cells off the supporting membrane. C. jejuni are also seen beneath a cell which is lifting off the membrane; F: Changes are seen at higher power.
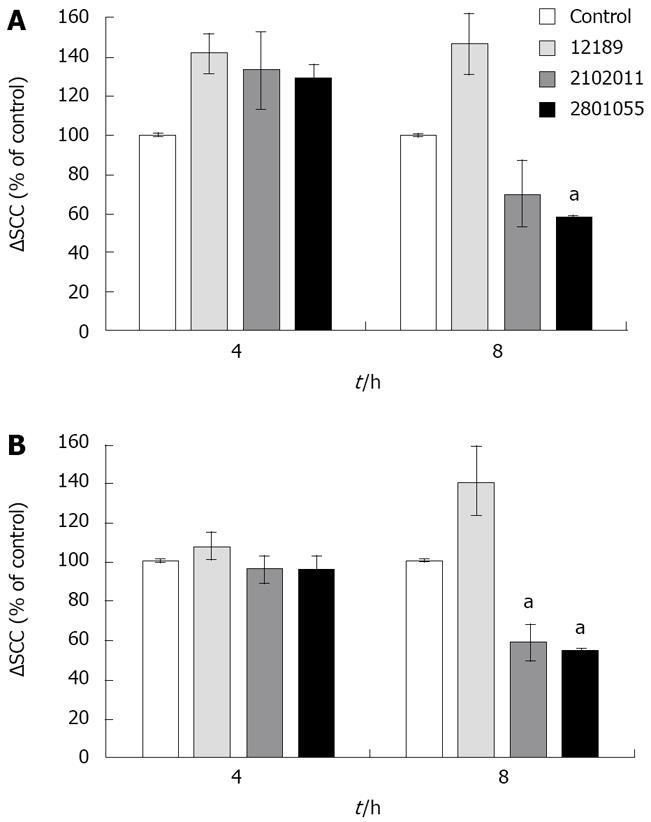
Figure 5 ΔSCC after stimulation with bradykinin (10-6 mol/L) and carbachol (10-4 mol/L) in monolayers inoculated with different strains of C.
jejuni. Data are mean ± SE (n = 4) and are shown as percentage of control. A: Reduced chloride secretory response (represented by SCC) to bradykinin after 8 h inoculation with strain 2801055. aP < 0.05; B: Reduced chloride secretory response to carbachol after 8 h inoculation with strains 2801055 and 2102011. aP < 0.05.
-
Citation: Beltinger J, Buono JD, Skelly MM, Thornley J, Spiller RC, Stack WA, Hawkey CJ. Disruption of colonic barrier function and induction of mediator release by strains of
Campylobacter jejuni that invade epithelial cells. World J Gastroenterol 2008; 14(48): 7345-7352 - URL: https://www.wjgnet.com/1007-9327/full/v14/i48/7345.htm
- DOI: https://dx.doi.org/10.3748/wjg.14.7345


