Copyright
©2008 The WJG Press and Baishideng.
World J Gastroenterol. Dec 28, 2008; 14(48): 7335-7344
Published online Dec 28, 2008. doi: 10.3748/wjg.14.7335
Published online Dec 28, 2008. doi: 10.3748/wjg.14.7335
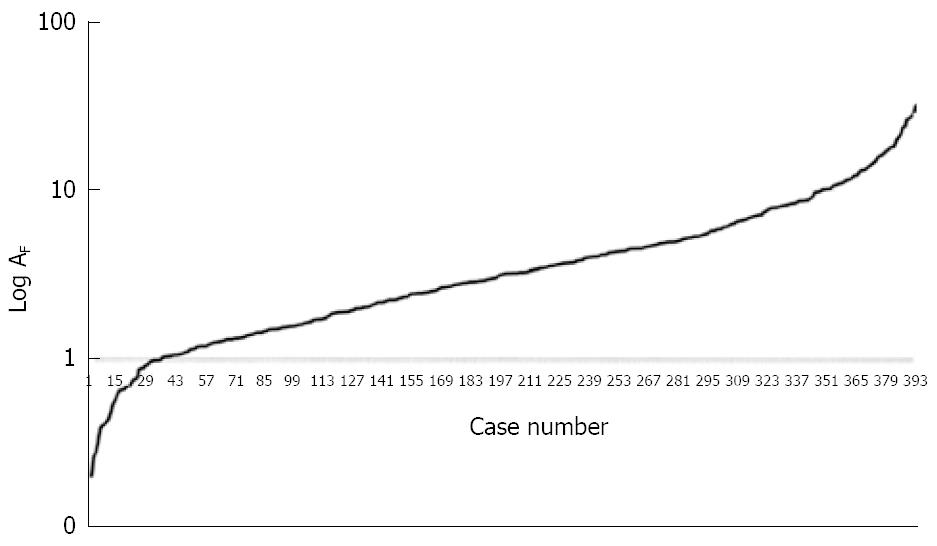
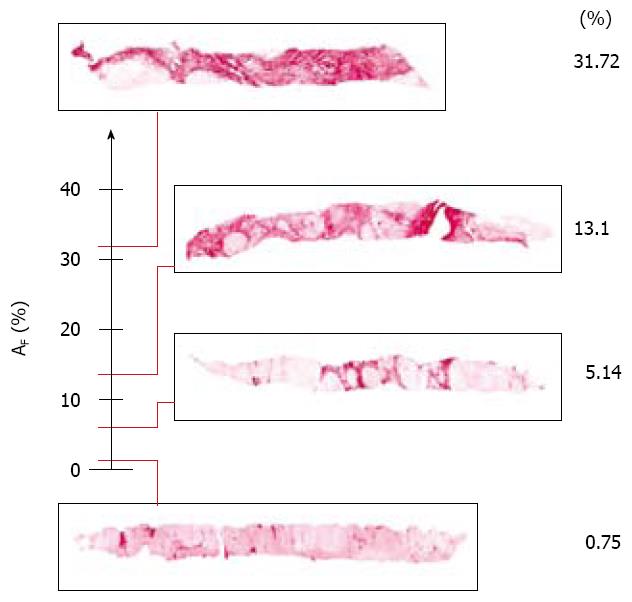
Figure 1 Markovian logarithmic curve obtained with the fibrosis content in each single biopsy section from 398 patients, ordered by increasing severity.
AF = area of fibrosis.
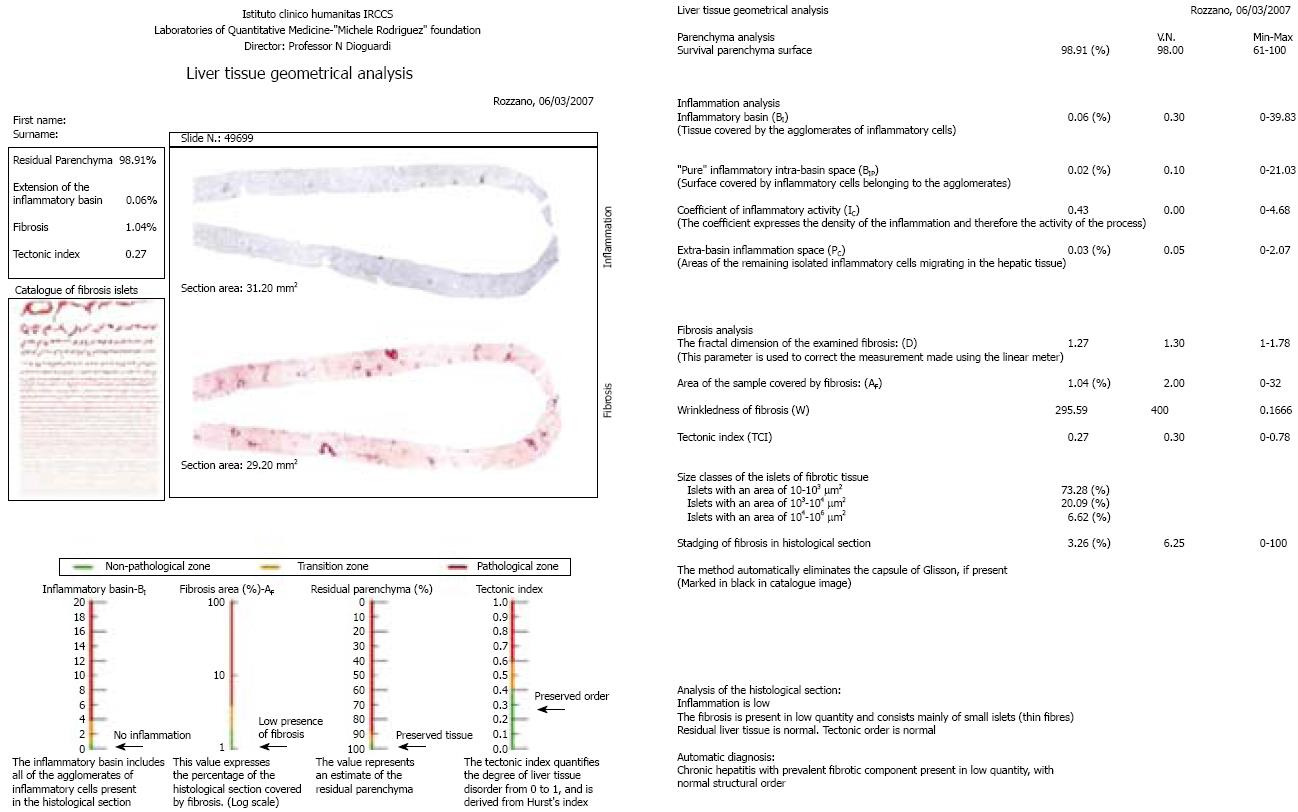
Figure 2 An example of LTGA.
The machine completes the analysis by providing a common language description of the histological pattern and diagnosis.
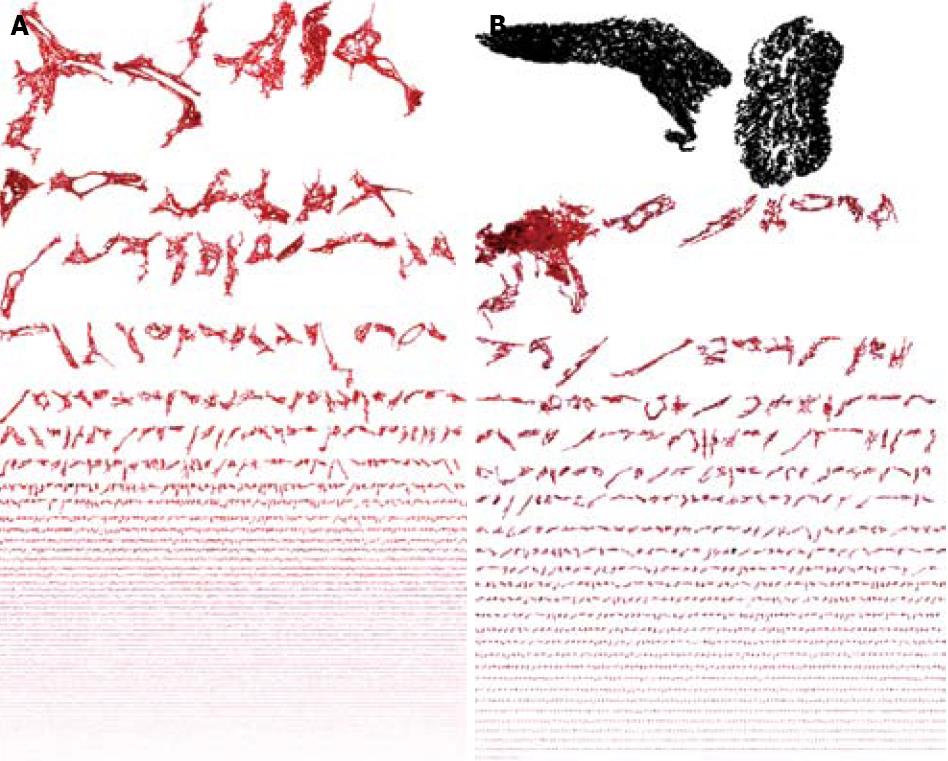
Figure 3 Liver fibrosis.
A: Proto-typical examples of multifarious Sirius-red-stained collagen islets making-up the liver collagen network; B: the Metriser automatically selected and excluded Glisson’s capsule (black islets) from the computation of fibrosis by means of an appropriate algorithm.
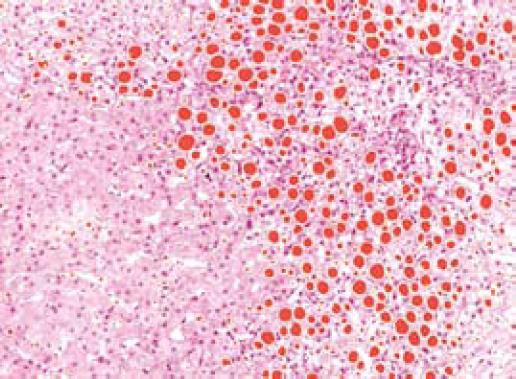
Figure 4 Computer-aided recognition of vacuolization, due to the accu-mulation of lipid vacuoles within hepatocytes.
The image represents only a limited exemplificative area taken from the whole histological section (× 10).
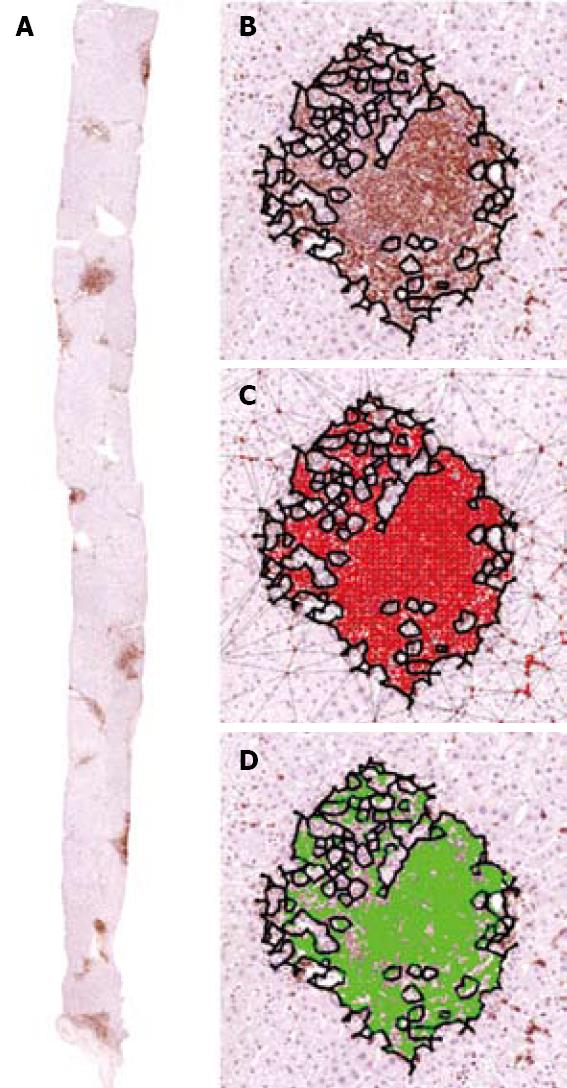
Figure 5 Liver inflammation (× 10).
A: Morphological picture showing the inflammatory cell’ clusters forming the inflammation basin; B: inflammatory cell cluster; C: discrimination of the cluster outline (black line) using the Delaunay’ triangulation; D: pure intra-cluster inflammatory space covered by the inflammation cell bodies (green surface). The immunological staining was performed by treating the sections with monoclonal antibodies raised against LCA.
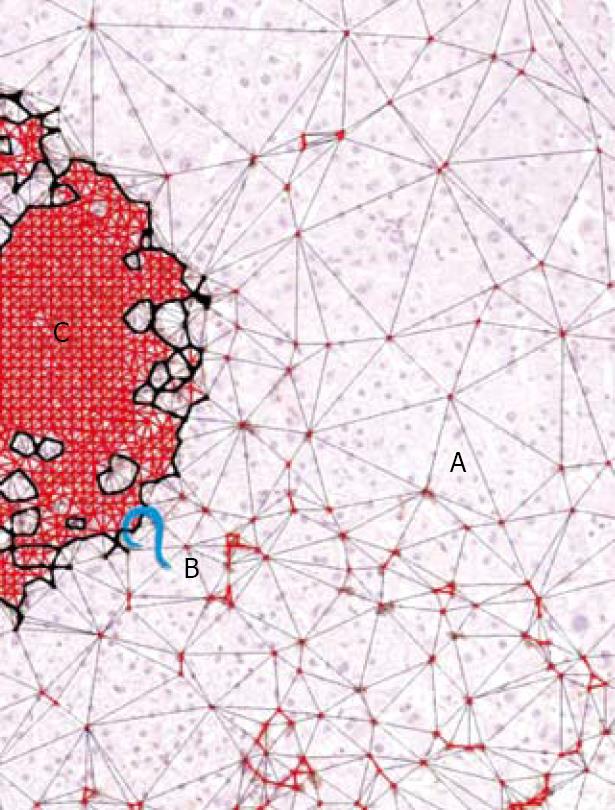
Figure 6 Liver inflammation (× 10).
A: Extra-cluster inflammatory space, which is the sum of micro-areas covered by individual inflammatory cells represented by the nodes of the Delaunay’ triangulation network; B: irregular outline (black line) in which lies the outermost cells distant each other no more than 20-μm; C: the irregular outline divided outermost cells from the inside resident cluster cells. The immunological staining was performed treating the sections with monoclonal antibodies raised against LCA.
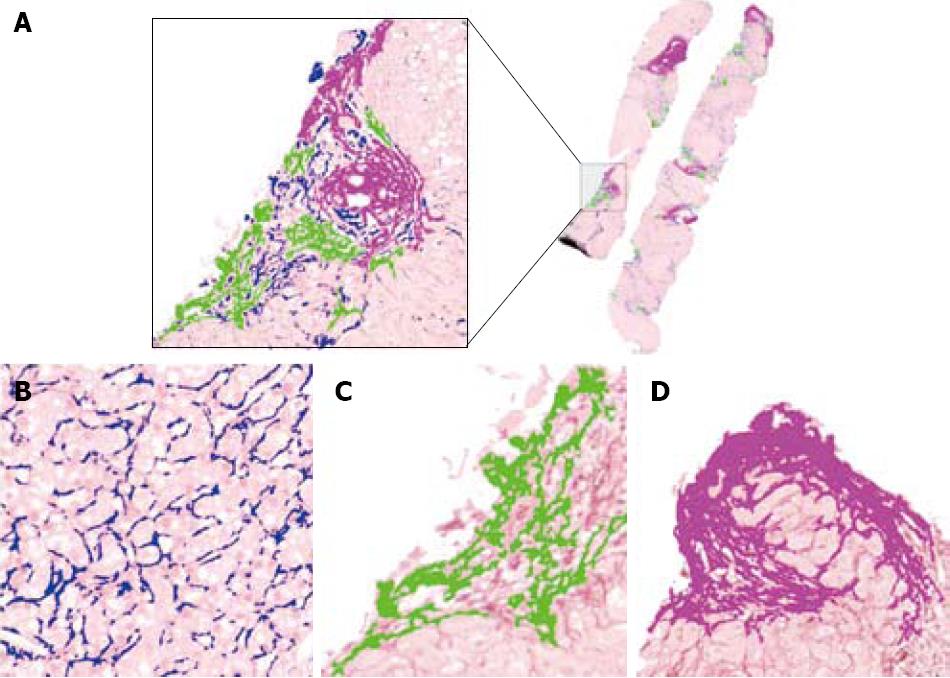
Figure 7 Liver collagen islets mag-nitude (× 10).
A: The Histological Metriser Dioguardi distinguish and highlight with different colours three classes of Sirius-red stained collagen islets; B: islets with magnitudes arbitrarily fixed at 10-103μm2 (colored in blue); C: islets with magnitudes fixed at 103-104μm2 (colored in green); D: islets with magnitudes fixed at and > 104μm2 (coloured in pink).
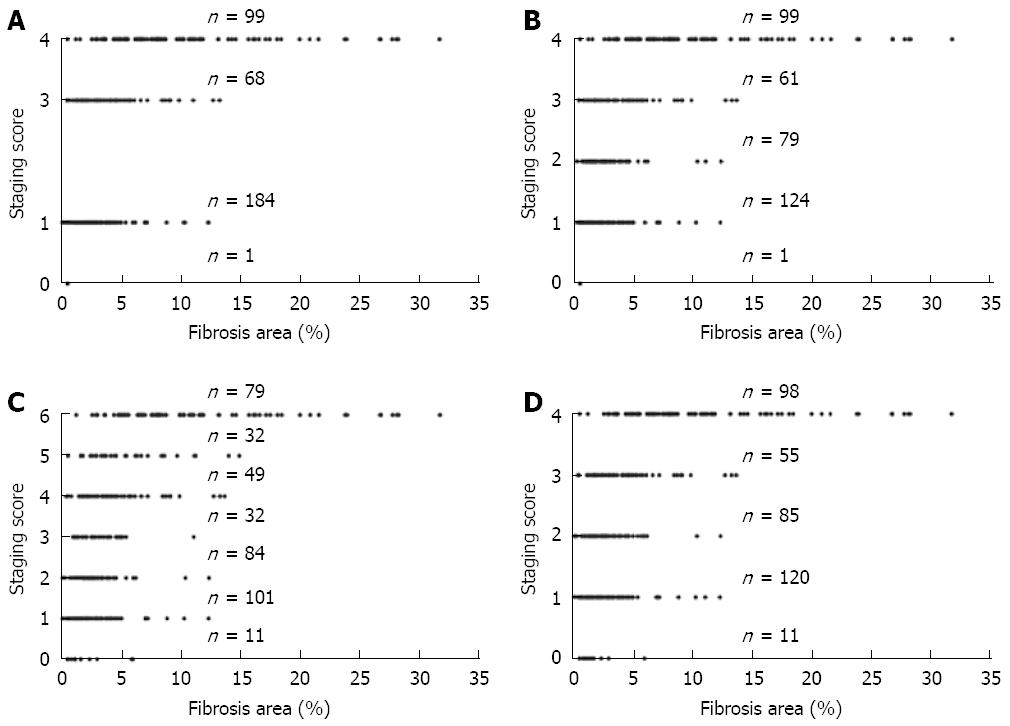
Figure 8 Comparison of the phase portraits obtained using the scalar values of fibrosis (%) calculated from each biopsy section, projected onto the state spaces.
A: Knodell HAI; B: Sheuer; C: Ishak; and D: METAVIR categories (staging). All graphs highlight a considerable overlap of scalar data that corresponds to different categories. Forty-six cases for HAI, 34 for Sheuer, 10 for Ishak and 29 for METAVIR resulted uncertain to be classified in a unique category of severity.
Figure 9 Stad-ging indicates the part of the disease course already covered and the part that remains to be covered before it reaches its end, and is established by placing the value of fibrosis (expressed as a scalar) on the ideal trajectory that indicates the phase of fibrosis at the time of measurement.
AF = fibrosis area (× 10).
- Citation: Dioguardi N, Grizzi F, Fiamengo B, Russo C. Metrically measuring liver biopsy: A chronic hepatitis B and C computer-aided morphologic description. World J Gastroenterol 2008; 14(48): 7335-7344
- URL: https://www.wjgnet.com/1007-9327/full/v14/i48/7335.htm
- DOI: https://dx.doi.org/10.3748/wjg.14.7335


