Copyright
©2008 The WJG Press and Baishideng.
World J Gastroenterol. Dec 21, 2008; 14(47): 7199-7207
Published online Dec 21, 2008. doi: 10.3748/wjg.14.7199
Published online Dec 21, 2008. doi: 10.3748/wjg.14.7199
Figure 1 Over-expression of CCND1 in hepatoma (A), breast cancer (B), and gastric cancer (C).
Figure 2 Over-expression of C-myc in esophageal carcinoma (A), esophageal squamous cell carcinoma (B), and colon cancer (C).
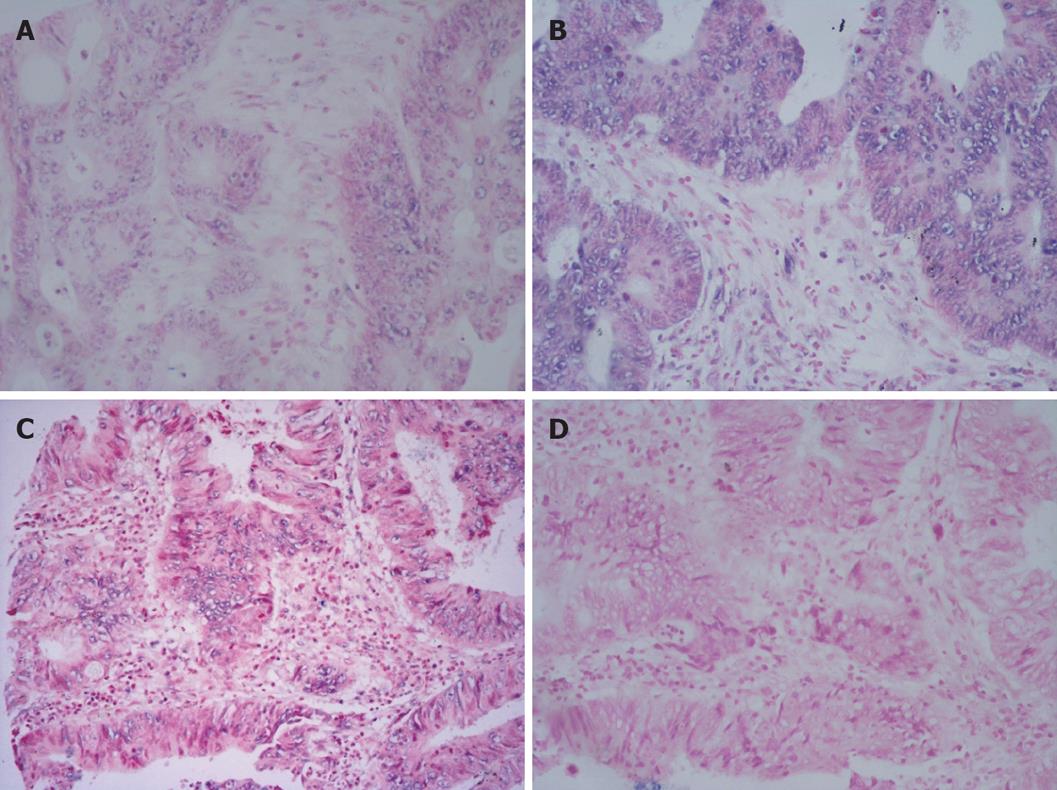
Figure 3 RISH showing expression of CCND1 (A),C-myc (B),Tp53 (C), and negative expression (D) in different tumor tissue samples.
Deparaffinized sections mounted on denhardt-coated glass slides were treated with pepsin for 20, 25 and 30 min, respectively in a 37°C water bath. The treated sections were then processed for in situ hybridization at 4°C, 42°C and 44°C for 36, 41.5 and 48 h, respectively. The hybridization mixture contained 10 ng of the labeled oligonucleotide probe. Post-hybridization, slides were treated with a 1% blocking reagent for 30 min at room temperature and then incubated for 45, 60 and 50 min, respectively, with antidioxigenin alkaline phosphatase conjugated antibodies diluted at 1:500 in TBS. After washed three times for 5 min in TBS, the slides were rinsed in a DAP-buffer and hybridization signals were visualized using NBT/BCIP as substrates (× 200).
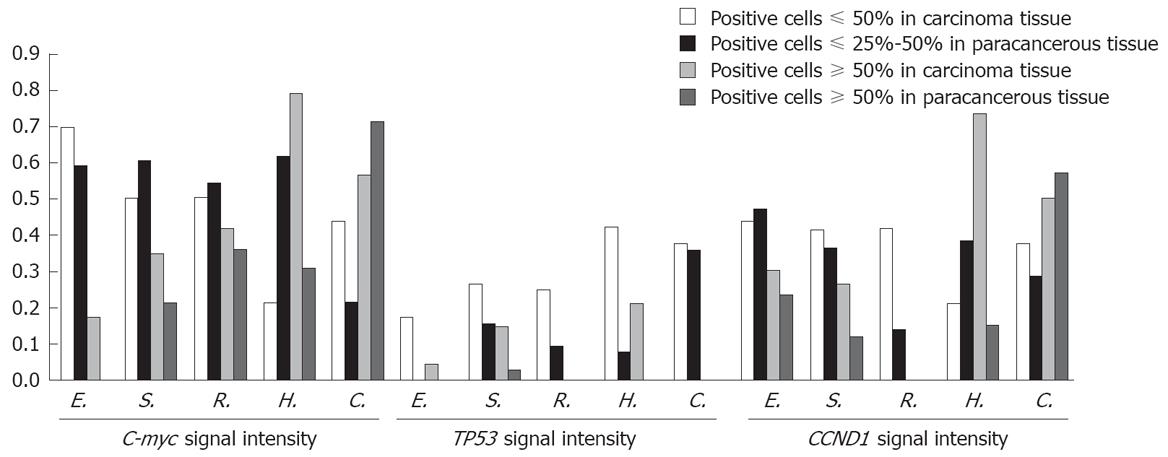
Figure 4 Signal intensity of Tp53, CCND1, and C-myc gene expression in different organs.
E: Esophagus; S: Stomach; R: Rectum; H: Liver; C: Colon.
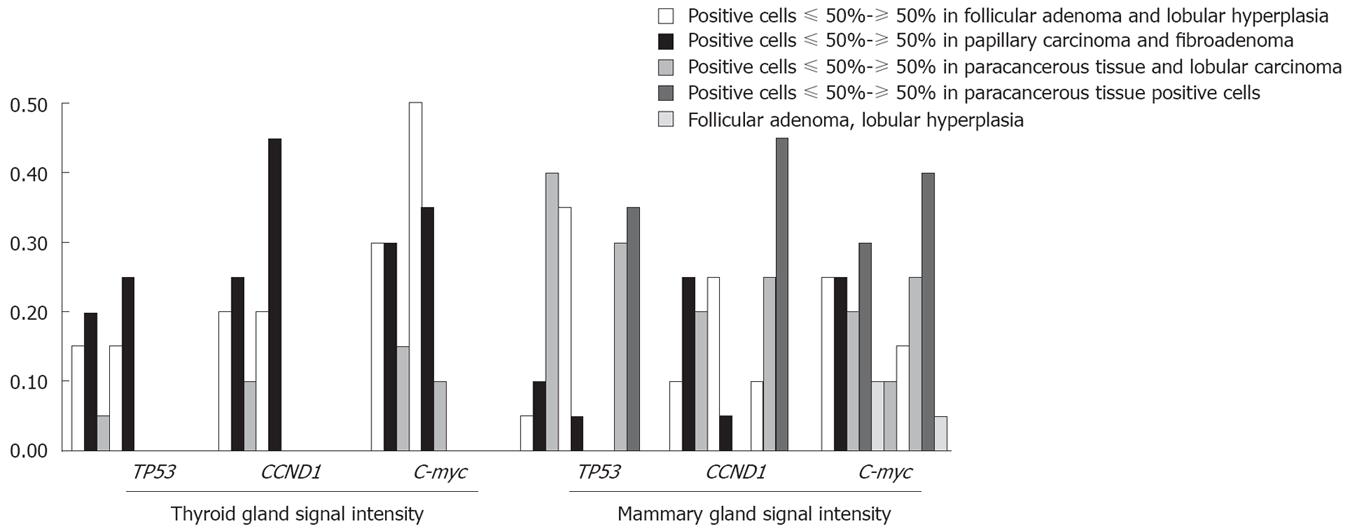
Figure 5 Signal intensity of Tp53, CCND1, and C-myc expression in thyroid gland and mammary gland.
-
Citation: Liu GY, Luo Q, Xiong B, Pan C, Yin P, Liao HF, Zhuang WC, Gao HZ. Tissue array for
Tp53 ,C-myc ,CCND1 gene over-expression in different tumors. World J Gastroenterol 2008; 14(47): 7199-7207 - URL: https://www.wjgnet.com/1007-9327/full/v14/i47/7199.htm
- DOI: https://dx.doi.org/10.3748/wjg.14.7199


