Copyright
©2008 The WJG Press and Baishideng.
World J Gastroenterol. Dec 21, 2008; 14(47): 7183-7191
Published online Dec 21, 2008. doi: 10.3748/wjg.14.7183
Published online Dec 21, 2008. doi: 10.3748/wjg.14.7183
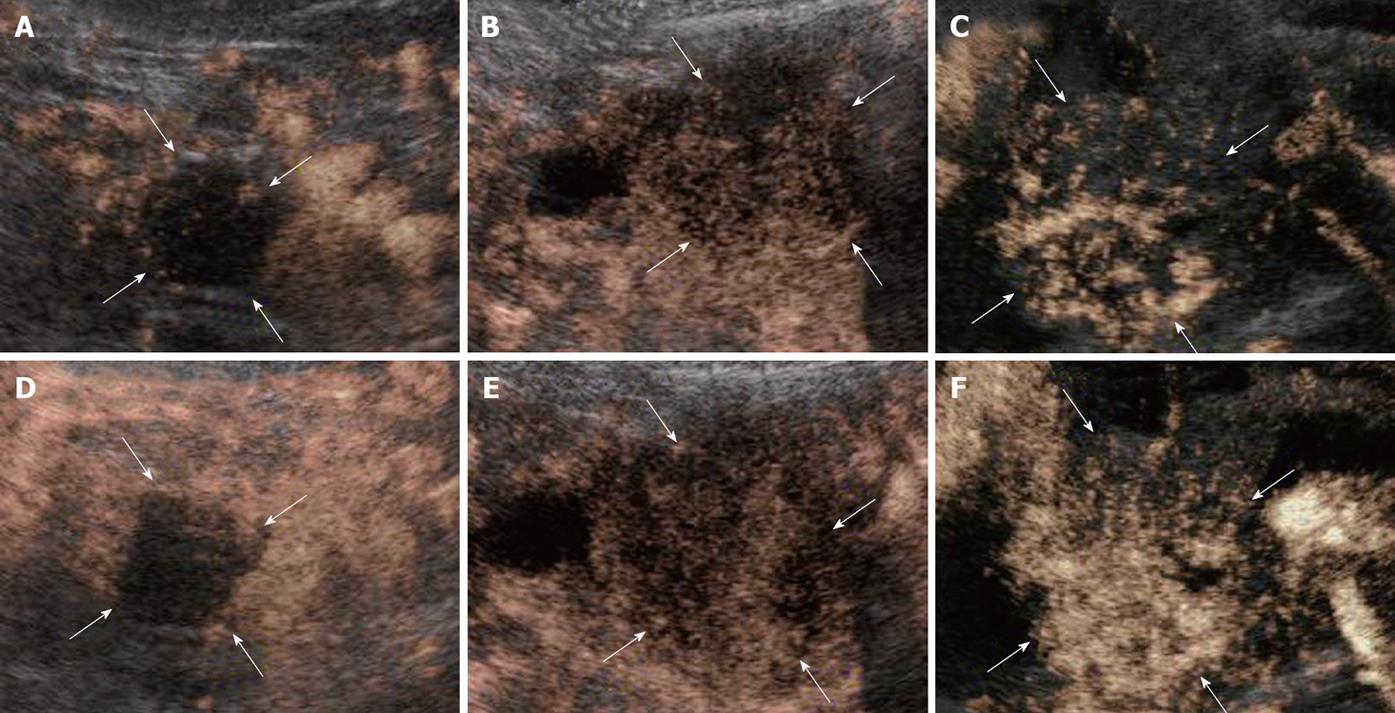
Figure 1 Enhancement pattern of CE-US in pancreatic cancer.
A-C: Vascular image; D-F: Perfusion image; A, D: Hypovascularity; B, E: Isovascularity; C, F: Hypervascularity.
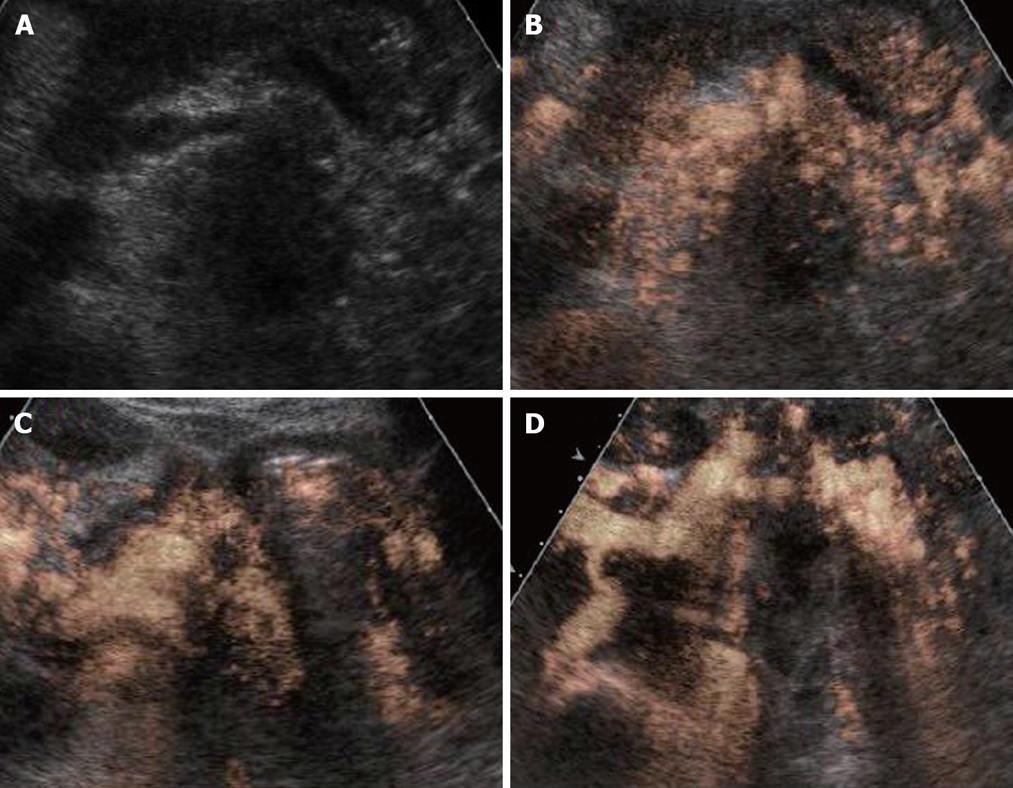
Figure 2 CE-US changes over time in the R (HI) group (luminance score).
A: B-mode; B: Pre (0.30); C: Post 2 course (0.28); D: Post 4 course (0.78); E: Post 7 course (0.62); F: Post 16 course (0.46).
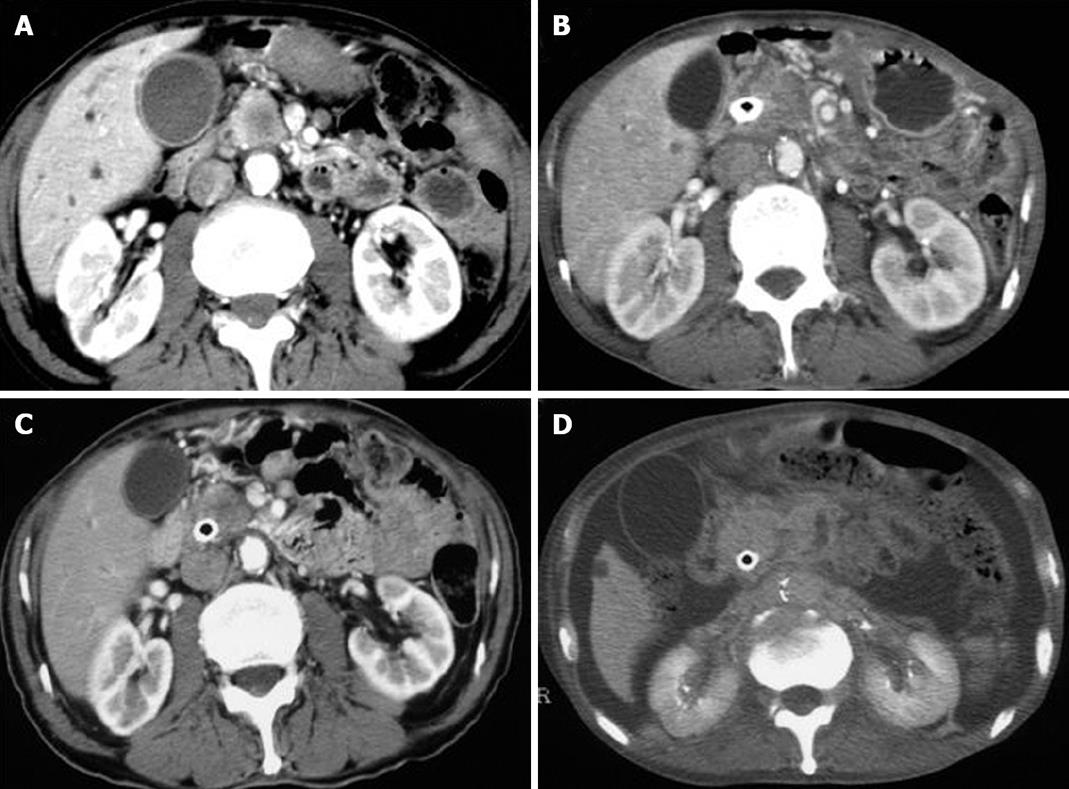
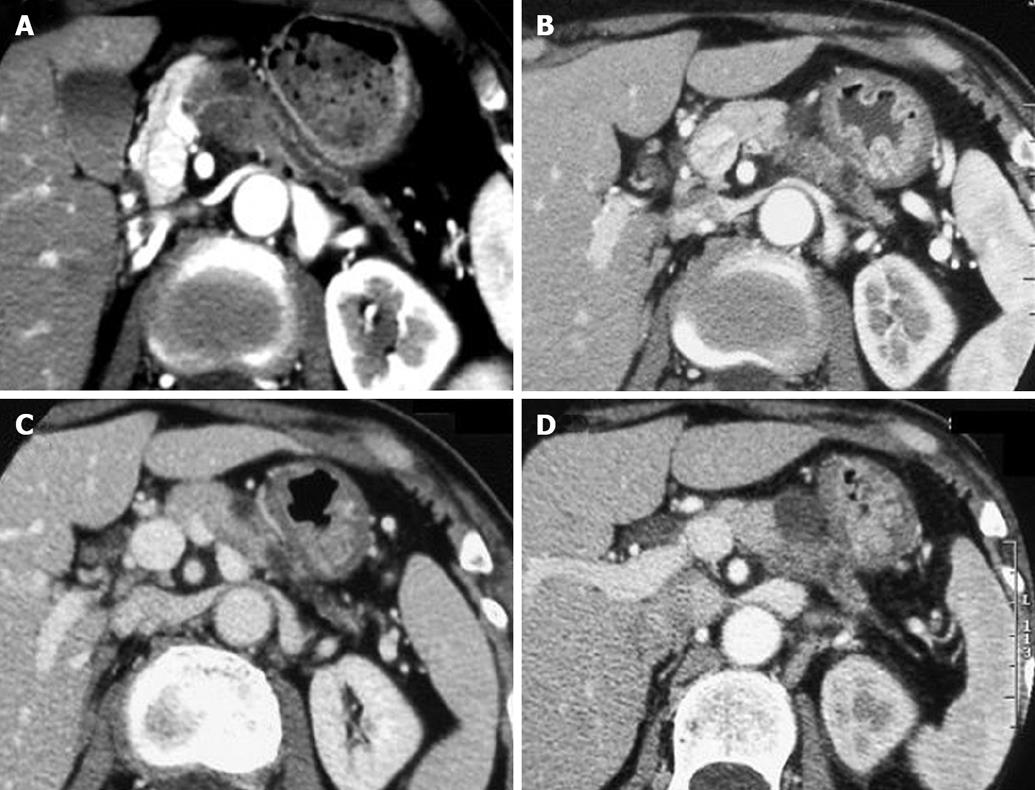
Figure 3 CT changes over time in the R (HH) group.
A: Pre; B: Post 4 course; C: Post 7 course; D: Post 16 course.
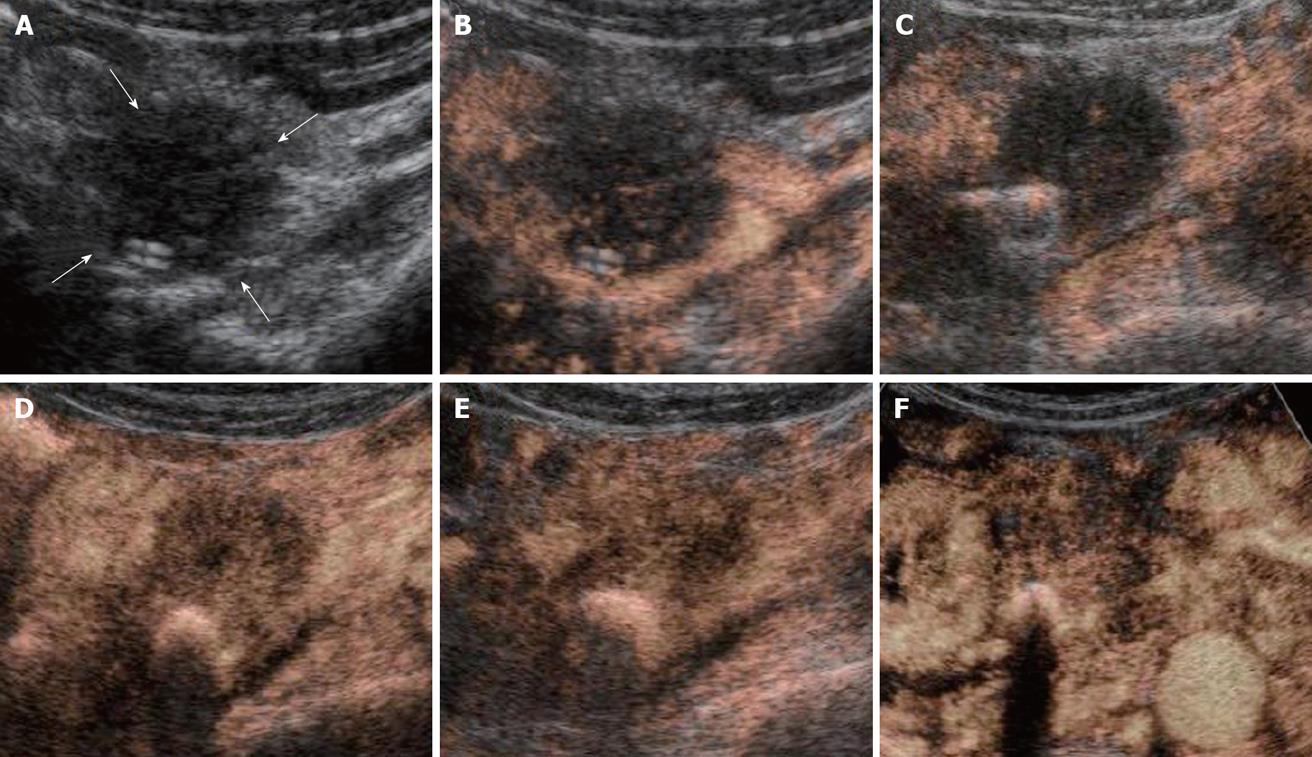
Figure 4 CE-US changes over time in the R (II) group (luminance score).
A: B-mode; B: Pre (0.96); C: Post 2 course (0.99); D: Post 4 course (1.0); E: Post 7 course (0.93); F: Post 11 course (1.0).
Figure 5 CT changes over time in the R (II) group.
A: Pre; B: Post 2 course; C: Post 7 course; D: Post 11 course.
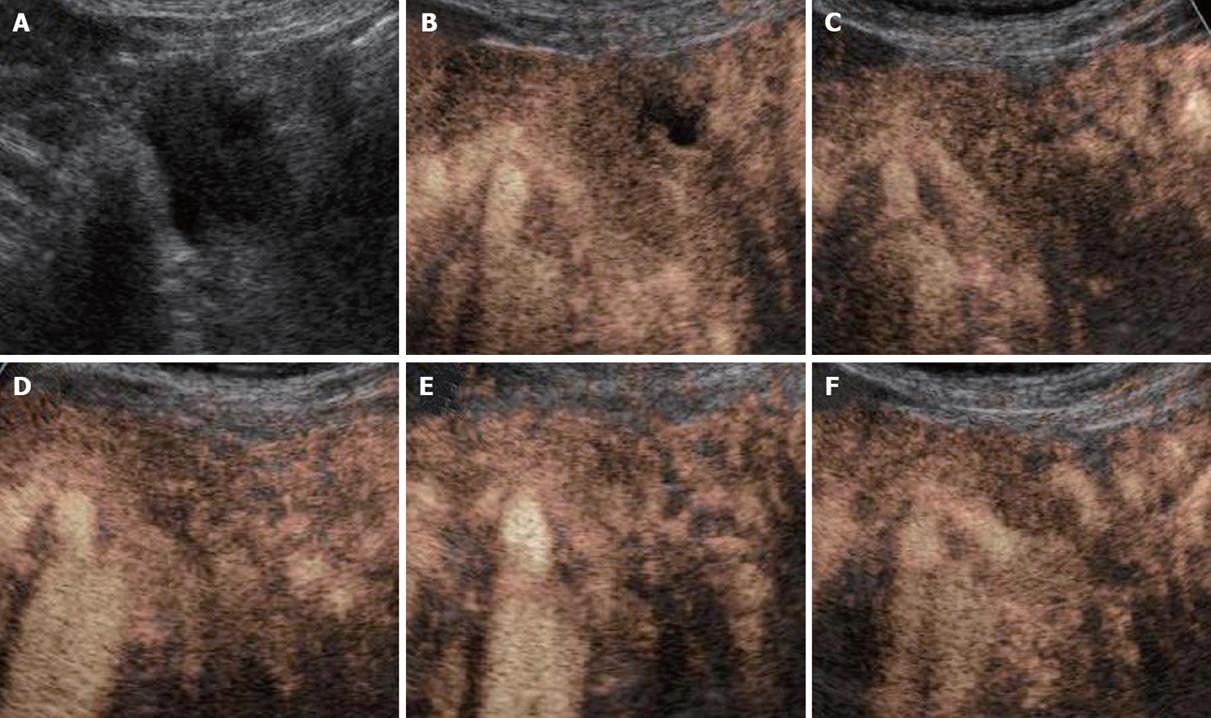
Figure 6 CE-US changes over time in the P (HH) group (luminance score).
A: B-mode; B: Pre (0.29); C: Post 2 course (0.46); D: Post 3 course (0.29).
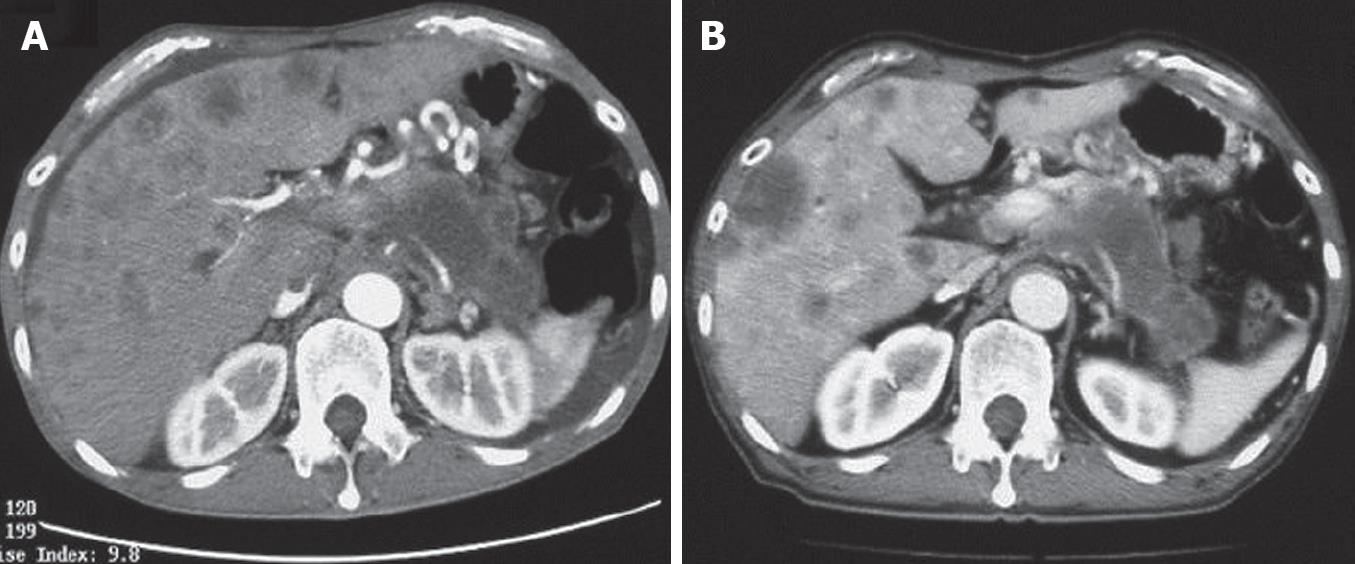
Figure 7 CT changes over time in the P (HH) group.
A: pre; B: post 3 course.
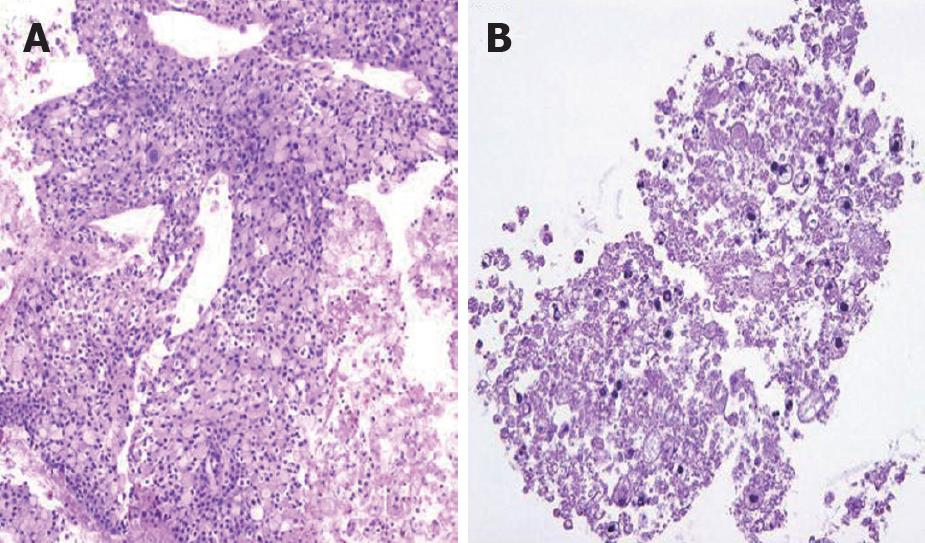
Figure 8 Histological change of post-treatment tissue biopsy pre-chemotherapy (A) and post-chemotherapy (B).
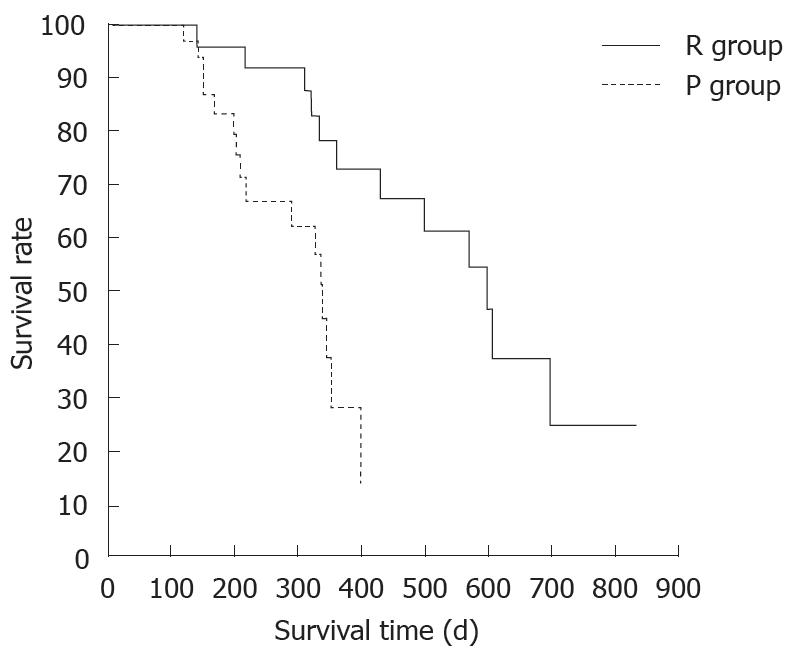
Figure 9 Kaplan-Meier survival curves by enhancement pattern of CE-US and outcome after chemotherapy.
- Citation: Sofuni A, Itoi T, Itokawa F, Tsuchiya T, Kurihara T, Ishii K, Tsuji S, Ikeuchi N, Moriyasu F. Usefulness of contrast-enhanced ultrasonography in determining treatment efficacy and outcome after pancreatic cancer chemotherapy. World J Gastroenterol 2008; 14(47): 7183-7191
- URL: https://www.wjgnet.com/1007-9327/full/v14/i47/7183.htm
- DOI: https://dx.doi.org/10.3748/wjg.14.7183


