Copyright
©2008 The WJG Press and Baishideng.
World J Gastroenterol. Nov 28, 2008; 14(44): 6802-6807
Published online Nov 28, 2008. doi: 10.3748/wjg.14.6802
Published online Nov 28, 2008. doi: 10.3748/wjg.14.6802
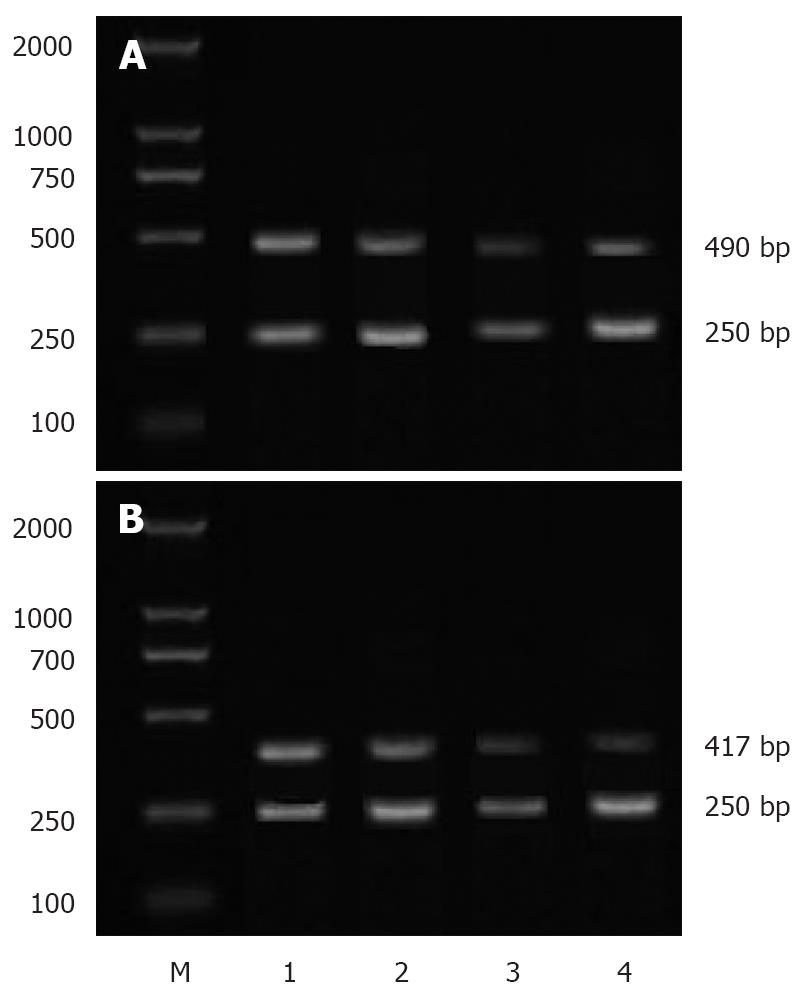
Figure 1 RT-PCR showing expression levels of COX-2 mRNA (A) and VEGF mRNA (B).
M: Marker.
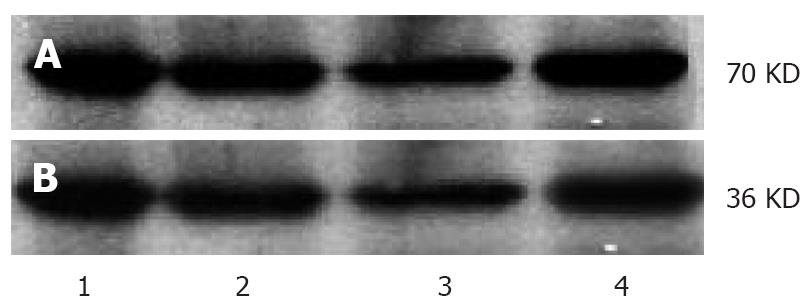
Figure 2 RT-PCR (A) and Western blot (B) showing expression levels of COX-2 and VEGF protein.
1: Control group; 2-4: Groups A, B, and C.
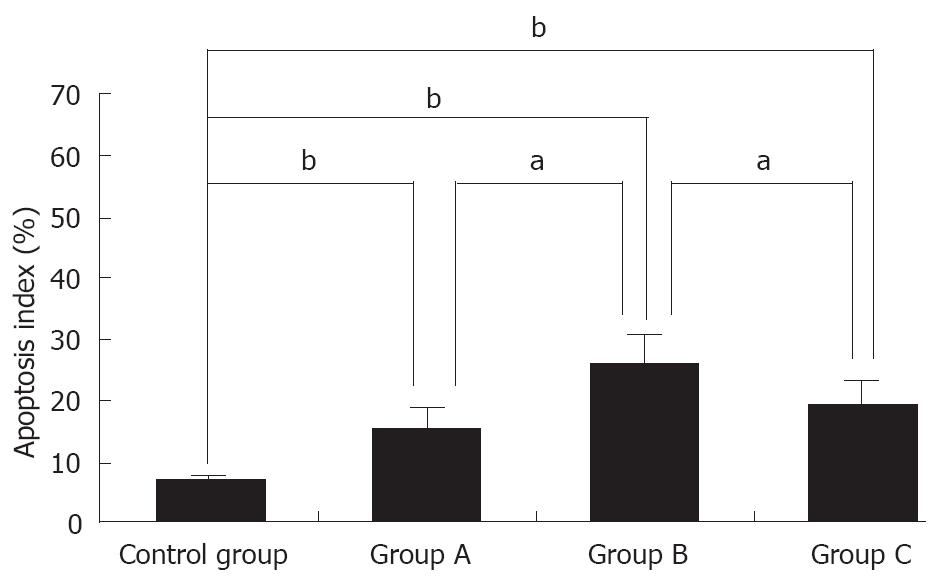
Figure 3 Changes in AI of transplanted HCC cells of nude mice.
aP < 0.05, bP < 0.01 vs groups A and C.
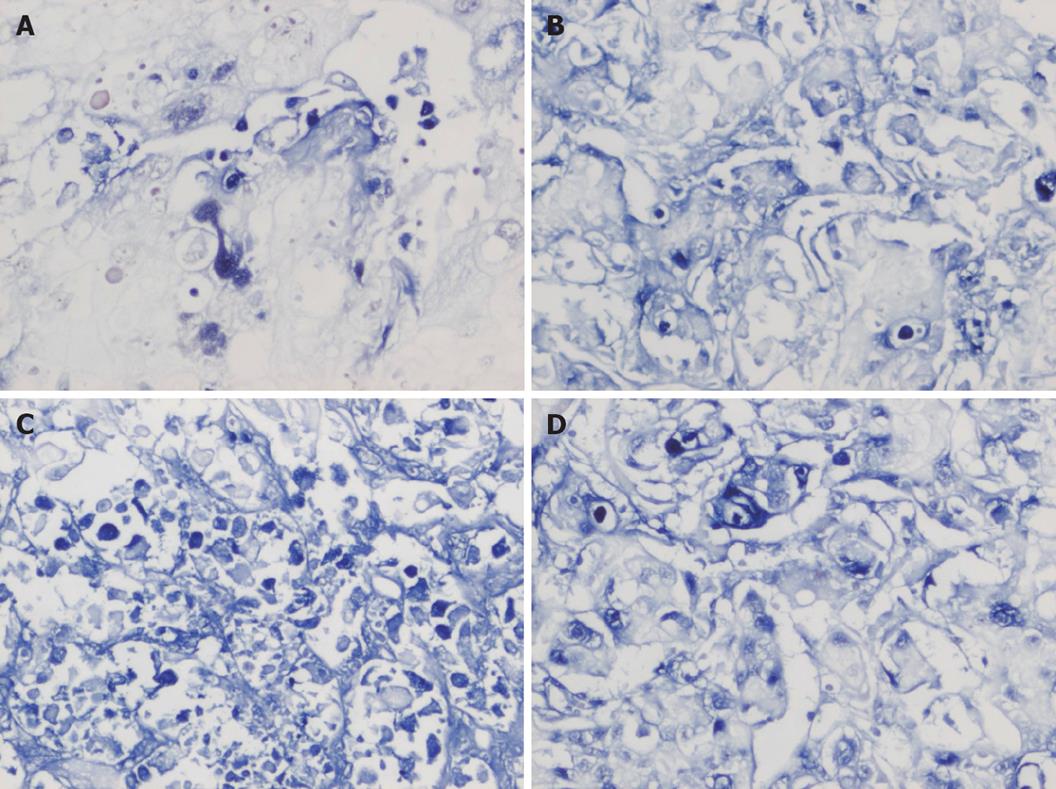
Figure 4 Apoptosis of transplanted HCC (TUNEL × 200).
A: Control group; B: Group A; C: Group B; D: Group C.
- Citation: Cao B, Chen XP, Zhu P, Ding L, Guan J, Shi ZL. Inhibitory effect of interferon-α-2b on expression of cyclooxygenase-2 and vascular endothelial growth factor in human hepatocellular carcinoma inoculated in nude mice. World J Gastroenterol 2008; 14(44): 6802-6807
- URL: https://www.wjgnet.com/1007-9327/full/v14/i44/6802.htm
- DOI: https://dx.doi.org/10.3748/wjg.14.6802


