Copyright
©2008 The WJG Press and Baishideng.
World J Gastroenterol. Nov 21, 2008; 14(43): 6662-6672
Published online Nov 21, 2008. doi: 10.3748/wjg.14.6662
Published online Nov 21, 2008. doi: 10.3748/wjg.14.6662
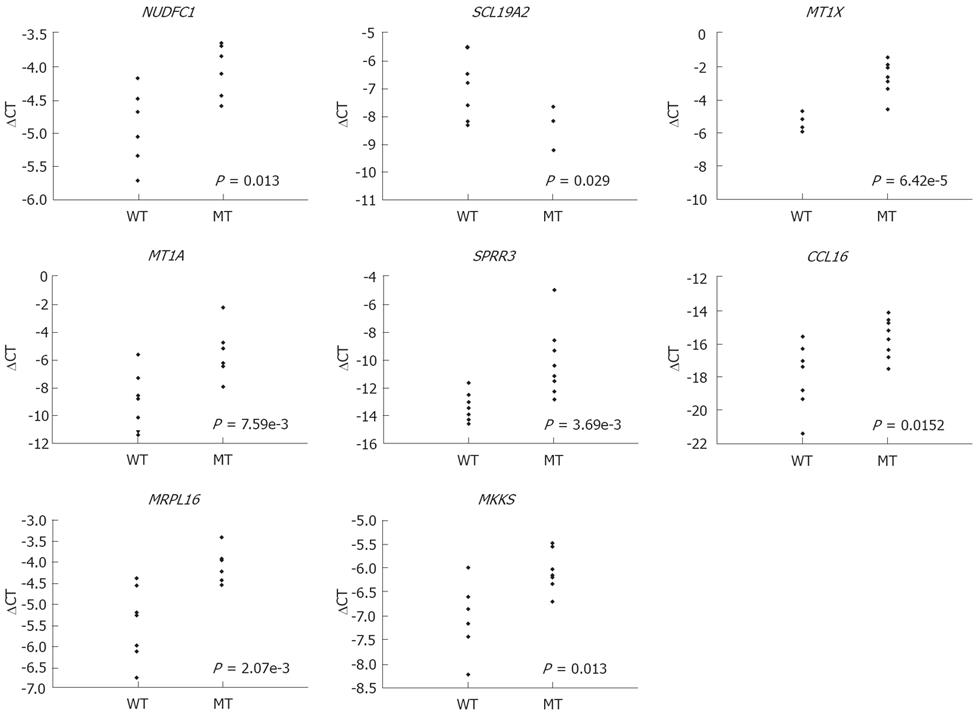
Figure 1 Quantitative RT-PCR of selected genes associated with molecular changes and clinicopathological features from microarray gene expression data.
These were NUDFC1 and SCL19A2 (with APC mutations), MT1X and MT1A (with MMR defects), SPRR3 (with crossover), CCL16 (with lymphovascular or neural invasion), and MRPL16 and MKKS (with synchronous adenoma). Genes differentially expressed between two groups were selected and their expression patterns measured using RT-PCR. WT: Without molecular or clinicopathological changes; MT: Molecular or clinicopathological changes. P-values from unpaired t-tests are shown.
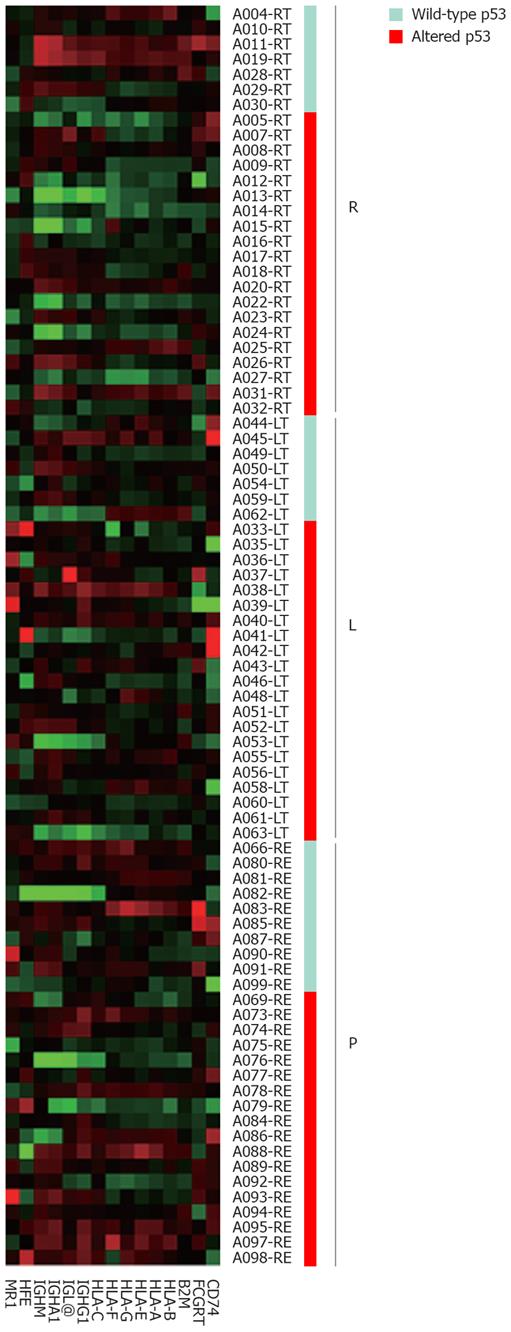
Figure 2 Pattern of expression of genes in the “antigen presentation, endogenous antigen” gene set as distinguished by tumor location and p53 status.
Protein p53 alterations in the ascending colon coordinately decreased the expression of genes in the gene set whereas p53 alterations in the descending colon or rectum had no effect on gene expression. R: Cecum-splenic flexure of transverse colon; L: Splenic flexure of transverse colon-sigmoid colon; P: Rectum.
Figure 3 Accuracy of class prediction increases with tumor location-specific analysis.
Samples were divided into three subgroups corresponding to three tumor locations (right colon, left colon, and rectum). Class prediction was performed using either all samples or samples within each subgroup. For tumor location-specific analysis, the results of class prediction (true or false) from each of the three locations were combined to calculate the overall prediction accuracy. Ten genetic or clinicopathological parameters were analyzed.
- Citation: Kim JC, Kim SY, Roh SA, Cho DH, Kim DD, Kim JH, Kim YS. Gene expression profiling: Canonical molecular changes and clinicopathological features in sporadic colorectal cancers. World J Gastroenterol 2008; 14(43): 6662-6672
- URL: https://www.wjgnet.com/1007-9327/full/v14/i43/6662.htm
- DOI: https://dx.doi.org/10.3748/wjg.14.6662


