Copyright
©2008 The WJG Press and Baishideng.
World J Gastroenterol. Nov 21, 2008; 14(43): 6655-6661
Published online Nov 21, 2008. doi: 10.3748/wjg.14.6655
Published online Nov 21, 2008. doi: 10.3748/wjg.14.6655
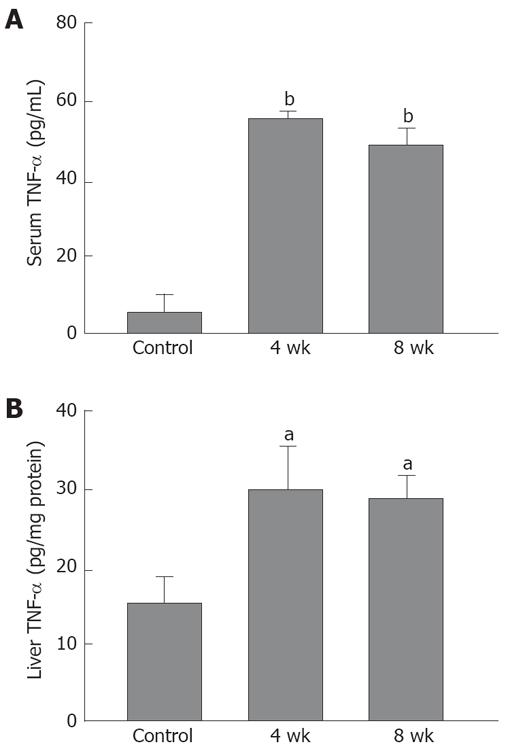
Figure 1 Serum TNF-α levels and liver TNF-α (ELISA method) compared with the control group (n = 5).
A: Serum TNF-α levels were significantly elevated in the livers of the 4- and 8-wk CDAA-fed rats; B: Liver TNF-α was significantly elevated in the livers of the 4- and 8-wk CDAA-fed rats. aP < 0.05 vs the control; bP < 0.01 vs the control.
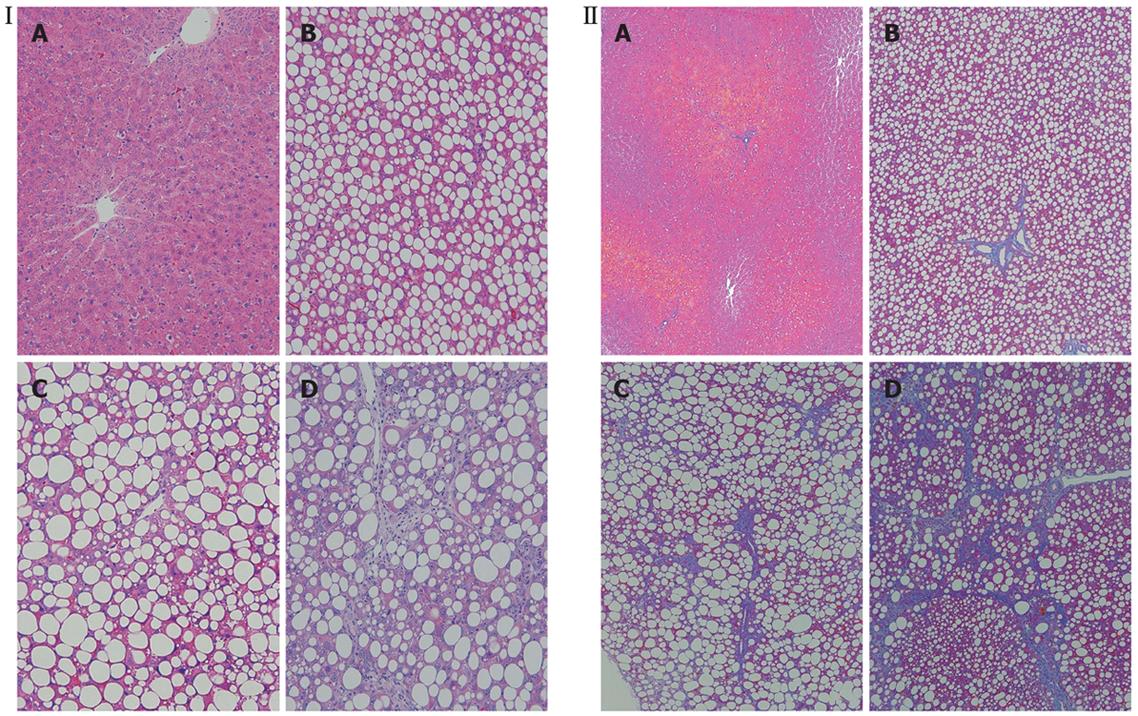
Figure 2 Inflammation and fibrosis in the rat liver.
I: HE, × 200; II: Azan, × 100. A: Control rat; B: 1-wk CDAA-fed rat; C: 4-wk CDAA-fed rat; D: 8-wk CDAA-fed rat.
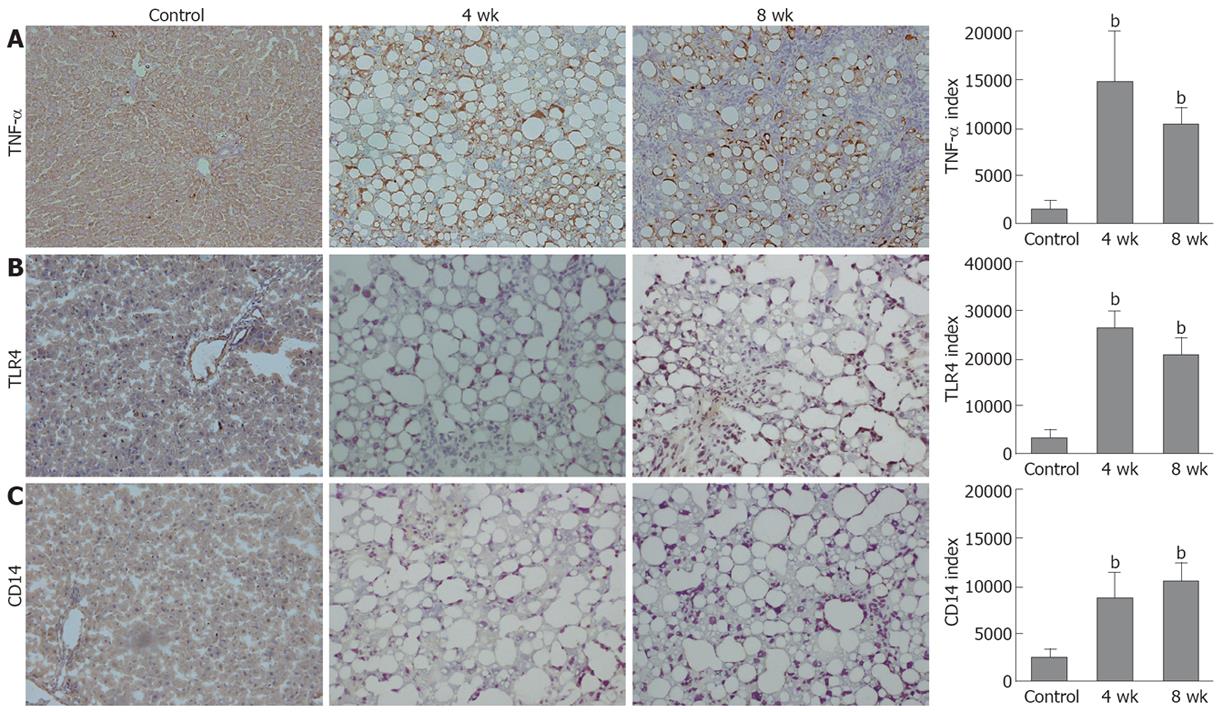
Figure 3 Immunohistochemical staining and semiquantification in the rat liver (× 200).
A: For TNF-α; B: For TLR4; C: For CD14. bP < 0.01 vs the control.
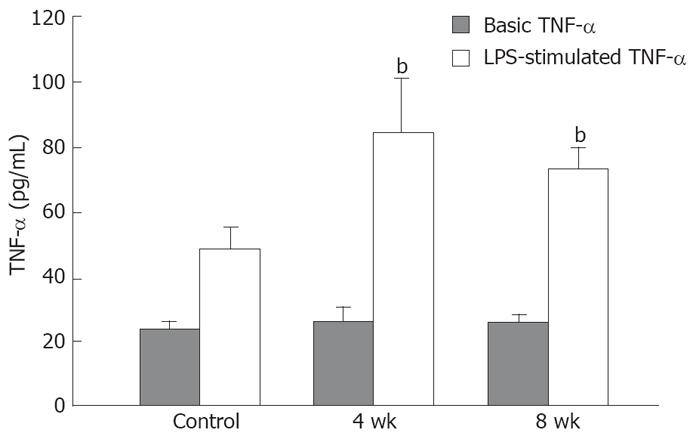
Figure 4 TNF-α production of Kupffer cells in vitro.
The basic TNF-α production of Kupffer cells isolated from 4- and 8-wk CDAA-fed rats was equal to that of the control rats. After LPS stimulation, the TNF-α production of the control rats was significantly higher than the basic control levels, and that of the 4- and 8-wk CDAA-fed rats was significantly higher than that of the control rats. bP < 0.01 vs the control.
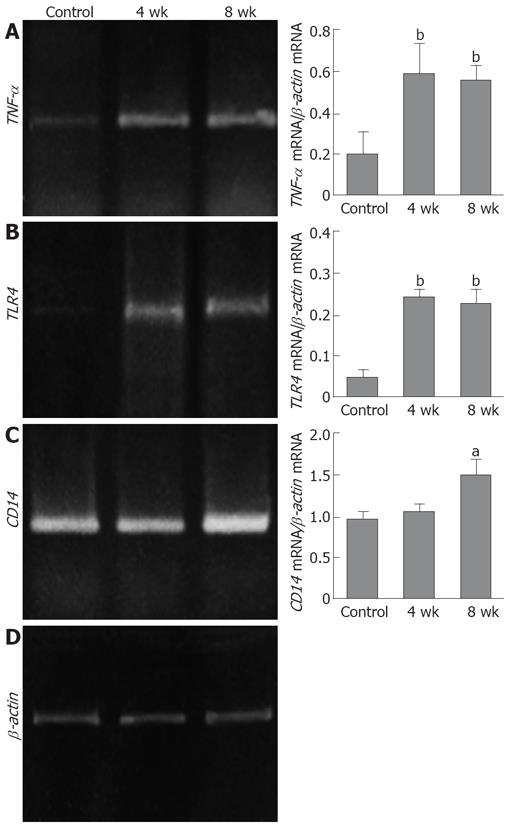
Figure 5 RT-PCR and semiquantification (n = 5).
A: TNF-α mRNA; B: TLR4 mRNA; C: CD14 mRNA; D: β-actin mRNA. aP < 0.05 vs the control, bP < 0.01 vs the control.
- Citation: Kawaratani H, Tsujimoto T, Kitazawa T, Kitade M, Yoshiji H, Uemura M, Fukui H. Innate immune reactivity of the liver in rats fed a choline-deficient L-amino-acid-defined diet. World J Gastroenterol 2008; 14(43): 6655-6661
- URL: https://www.wjgnet.com/1007-9327/full/v14/i43/6655.htm
- DOI: https://dx.doi.org/10.3748/wjg.14.6655


