Copyright
©2008 The WJG Press and Baishideng.
World J Gastroenterol. Nov 14, 2008; 14(42): 6488-6495
Published online Nov 14, 2008. doi: 10.3748/wjg.14.6488
Published online Nov 14, 2008. doi: 10.3748/wjg.14.6488
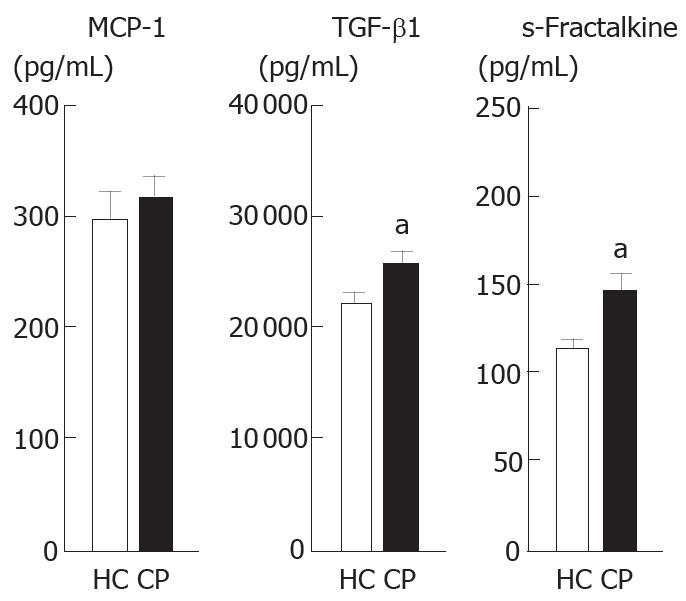
Figure 1 Serum MCP-1, TGF-β1, and s-fractalkine concentrations in patients with CP.
Serum MCP-1, TGF-β1, and s-fractalkine concentrations were measured by ELISA for each pancreatic disease. Healthy control (HC, n = 116) and chronic pancreatitis (CP, n = 109). Bars represent the mean ± SD. aP < 0.05 vs healthy control.
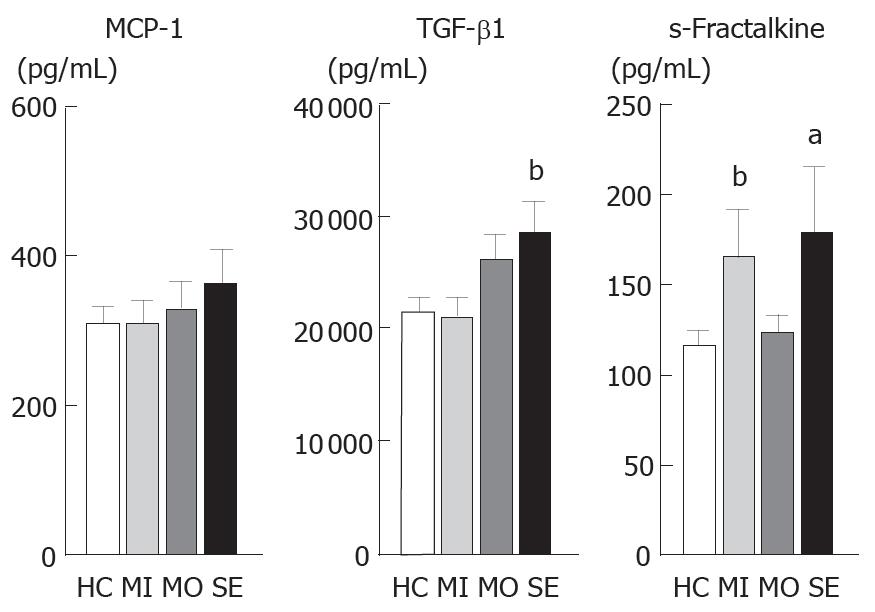
Figure 2 Serum MCP-1, TGF-β1, and s-fractalkine concentrations with regard to severity of CP.
Serum MCP-1, TGF-β1, and s-fractalkine concentrations were measured by ELISA for each stage of severity. Healthy control (HC, n = 116), mild severity (MI, n = 36), moderate severity (MO, n = 49), and severe (SE, n = 24). Bars represent the mean ± SD. aP < 0.05 vs healthy control, bP < 0.01 vs healthy control.
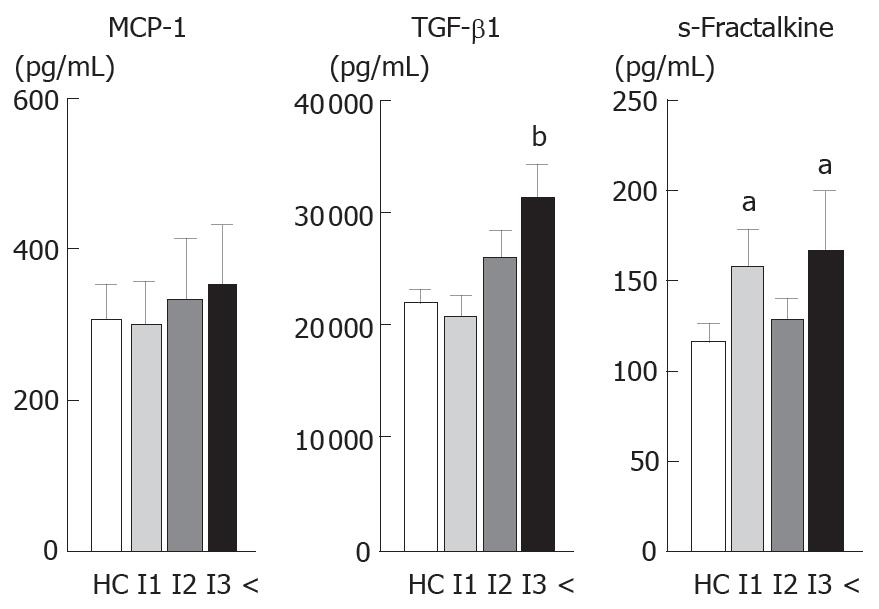
Figure 3 Serum MCP-1, TGF-β1, and s-fractalkine concentrations for each score of imaging tests in CP patients.
Serum MCP-1, TGF-β1, and s-fractalkine concentrations were measured by ELISA for each score for pancreatic imaging tests. Healthy control (HC, n = 116), score 1 on pancreatic imaging tests (I1, n = 47), score 2 on pancreatic imaging tests (I2, n = 33) and score ≥ 3 on pancreatic imaging tests (> I3, n = 29). Bars represent the mean ± SD. aP < 0.05 vs healthy control, bP < 0.01 vs healthy control.
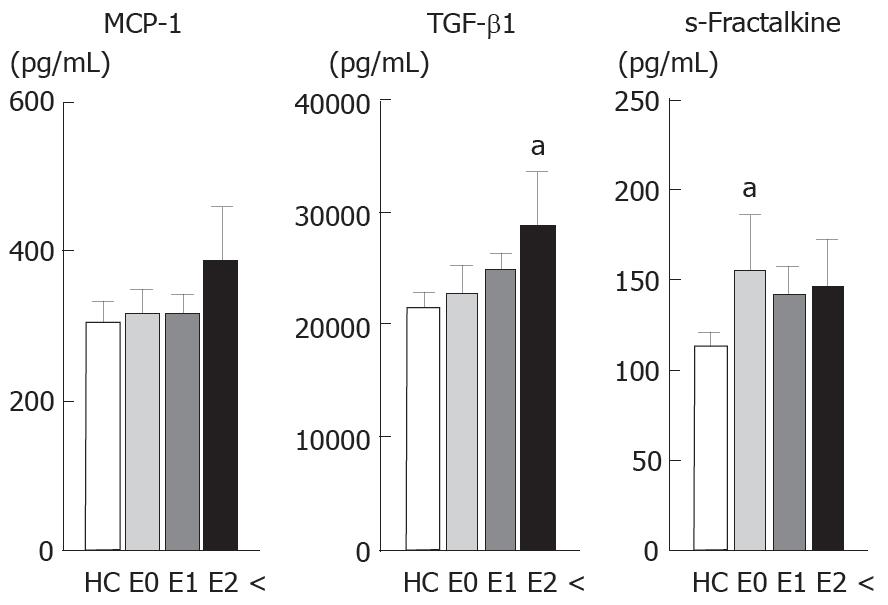
Figure 4 Serum MCP-1, TGF-β1, and s-fractalkine concentrations for each score for the exocrine function tests in CP patients.
Serum MCP-1, TGF-β1, and s-fractalkine concentrations were measured by ELISA for each score for the exocrine function. Healthy control (HC, n = 116), score 0 for exocrine function (E0, n = 31), score 1 for exocrine function (E1, n = 66) and score > 2 for exocrine function (> E2, n = 12). Bars represent the mean ± SD. aP < 0.05 vs healthy control.
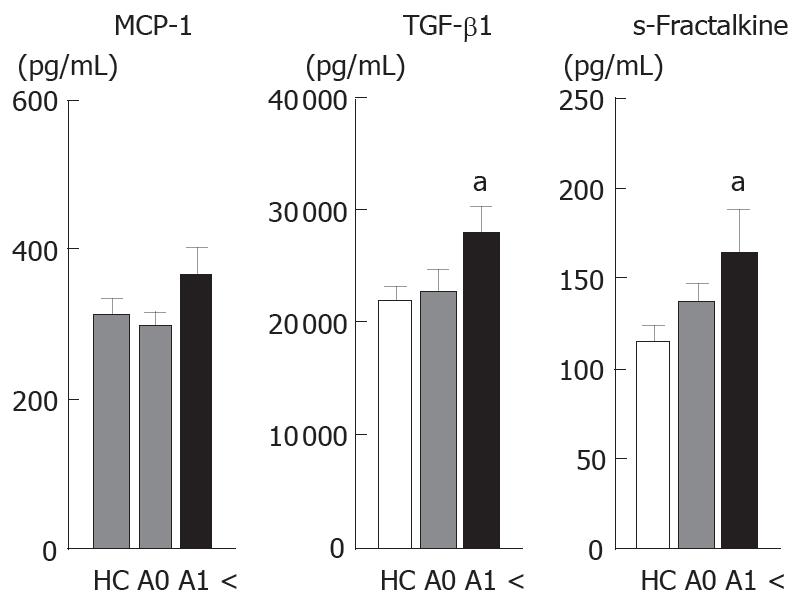
Figure 5 Serum MCP-1, TGF-β1, and s-fractalkine concentrations in relation to alcohol intake in CP patients.
Serum MCP-1, TGF-β1, and s-fractalkine concentrations were measured by ELISA for each score for alcohol intake. Healthy control (HC, n = 116), score 0 for score of alcohol intake (A0, n = 57) and score > 1 for score of alcohol intake (> A1, n = 52). Bars represent the mean ± SD. aP < 0.05 vs healthy control.
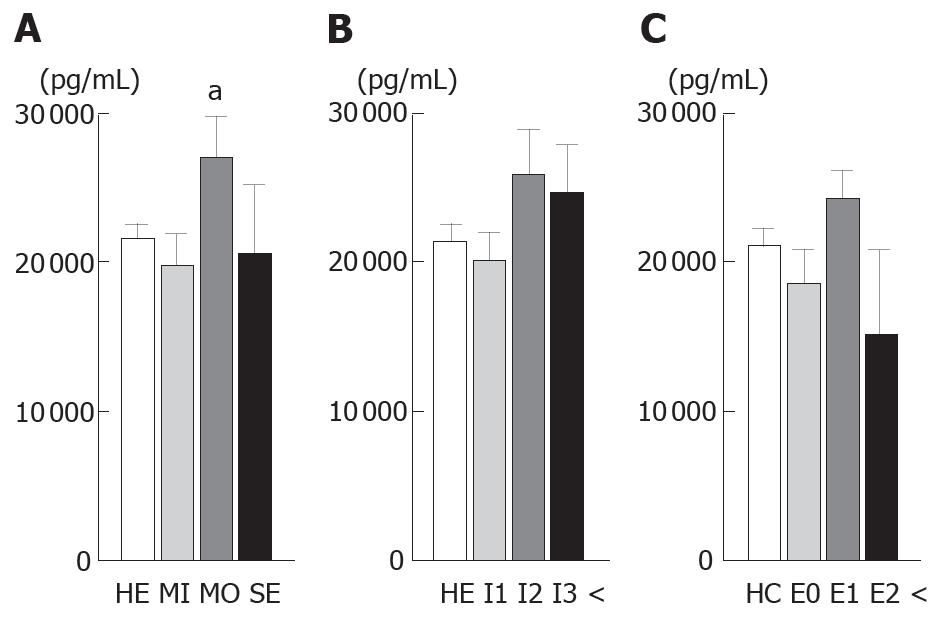
Figure 6 Serum TGF-β1 concentrations in non-alcoholic CP for each factor.
Serum TGF-β1 concentrations were measured in patients with non-alcoholic CP (n = 57) by ELISA. A: Serum TGF-β1 concentrations for each stage of severity: Healthy control (HE, n = 116), mild severity (MI, n = 33), moderate severity (MO, n = 19) and severe (SE, n = 5); B: Serum TGF-β1 concentrations for each imaging test score: Healthy control (HE, n = 116), score 1 for imaging tests score (I1, n = 33), score 2 for imaging tests score (I2, n = 15) and score < 3 for imaging tests score (< I3, n = 9); C: Serum TGF-β1 concentrations for each score for exocrine function. Healthy control (HC, n = 116), score 0 for exocrine function (E0, n = 16), score 1 for exocrine function (E1, n = 37) and score > 2 for exocrine function (> E2, n = 4). Bars represent the mean ± SD. aP < 0.05 vs healthy control.
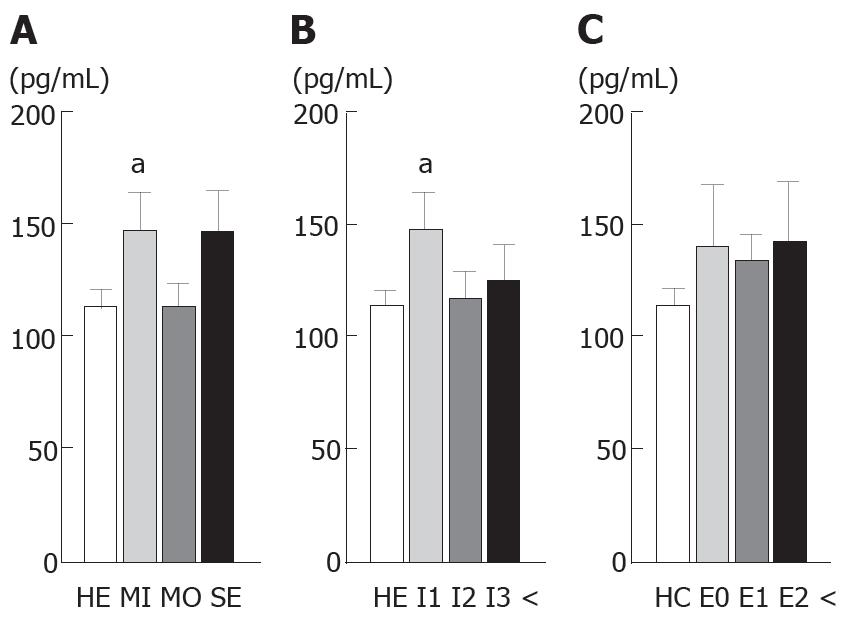
Figure 7 Serum s-fractalkine concentrations in non-alcoholic CP for each factor.
Serum s-fractalkine concentrations were measured for patients with non-alcoholic CP (n = 57) by ELISA. A: Serum s-fractalkine concentrations were measured by ELISA for each stage of severity: Healthy control (HE, n = 116), mild severity (MI, n = 33), moderate severity (MO, n = 19) and severe (SE, n = 5); B: Serum s-fractalkine concentrations were measured by ELISA for each imaging tests score. Healthy control (HE, n = 116), score 1 for imaging tests score (I1, n = 33), score 2 for imaging tests score (I2, n = 15), and score < 3 for imaging tests score (< I3, n = 9); C: Serum s-fractalkine concentrations for each score of exocrine function. Healthy control (HC, n=116), score 0 for exocrine function (E0, n = 16), score 1 for exocrine function (E1, n = 37) and score > 2 for exocrine function (> E2, n = 4). Bars represent the mean ± SD. aP < 0.05 vs healthy control.
- Citation: Yasuda M, Ito T, Oono T, Kawabe K, Kaku T, Igarashi H, Nakamura T, Takayanagi R. Fractalkine and TGF-β1 levels reflect the severity of chronic pancreatitis in humans. World J Gastroenterol 2008; 14(42): 6488-6495
- URL: https://www.wjgnet.com/1007-9327/full/v14/i42/6488.htm
- DOI: https://dx.doi.org/10.3748/wjg.14.6488


