Copyright
©2008 The WJG Press and Baishideng.
World J Gastroenterol. Nov 14, 2008; 14(42): 6473-6480
Published online Nov 14, 2008. doi: 10.3748/wjg.14.6473
Published online Nov 14, 2008. doi: 10.3748/wjg.14.6473
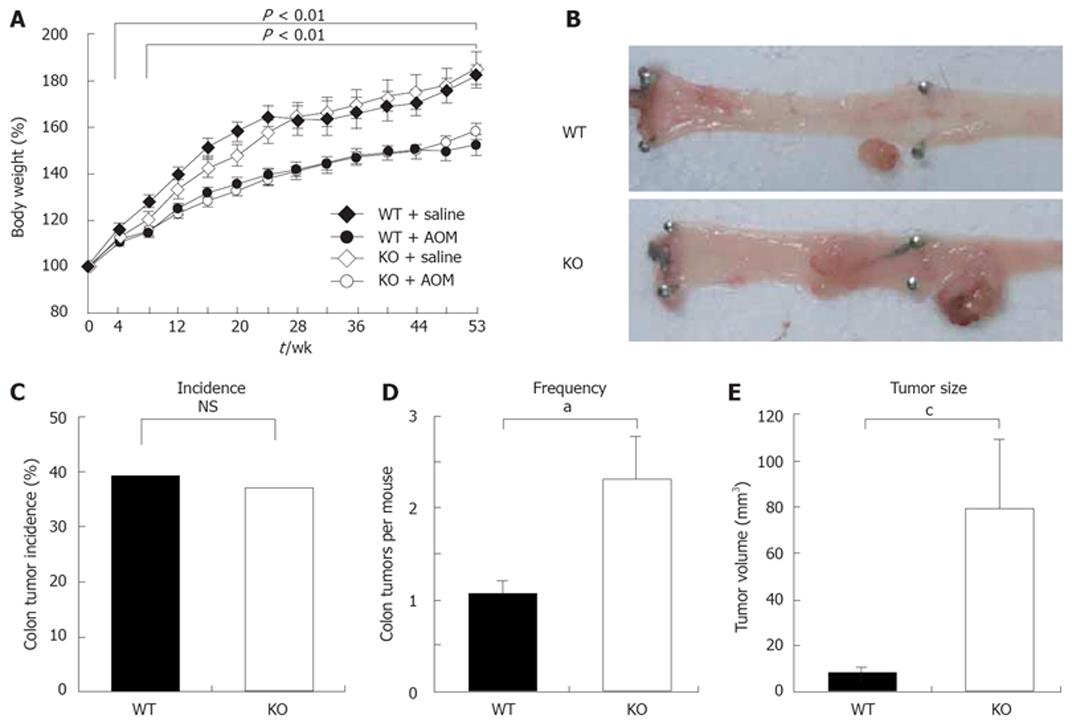
Figure 1 Enhanced AOM-induced colorectal carcinogenesis in KO mice.
A: Changes in percentage of body weight. P < 0.01, between WT + saline (n = 9) and WT + AOM (n = 23). P < 0.001, between KO + saline (n = 13) and KO + AOM (n = 24); B: Representative pictures of the colorectal tumors arising in WT and KO mice after AOM treatment; C: Tumor incidence is expressed as the ratio of mice with tumor/total number of mice (NS: Not statistically significant; χ2 test); D: Tumor frequency. WT, n = 9; KO, n = 9 (aP < 0.05, Student’s t-test); E: Tumor size. WT, n = 9; KO, n = 19 (cP < 0.05, Student’s t-test). Results are presented as mean ± SE.
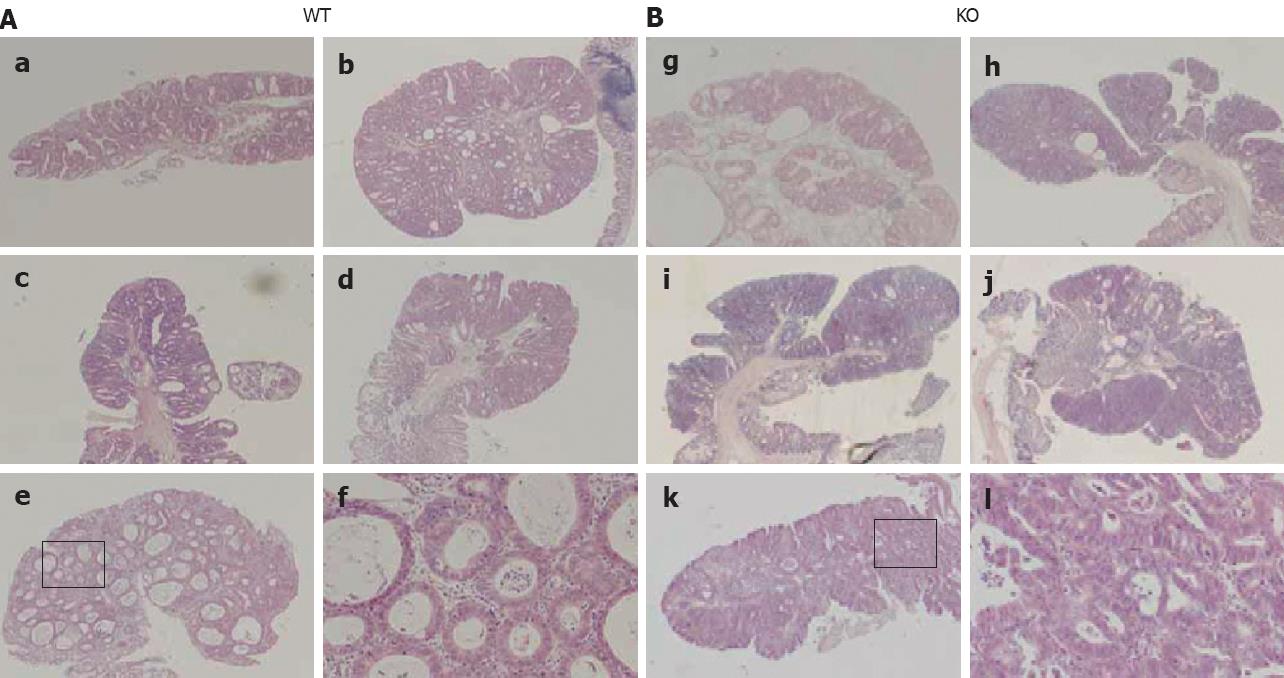
Figure 2 Histological analysis of colorectal tumors induced by AOM.
Representative HE-stained sections of colon tumors in WT mice (A): a: Adenoma; b, c, e: Carcinomas in situ; d: Adenocarcinoma; f: Boxed area in e is shown at a higher magnification. Representative HE-stained sections of colorectal tumors in KO mice (B). All tumors in KO mice showed features of adenocarcinoma: l: Boxed area in k is shown at a higher magnification. Original magnification: × 20 for b, c, d, h, i, j; × 40 for a, e, g, k; and × 200 for f and l.
Figure 3 PCNA overexpression in colorectal tumor cells of KO mice.
Immunohistochemical staining for PCNA in colorectal tumors using rat anti-mouse PCNA monoclonal antibody. Cells with strongly stained nuclei were considered positive for PCNA. A: Representative section of a colorectal tumor in a WT mouse and a KO mouse (× 200); B: PCNA labeling index in colorectal tumors. WT mice (n = 9), KO mice (n = 11) (bP < 0.01, Student’s t-test). Results are mean ± SE.
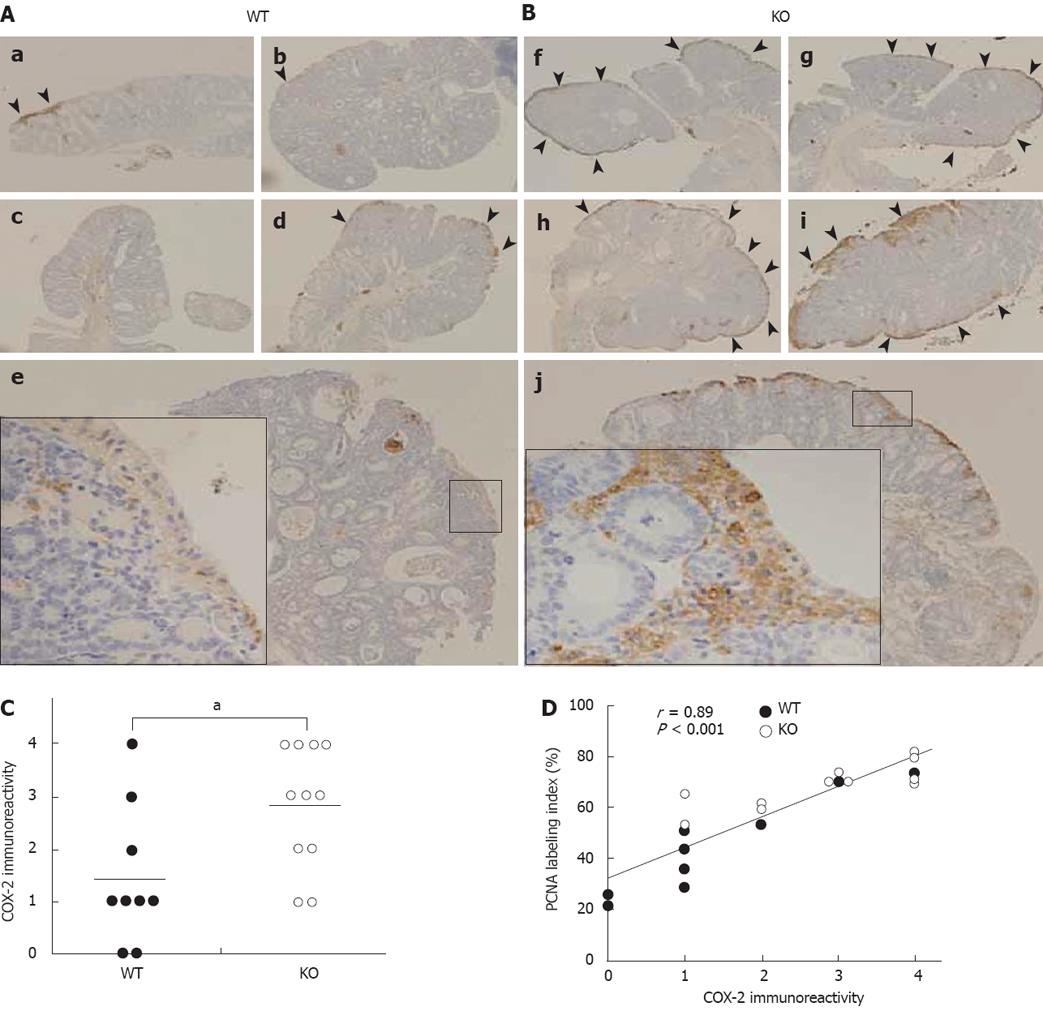
Figure 4 COX-2 overexpression in colorectal tumors of KO mice.
Immunohistochemical staining for COX-2 in colorectal tumors using rabbit anti-mouse COX-2 polyclonal antibody. Immunoreactive COX-2 expression is observed in the epithelium and periluminal stromal cells of the tumors (Arrowheads). A: Representative sections of colorectal tumors in WT mice: e: Boxed area is shown at a higher magnification; B: Representative sections of colorectal tumors in KO mice: j: Boxed area is shown at a higher magnification. Original magnification: × 20 for b, c, d, f, g, h; × 40 for a, e, i, j; × 200 for the boxed area in e and j. C: Statistical analysis of immunoreactive COX-2 expression in colorectal tumors. COX-2 expression was higher in colorectal tumors of KO mice (n = 11) compared with WT mice (n = 9; aP < 0.05, Wilcoxon rank sum test). Horizontal lines: mean value of COX-2 immunoreactivity in colorectal tumors of WT or KO mice. D: Significant correlation between COX-2 immunoreactivity and PCNA-labeling index in colorectal tumors (r = 0.89, P < 0.001, Spearman’s rank correlation). WT mice (n = 9), KO mice (n = 11).
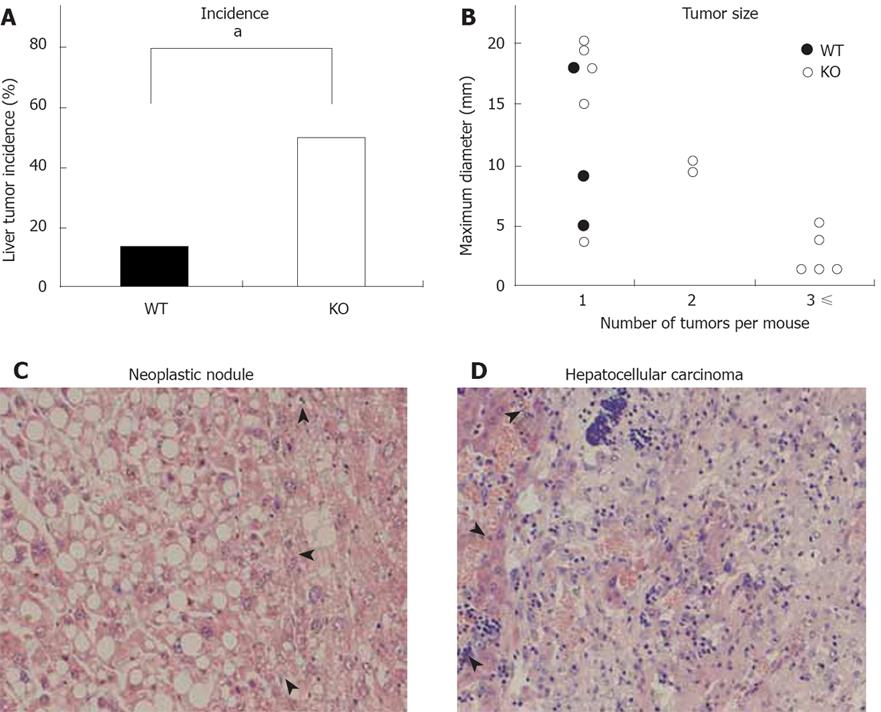
Figure 5 Enhanced AOM-induced liver tumor formations in KO mice.
A: Tumor incidence is expressed as the ratio of mice with tumor/total number of mice (aP < 0.05; Fisher’s exact probability test); B: Tumor size is evaluated by its maximum diameter. Mice were divided into three groups according to the number of tumors per mouse. Maximum diameter of the tumors is plotted individually in each group. WT mice (n = 3), KO mice (n = 12). C and D: Representative HE-stained sections liver tumors in KO mice (× 200). Arrowheads indicate liver tumors. C: Neoplastic nodule; D: Hepatocellular carcinoma.
- Citation: Nishihara T, Baba M, Matsuda M, Inoue M, Nishizawa Y, Fukuhara A, Araki H, Kihara S, Funahashi T, Tamura S, Hayashi N, Iishi H, Shimomura I. Adiponectin deficiency enhances colorectal carcinogenesis and liver tumor formation induced by azoxymethane in mice. World J Gastroenterol 2008; 14(42): 6473-6480
- URL: https://www.wjgnet.com/1007-9327/full/v14/i42/6473.htm
- DOI: https://dx.doi.org/10.3748/wjg.14.6473


