Copyright
©2008 The WJG Press and Baishideng.
World J Gastroenterol. Nov 14, 2008; 14(42): 6444-6452
Published online Nov 14, 2008. doi: 10.3748/wjg.14.6444
Published online Nov 14, 2008. doi: 10.3748/wjg.14.6444
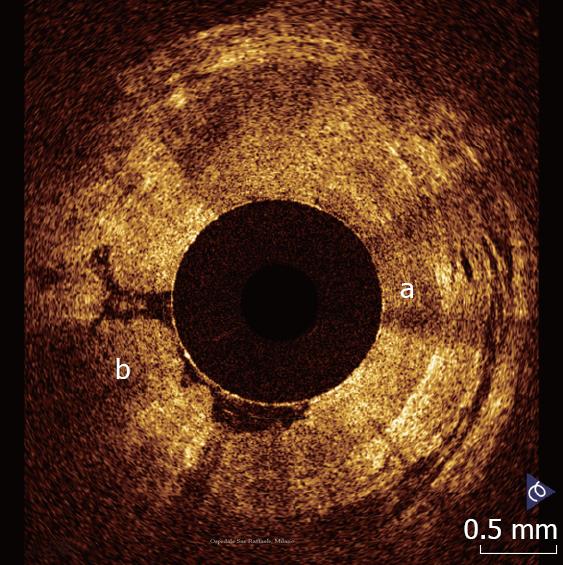
Figure 1 OCT pattern of squamo-columnar junction.
The horizontal, layered architecture of the esophageal wall (a) appears clearly distinguishable from the vertical crypt-and-pit architecture of the gastric wall (b).
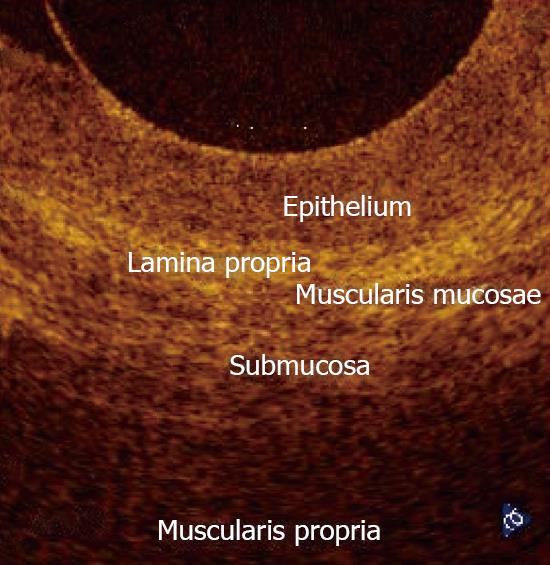
Figure 2 Magnification of a OCT image showing normal esophageal wall.
The OCT image shows a multiple-layer structure characterized by a superficial weakly scattering (hypo-reflective) layer, corresponding to the squamous epithelium, a highly scattering (hyper-reflective) layer corresponding to the lamina propria, a weakly scattering layer corresponding to the muscularis mucosae, difficult to recognize, a moderately scattering layer corresponding to the submucosa, and a weakly scattering, deep layer corresponding to muscolaris propria.
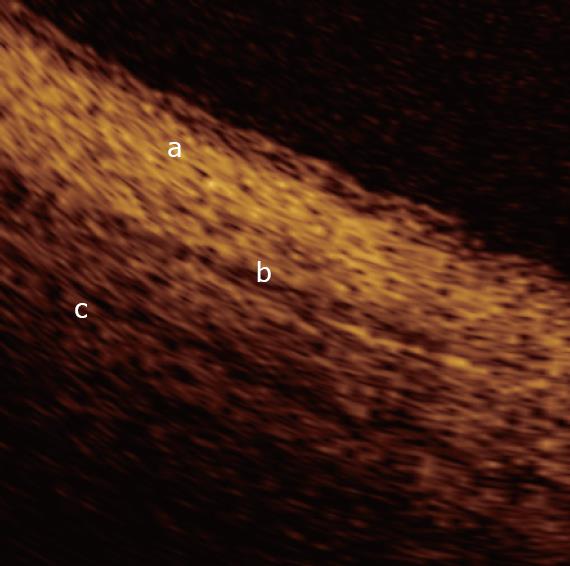
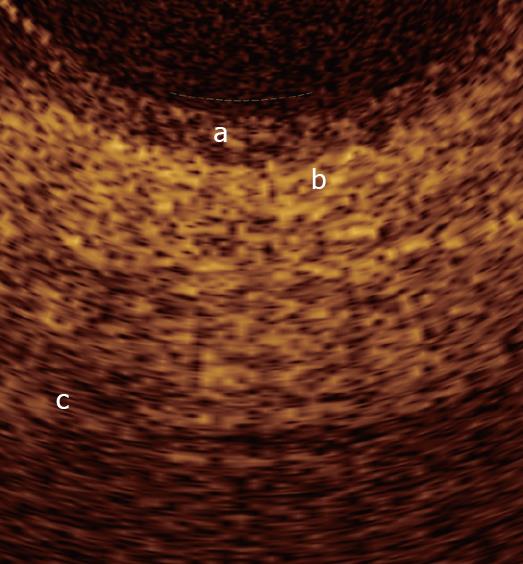
Figure 3 Magnification of an OCT image from the normal common bile duct wall.
From the surface of the duct, up to a depth of 1 mm, the following layers are recognizable: the single layer of epithelial cells, approximately 0.04-0.06 mm thick, visible as a superficial, hypo-reflective band (a); the connective-muscular layer surrounding the epithelium, visible as a hyper-reflective layer approximately 0.34-0.48 mm thick (b); the connective layer visible as a hypo-reflective layer with longitudinal relatively hyper-reflective strips (smooth muscle fibers) (c).
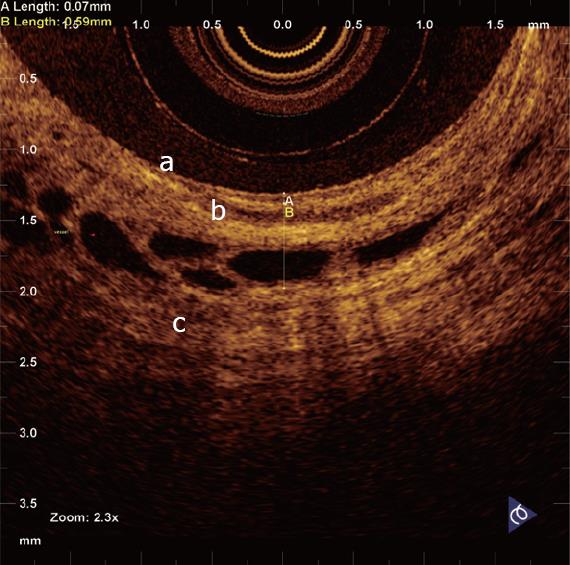
Figure 4 Magnification of an OCT image from the normal sphincter of Oddi wall.
From the surface of the duct, up to a depth of 1 mm, the following layers are recognizable: The single layer of epithelial cells, approximately 0.04-0.08 mm thick, visible as a superficial, hypo-reflective band (a); the connective-muscular layer surrounding the epithelium, visible as a hyper-reflective layer approximately 0.23-0.37 mm thick (b); the connective layer visible as a hypo-reflective layer with longitudinal relatively hyper-reflective strips (smooth muscle fibers) (c). Within the intermediate and outer layer vessels are also recognizable, visualized as non-reflecting areas surrounded by a hypo-reflective endothelium. Margins between the intermediate and outer layer are poorly recognizable, due to the irregular distribution of connective and muscular structure.
Figure 5 Magnification of an OCT image from the normal main pancreatic duct wall.
From the surface of the duct, up to a depth of 1 mm, the following layers are recognizable: The single layer of epithelial cells, approximately 0.04-0.08 mm thick, visible as a superficial, hypo-reflective band (a); the connective-fibro-muscular layer surrounding the epithelium, visible as a hyper-reflective layer approximately 0.36-0.56 mm thick (b); the connective and acinar structure close to the ductal wall epithelium, visible as a hypo-reflective layer (c).
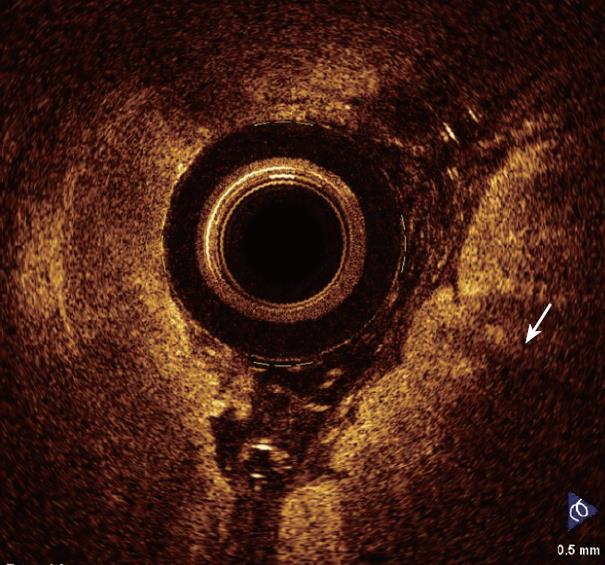
Figure 6 Barrett’s esophagus (arrow).
OCT features predictive for the presence of intestinal metaplasia are: The absence of the layered structure of the normal squamous epithelium and the presence of the vertical crypt-and-pit morphology of normal gastric mucosa; a disorganized architecture with inhomogeneous backscattering of the signal and an irregular mucosal surface; the presence of submucosal glands characterized by a markedly hypo-reflective tissue below the epithelial surface.
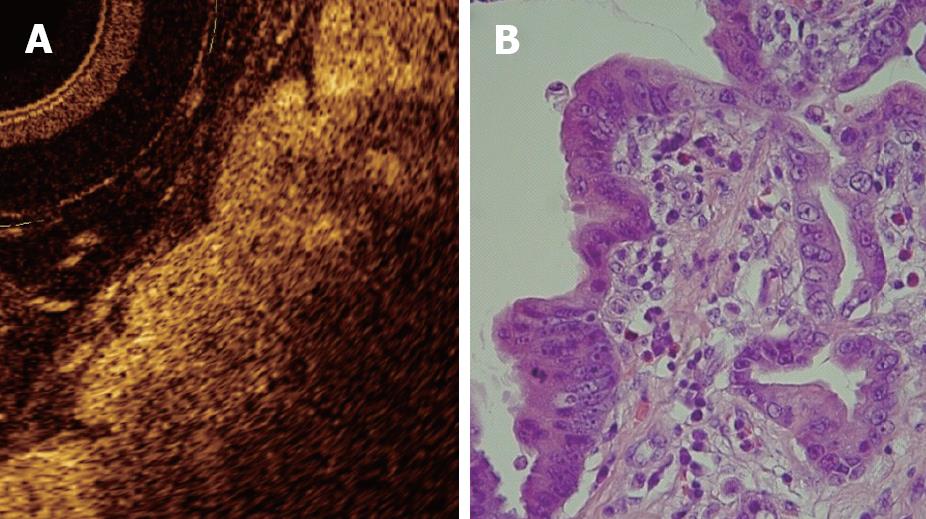
Figure 7 OCT image showing high-grade dysplasia (A) compared to histology (B).
Because the degree of reflectivity depends upon nuclear size, a markedly inhomogenous and hypo-reflective back-scattering of the signal should indicate the presence of high-grade dysplasia.
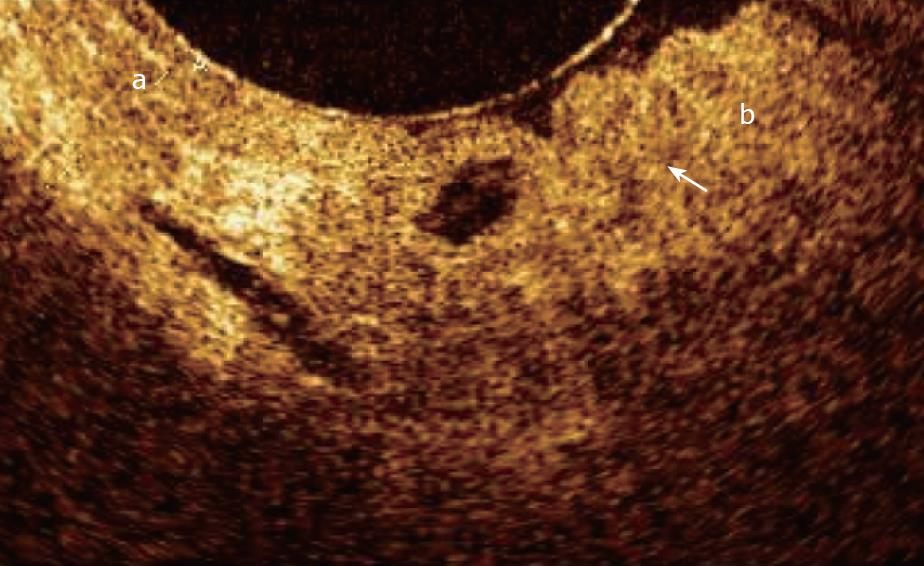
Figure 8 OCT image showing normal oesophageal mucosa (a) and Barrett’s epithelium (b) with focal high-grade dysplasia (arrow).
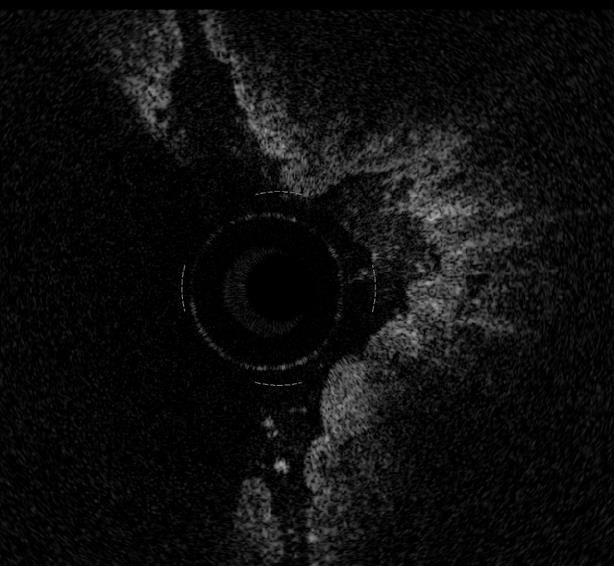
Figure 9 Magnified OCT imaging of early stage adenocarcinoma raised within Barrett's epithelium.
The lack of the regular esophageal wall layered morphology and a markedly heterogeneous back-reflectance of the signal characterize the neoplastic lesion, which is confined within the epithelium.
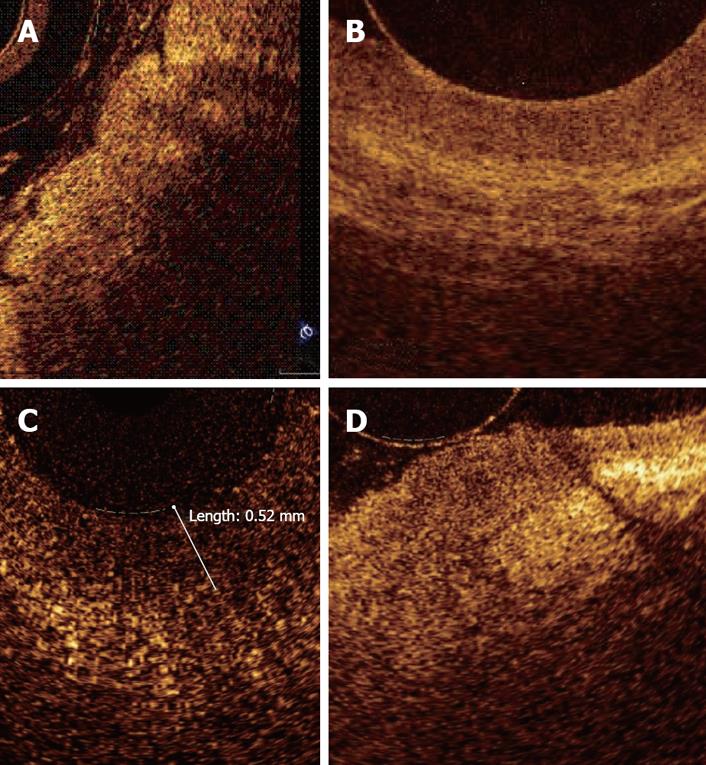
Figure 10 Comparison of OCT findings of normal esophageal mucosa (A), Barrett's epithelium (B), dysplasia (C), and adenocarcinoma (D).
Figure 11 Magnified OCT images from section of main pancreatic duct showing low-grade dysplasia.
The surface between the inner and intermediate layers appeared irregular. Dysplasia presents strong hyper-reflectance of the intermediate layer, particularly in the part closest to the inner layer. The outer layer did not differ from other non-malignant conditions and appeared homogeneously hypo-reflective.
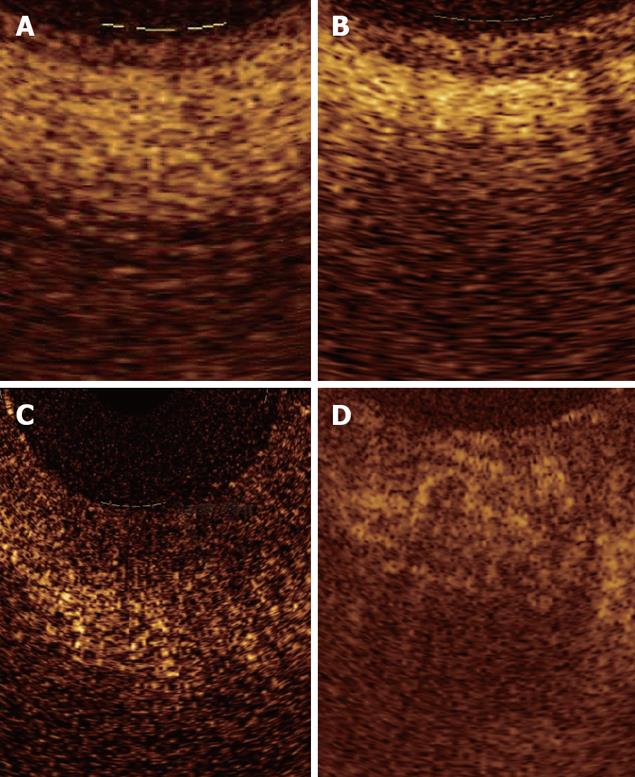
Figure 12 Magnified OCT images from sections with either normal (A), tumor-associated chronic inflammation (B), low-grade dysplasia (C), and adenocarcinoma (D) tissue.
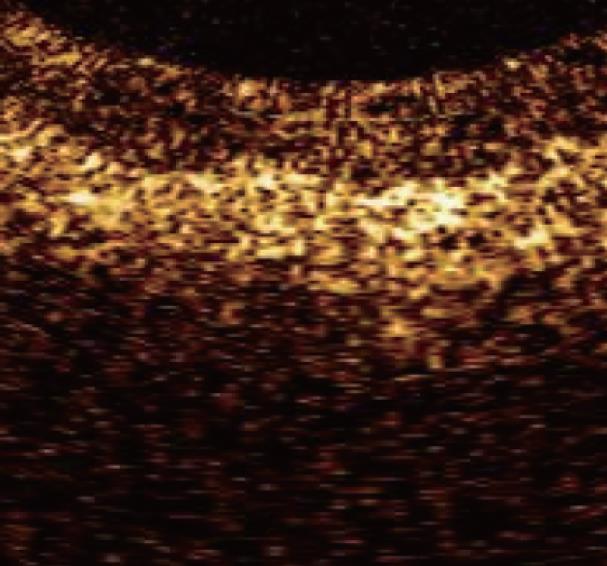
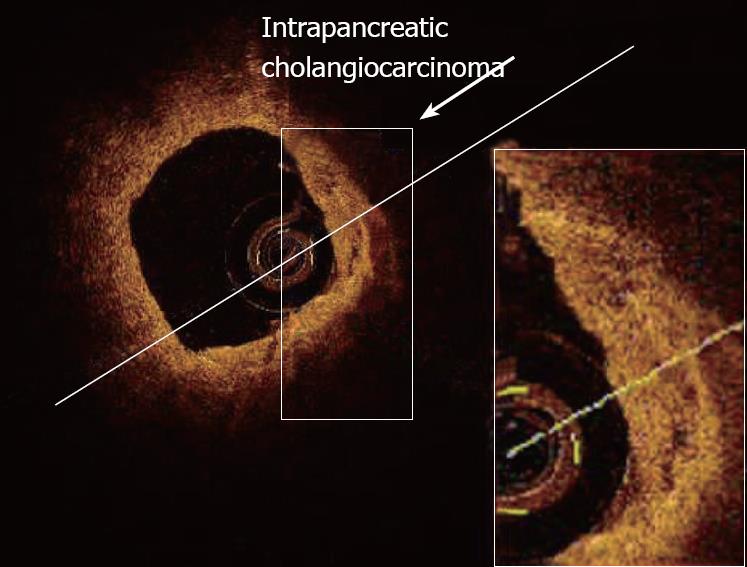
Figure 13 Magnified OCT images of neoplastic tissue within the intrapancreatic portion of the common bile duct.
- Citation: Testoni PA, Mangiavillano B. Optical coherence tomography in detection of dysplasia and cancer of the gastrointestinal tract and bilio-pancreatic ductal system. World J Gastroenterol 2008; 14(42): 6444-6452
- URL: https://www.wjgnet.com/1007-9327/full/v14/i42/6444.htm
- DOI: https://dx.doi.org/10.3748/wjg.14.6444


