Copyright
©2008 The WJG Press and Baishideng.
World J Gastroenterol. Oct 28, 2008; 14(40): 6188-6194
Published online Oct 28, 2008. doi: 10.3748/wjg.14.6188
Published online Oct 28, 2008. doi: 10.3748/wjg.14.6188
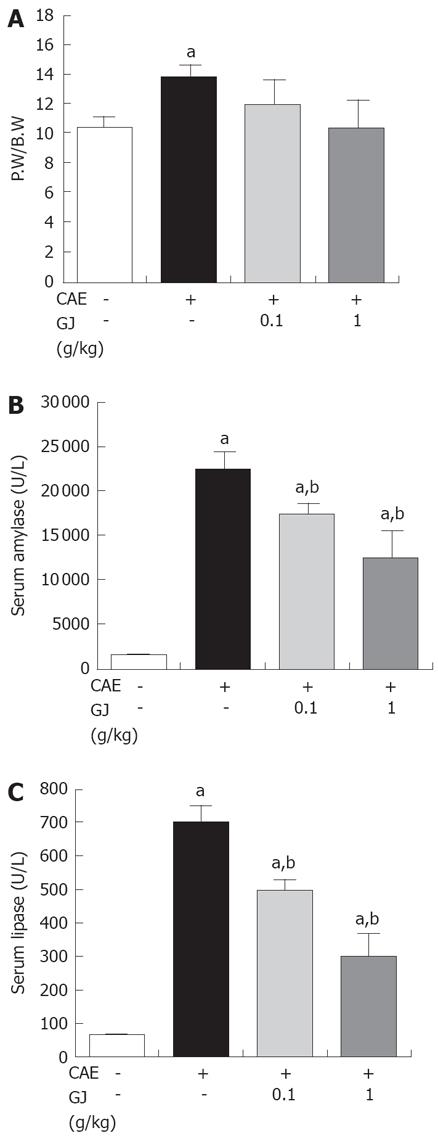
Figure 1 Effects of GJ pretreatment on the (A) PW/BW, (B) serum amylase activity, and (C) serum-lipase activity in cerulein induced AP.
The study groups were treated as indicated in the experimental protocol. The mean ± SE of the six animals are shown. aP < 0.05 vs saline treatment; bP < 0.05 vs cerulein treatment alone.
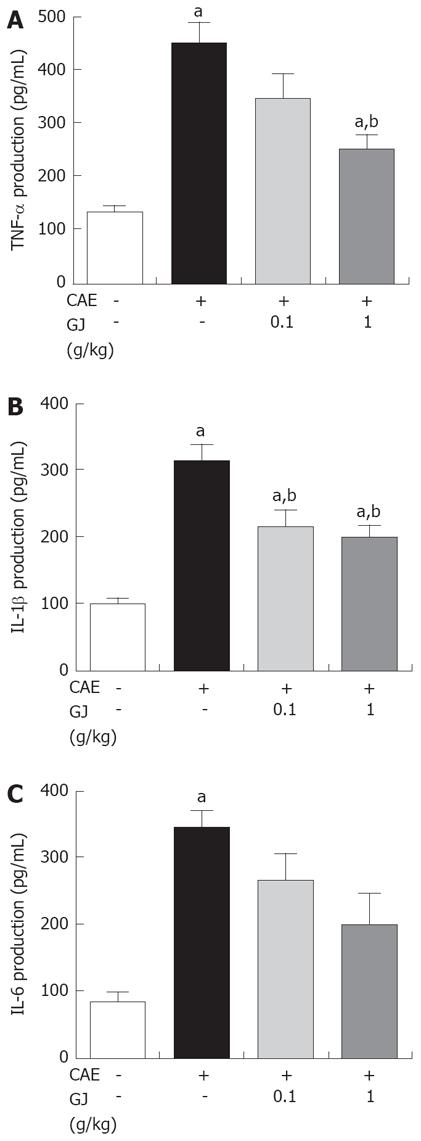
Figure 2 Effect of GJ on (A) TNF-α, (B) IL-1β and (C) IL-6 secretion in cerulein-induced AP.
Mice were treated as indicated in the experimental protocol. The mean ± SE of six animals are shown. The study groups were treated as indicated in the experimental protocol. aP < 0.05 vs saline treatment; bP < 0.05 vs cerulein treatment alone.
Figure 3 Effect of GJ on TNF-α, IL-6 and IL-1 mRNA levels in cerulein-induced AP.
The mice were sacrificed at 1, 3 and 6 h after six injections. Levels of pancreatic mRNA were quantified by real-time PCR for (A) TNF-α, (B) IL-1β, and (C) IL-6. The mean ± SE of six animals are shown. aP < 0.05 vs saline treatment; bP < 0.05 vs cerulein treatment alone.
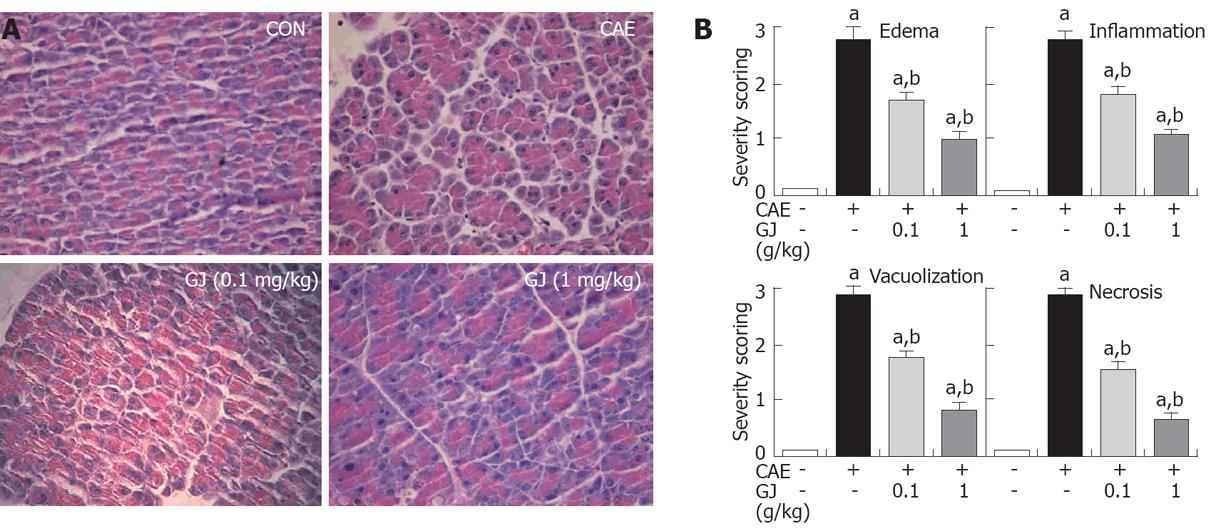
Figure 4 Effects of the GJ on pancreatic inflammatory changes following pancreatitis.
A: Representative H&E-stained sections of pancreas in control mice (CON) who were not given cerulein, in mice given cerulein (CAE), and in mice given GJ (1 mg/kg) at the same time as the first cerulein injection; B: Histological sections of pancreas harvested 12 h after injection of saline (CON), cerulein alone, or GJ (1 or 0.1 mg/kg) given at the same time as the first injection of cerulein. The results were scored from 0 (normal) to 3 (severe) for edema, inflammation, vacuolization, and necrosis. aP < 0.05 vs saline treatment; bP < 0.05 vs cerulein treatment alone. The figure shows the results of one experiment in which 4-5 mice were tested per group. The results obtained were similar to those in three additional experiments (× 200).
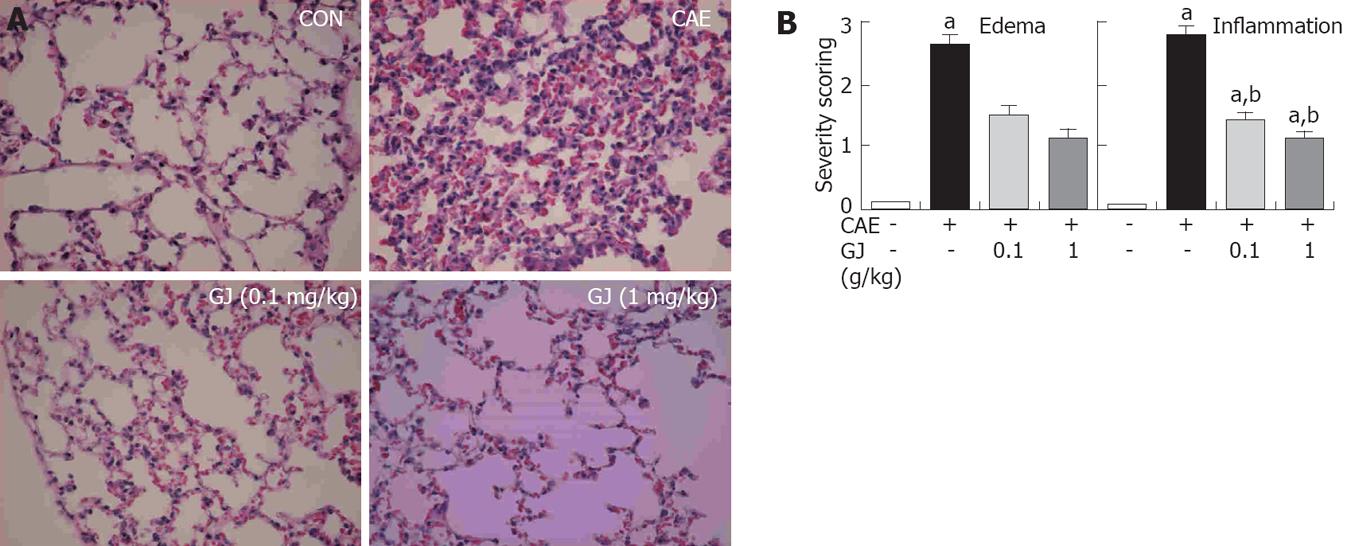
Figure 5 GJ reduced the severity of AP-associated lung injury.
A: Representative H&E-stained sections of the pancreas in control mice (CON) not given cerulein, in mice given cerulein (CAE), and in mice given GJ (1 mg/kg) at the same time as the first cerulein injection; B: Histology sections of the lung harvested 12 h after administration of saline (CON), cerulein alone, or GJ (1 or 0.1 mg/kg) given at the same time as the first injection of cerulein. The results were scored from 0 (normal) to 3 (severe) for edema, inflammation, vacuolization, and necrosis. aP < 0.05 vs saline treatment; bP < 0.05 vs cerulein treatment alone. The figure shows one experiment in which 4-5 mice were tested per group. The results obtained were similar to those in three additional experiments (× 200).
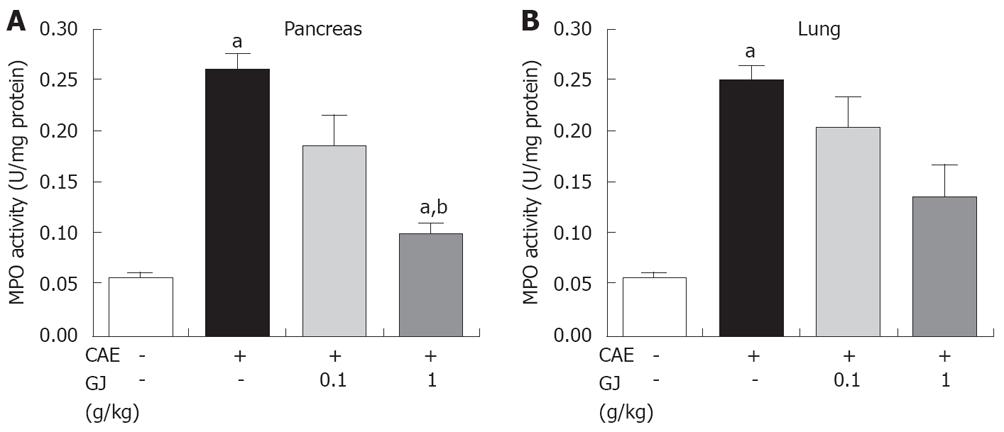
Figure 6 MPO activity was measured in the pancreas 6 h after completion of the cerulein injections and in saline-injected control mice (CON).
The data are expressed as MPO activity (U/mg protein). aP < 0.05 vs saline treatment; bP < 0.05 vs cerulein treatment alone. The figure shows the results of one experiment in which 5-6 mice were tested per group.
-
Citation: Jung WS, Chae YS, Kim DY, Seo SW, Park HJ, Bae GS, Kim TH, Oh HJ, Yun KJ, Park RK, Kim JS, Kim EC, Hwang SY, Park SJ, Song HJ.
Gardenia jasminoides protects against cerulein-induced acute pancreatitis. World J Gastroenterol 2008; 14(40): 6188-6194 - URL: https://www.wjgnet.com/1007-9327/full/v14/i40/6188.htm
- DOI: https://dx.doi.org/10.3748/wjg.14.6188


