Copyright
©2008 The WJG Press and Baishidengs.
World J Gastroenterol. Jan 28, 2008; 14(4): 547-553
Published online Jan 28, 2008. doi: 10.3748/wjg.14.547
Published online Jan 28, 2008. doi: 10.3748/wjg.14.547
Figure 1 Histologic results of liver tissue after staining with hematoxylin and eosin (HE, × 100).
Mice were challenged with thermal injury and immediately intravenously injected with CORM-2 (8 mg/kg). A: Sham group; B: Burn group; C: Burn + CORM-2 group.
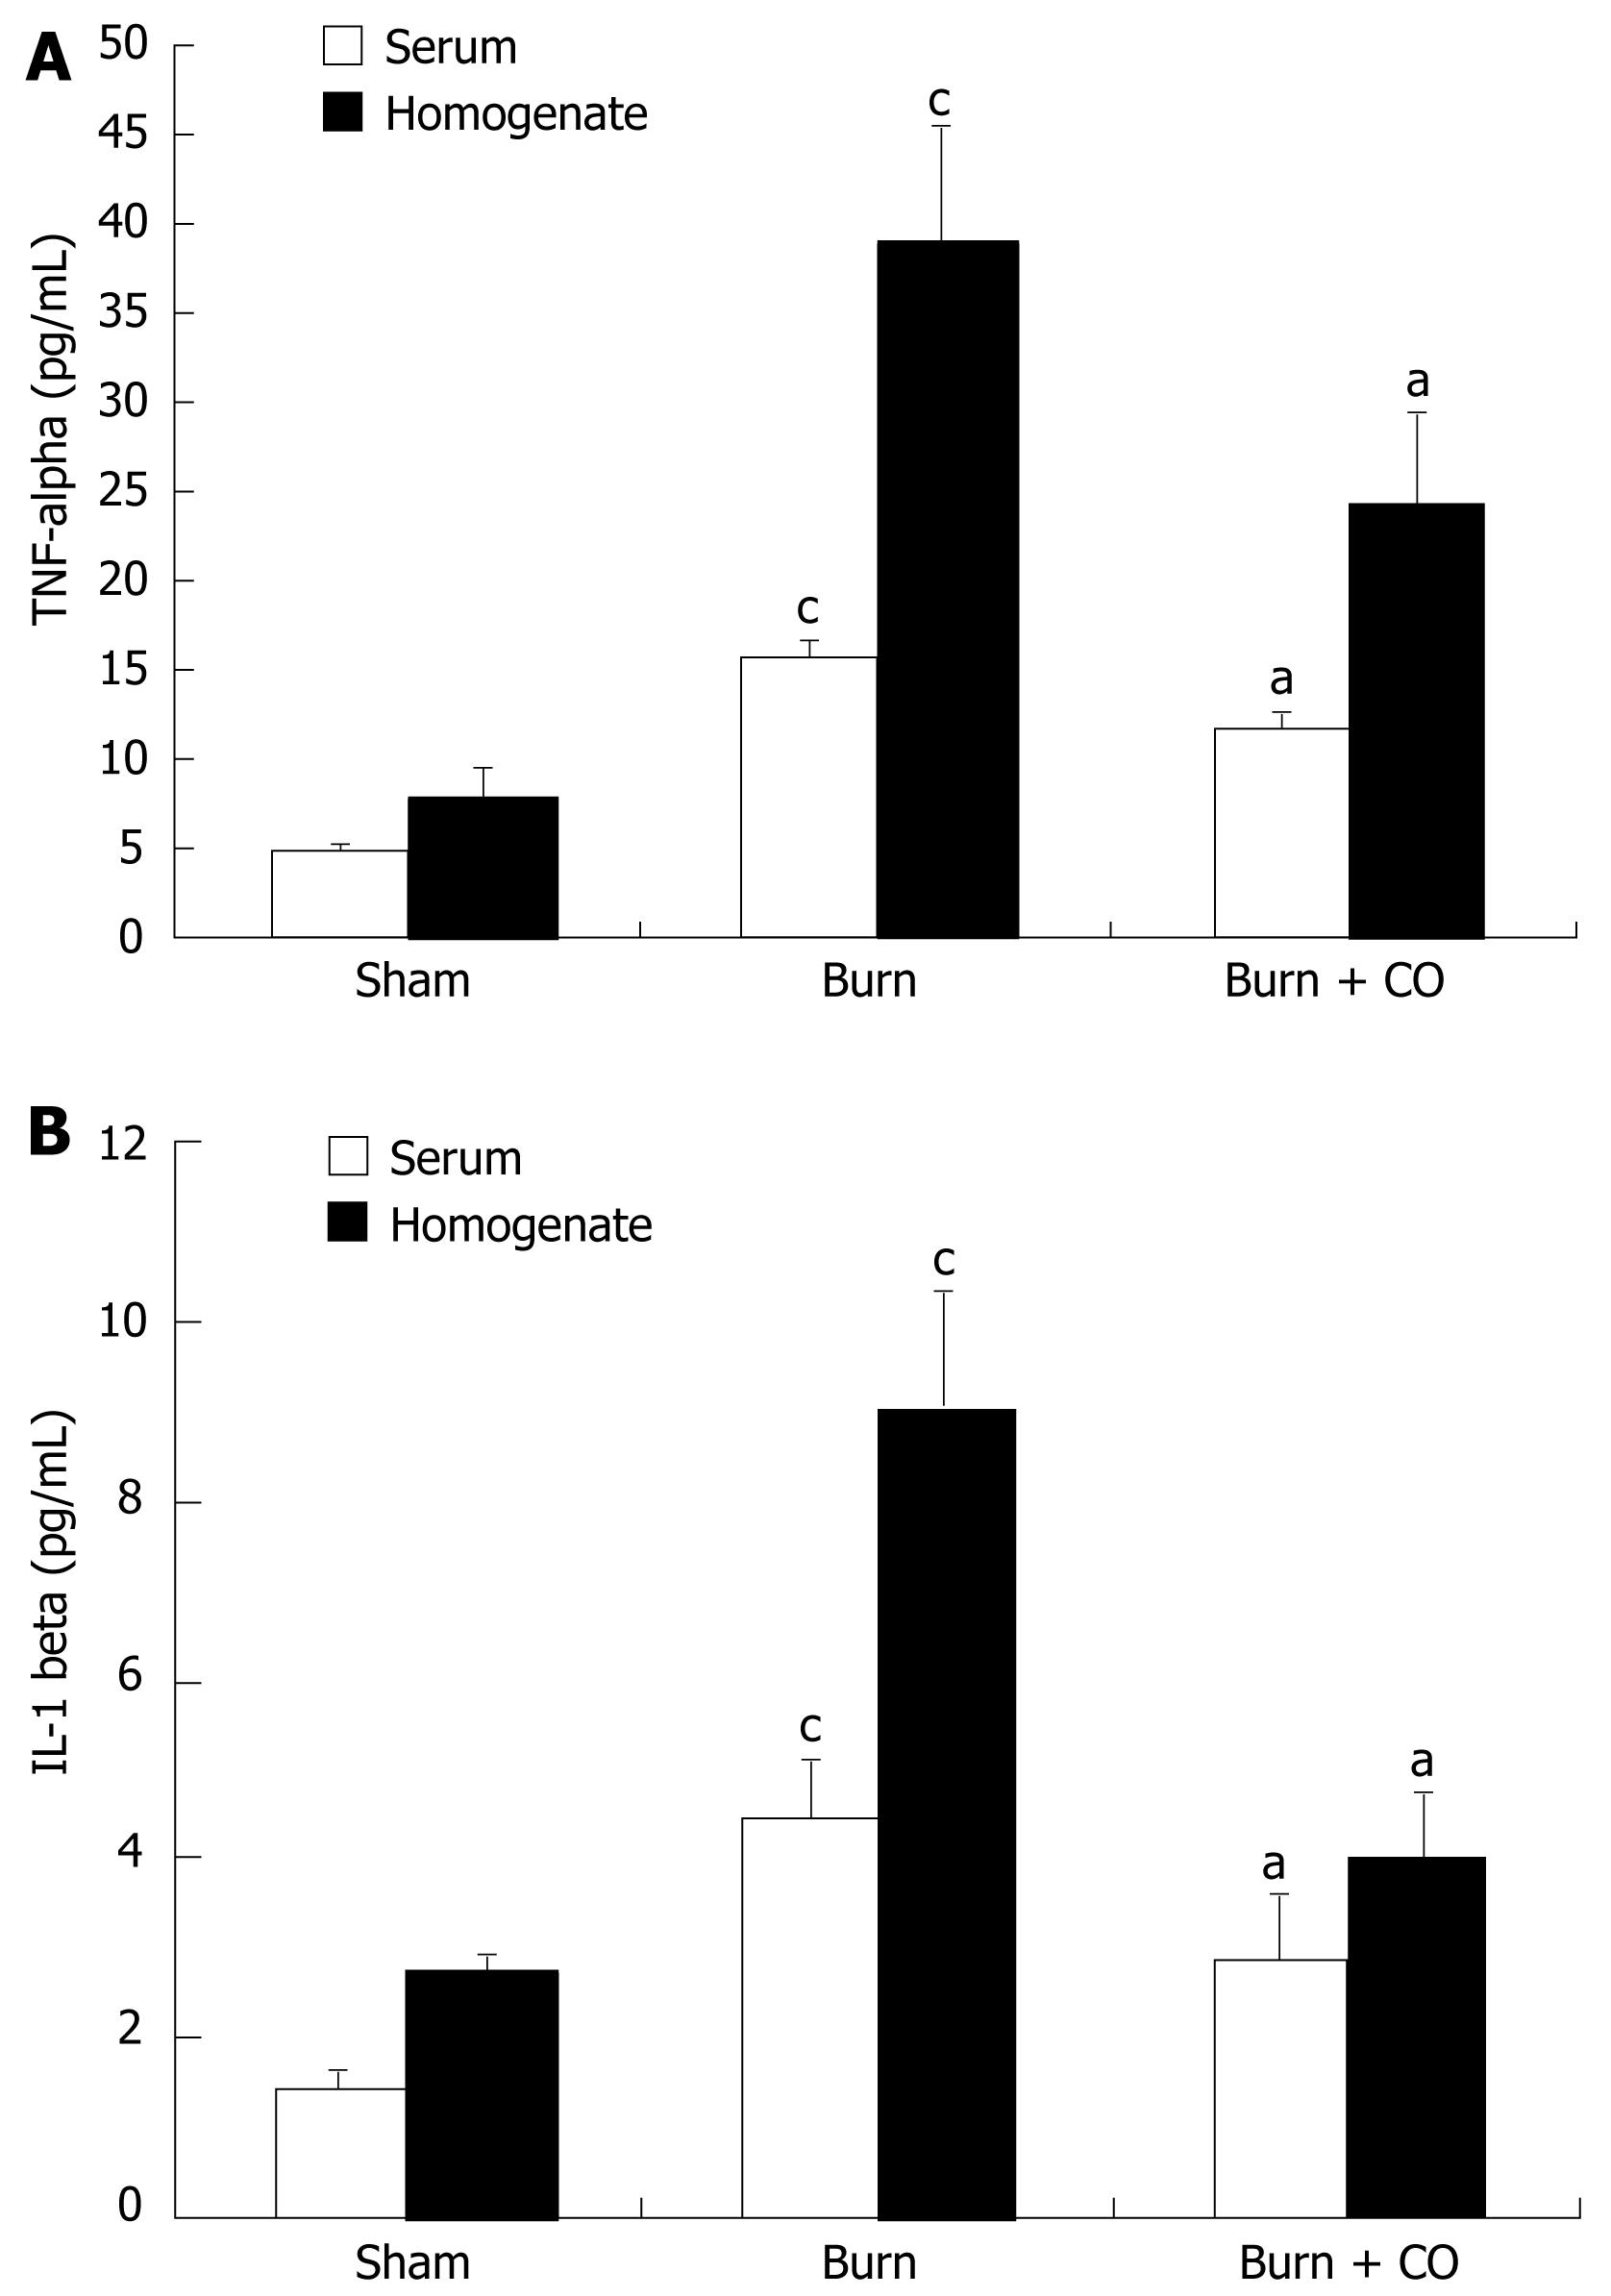
Figure 2 Effect of CORM-2 on TNF-a and IL-1β levels in serum and tissue homogenates of burn-challenged mice.
Data are expressed as mean ± SE of three experiments (three mice per group). aP < 0.05 vs burn group; cP < 0.05 vs sham group.
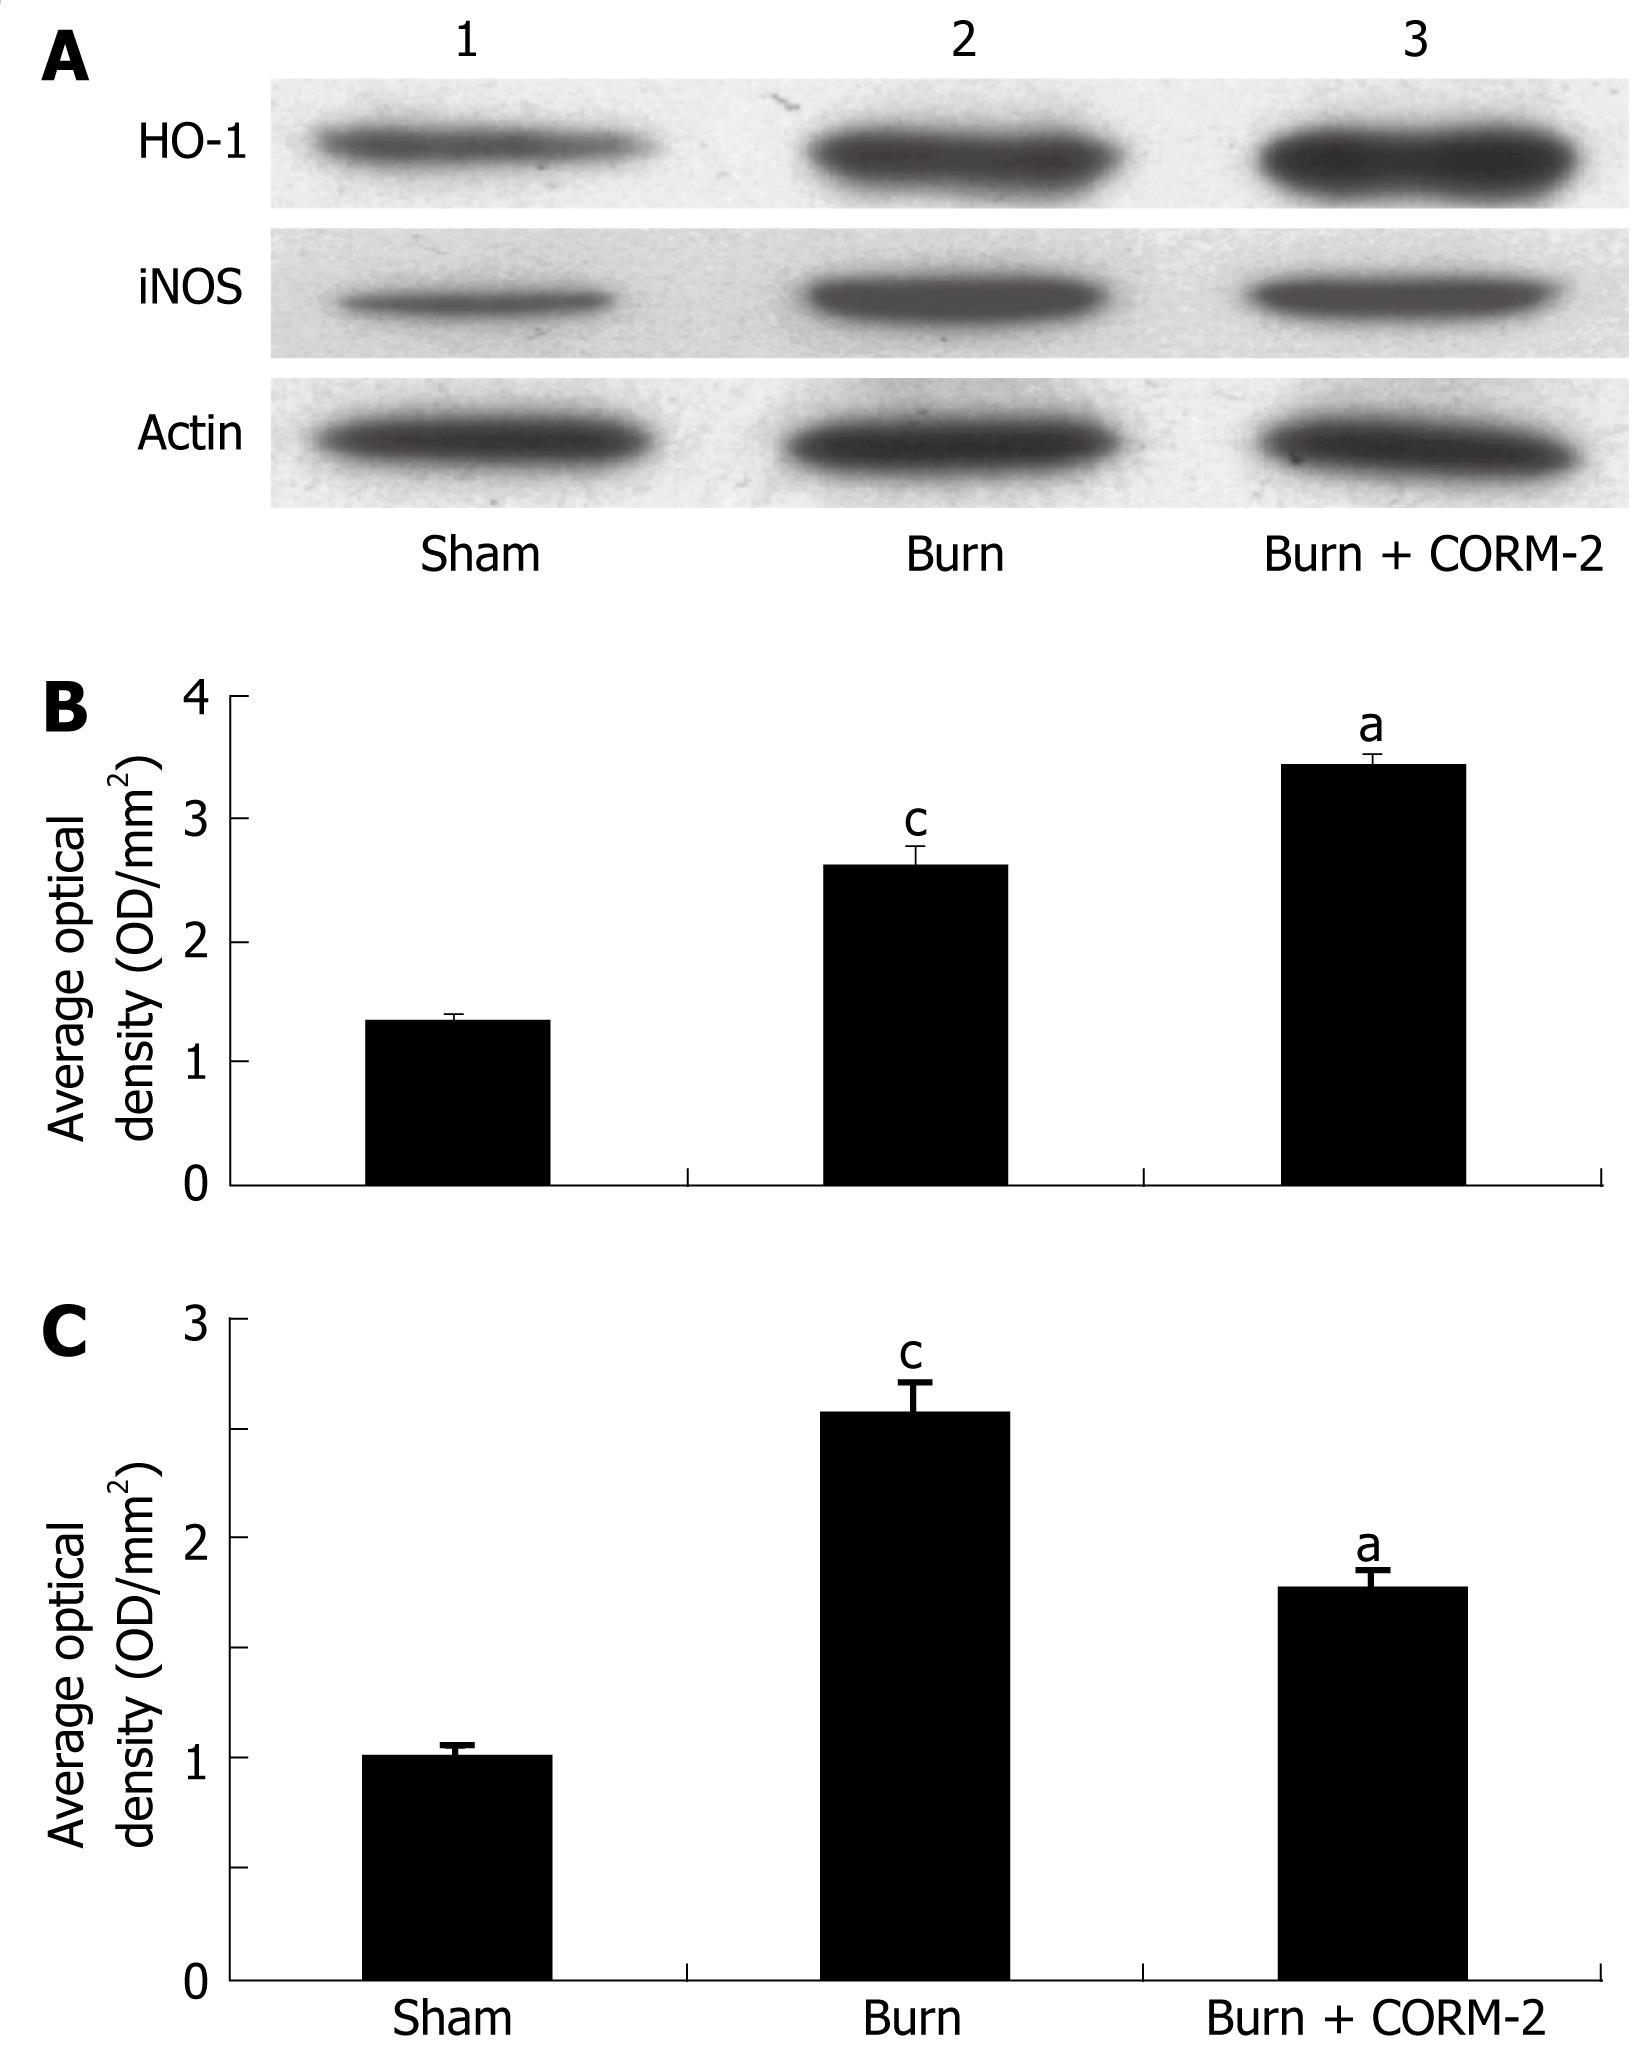
Figure 3 Effects of CORM-2 on protein expression of iNOS and HO-1 in the liver of burn-challenged mice.
Protein expressions of iNOS and HO-1 were performed by Western blotting at 24 h after thermal injury. A: Representative experiment; B and C: Quantitative results (average absorbance, A540) of three. aP < 0.05 vs burn group; cP < 0.05 vs sham group.
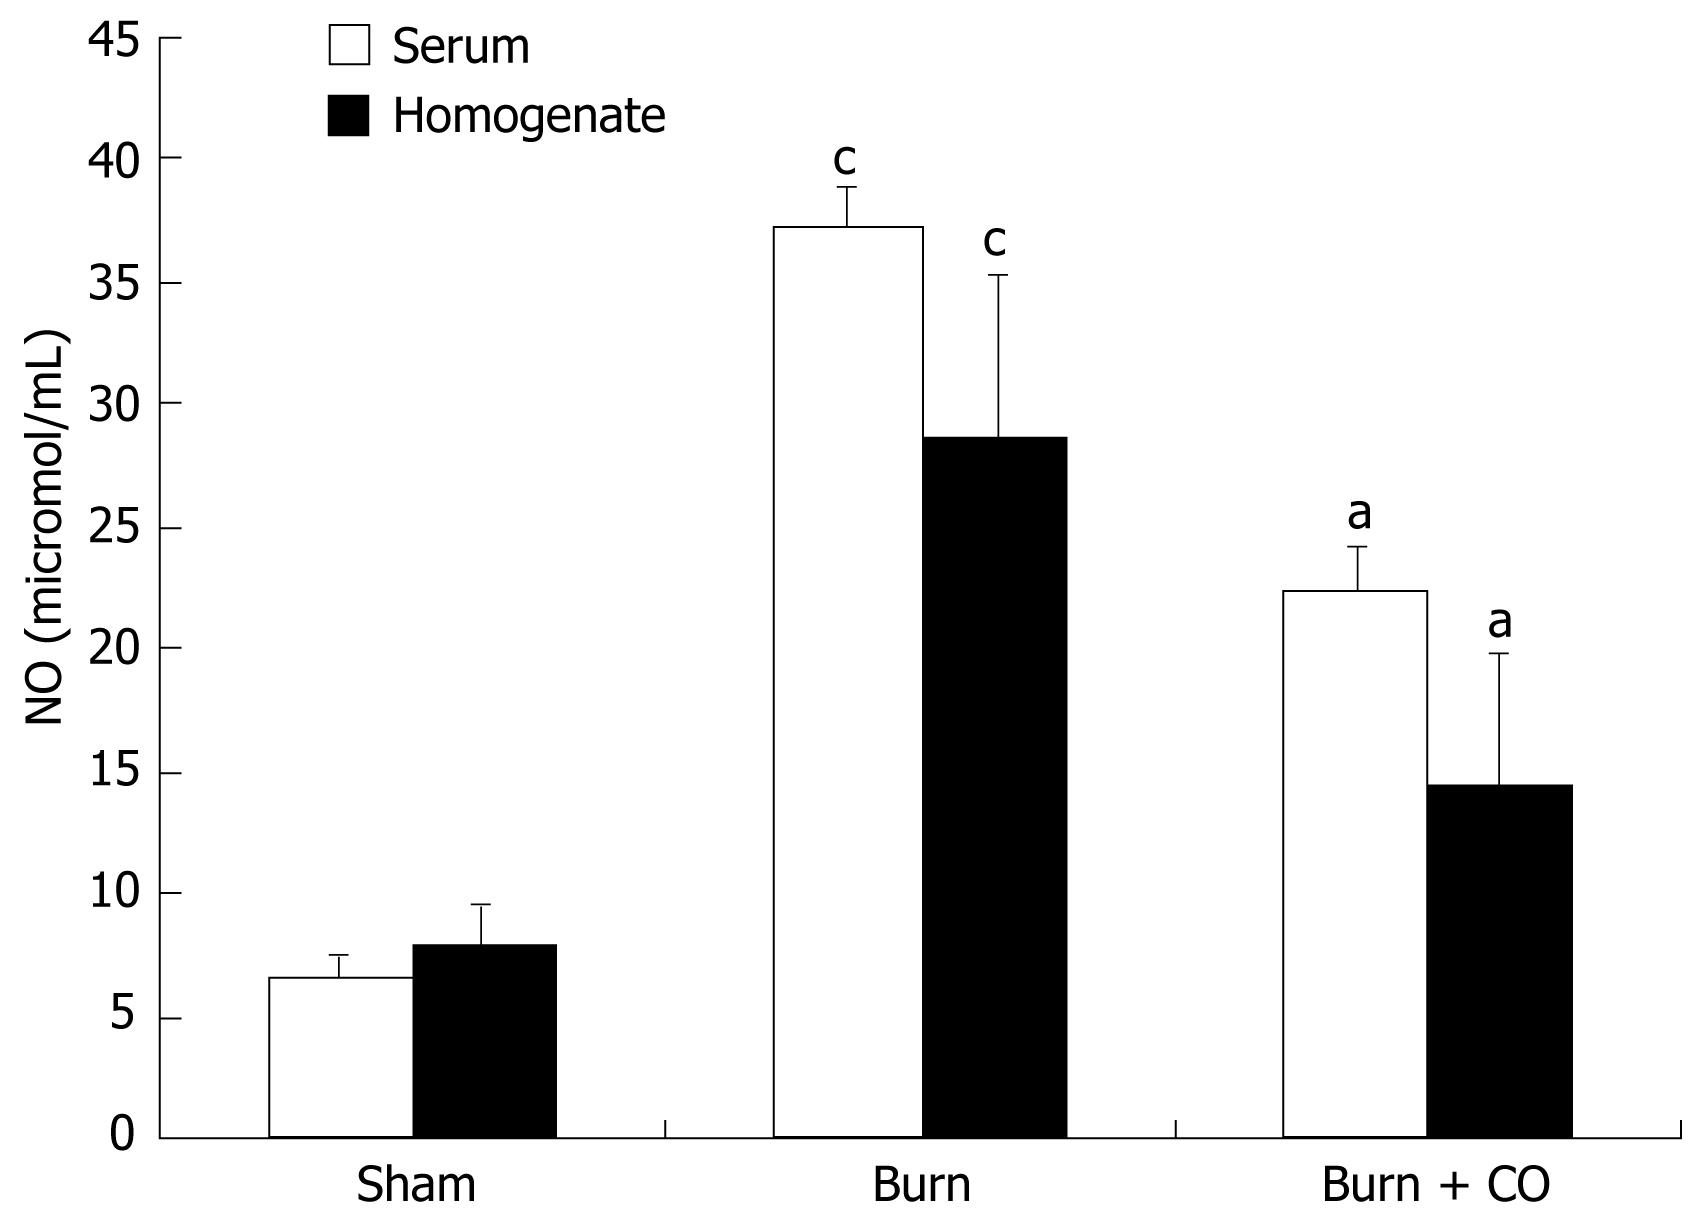
Figure 4 Effects of CORM-2 on NO level in serum and tissue homogenates of burn-challenged mice.
Measurement of NO level was performed by a microplate assay using Griess reagent at 24 h after thermal injury. NO levels both in serum and tissue homogenates of thermally injured mice were markedly increased, but significantly inhibited by in vivo administration of CORM-2. aP < 0.05 vs burn group; cP < 0.05 vs sham group.
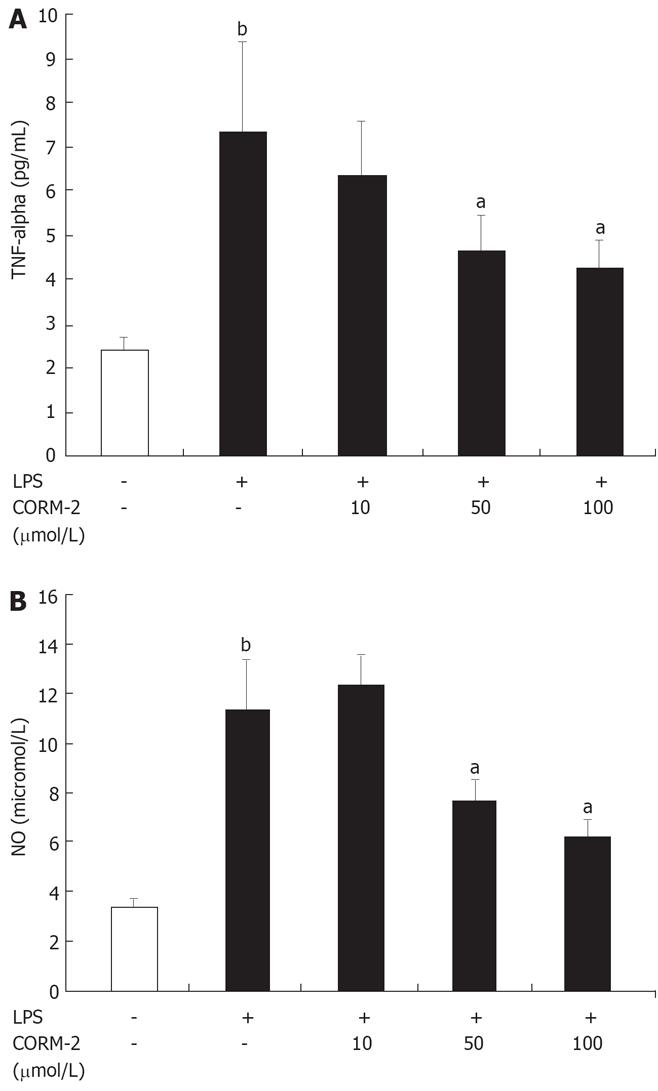
Figure 5 Effect of CORM-2 on levels of NO and TNF-α in supernatants of Kupffer cells stimulated with LPS.
Kupffer cells were co-incubated with LPS and different concentrations of CORM-2 (10-100 mmol/L) for 4 h. All values are expressed as means ± SE (n = 3). bP < 0.01 vs control; aP < 0.05 vs LPS group.
- Citation: Sun BW, Sun Y, Sun ZW, Chen X. CO liberated from CORM-2 modulates the inflammatory response in the liver of thermally injured mice. World J Gastroenterol 2008; 14(4): 547-553
- URL: https://www.wjgnet.com/1007-9327/full/v14/i4/547.htm
- DOI: https://dx.doi.org/10.3748/wjg.14.547


