Copyright
©2008 The WJG Press and Baishideng.
World J Gastroenterol. Jan 28, 2008; 14(4): 541-546
Published online Jan 28, 2008. doi: 10.3748/wjg.14.541
Published online Jan 28, 2008. doi: 10.3748/wjg.14.541
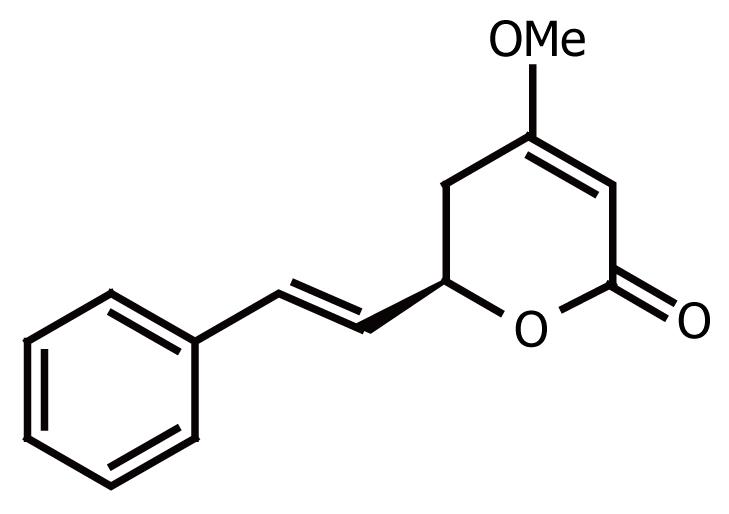
Figure 1 Chemical structure of kavain (KA).
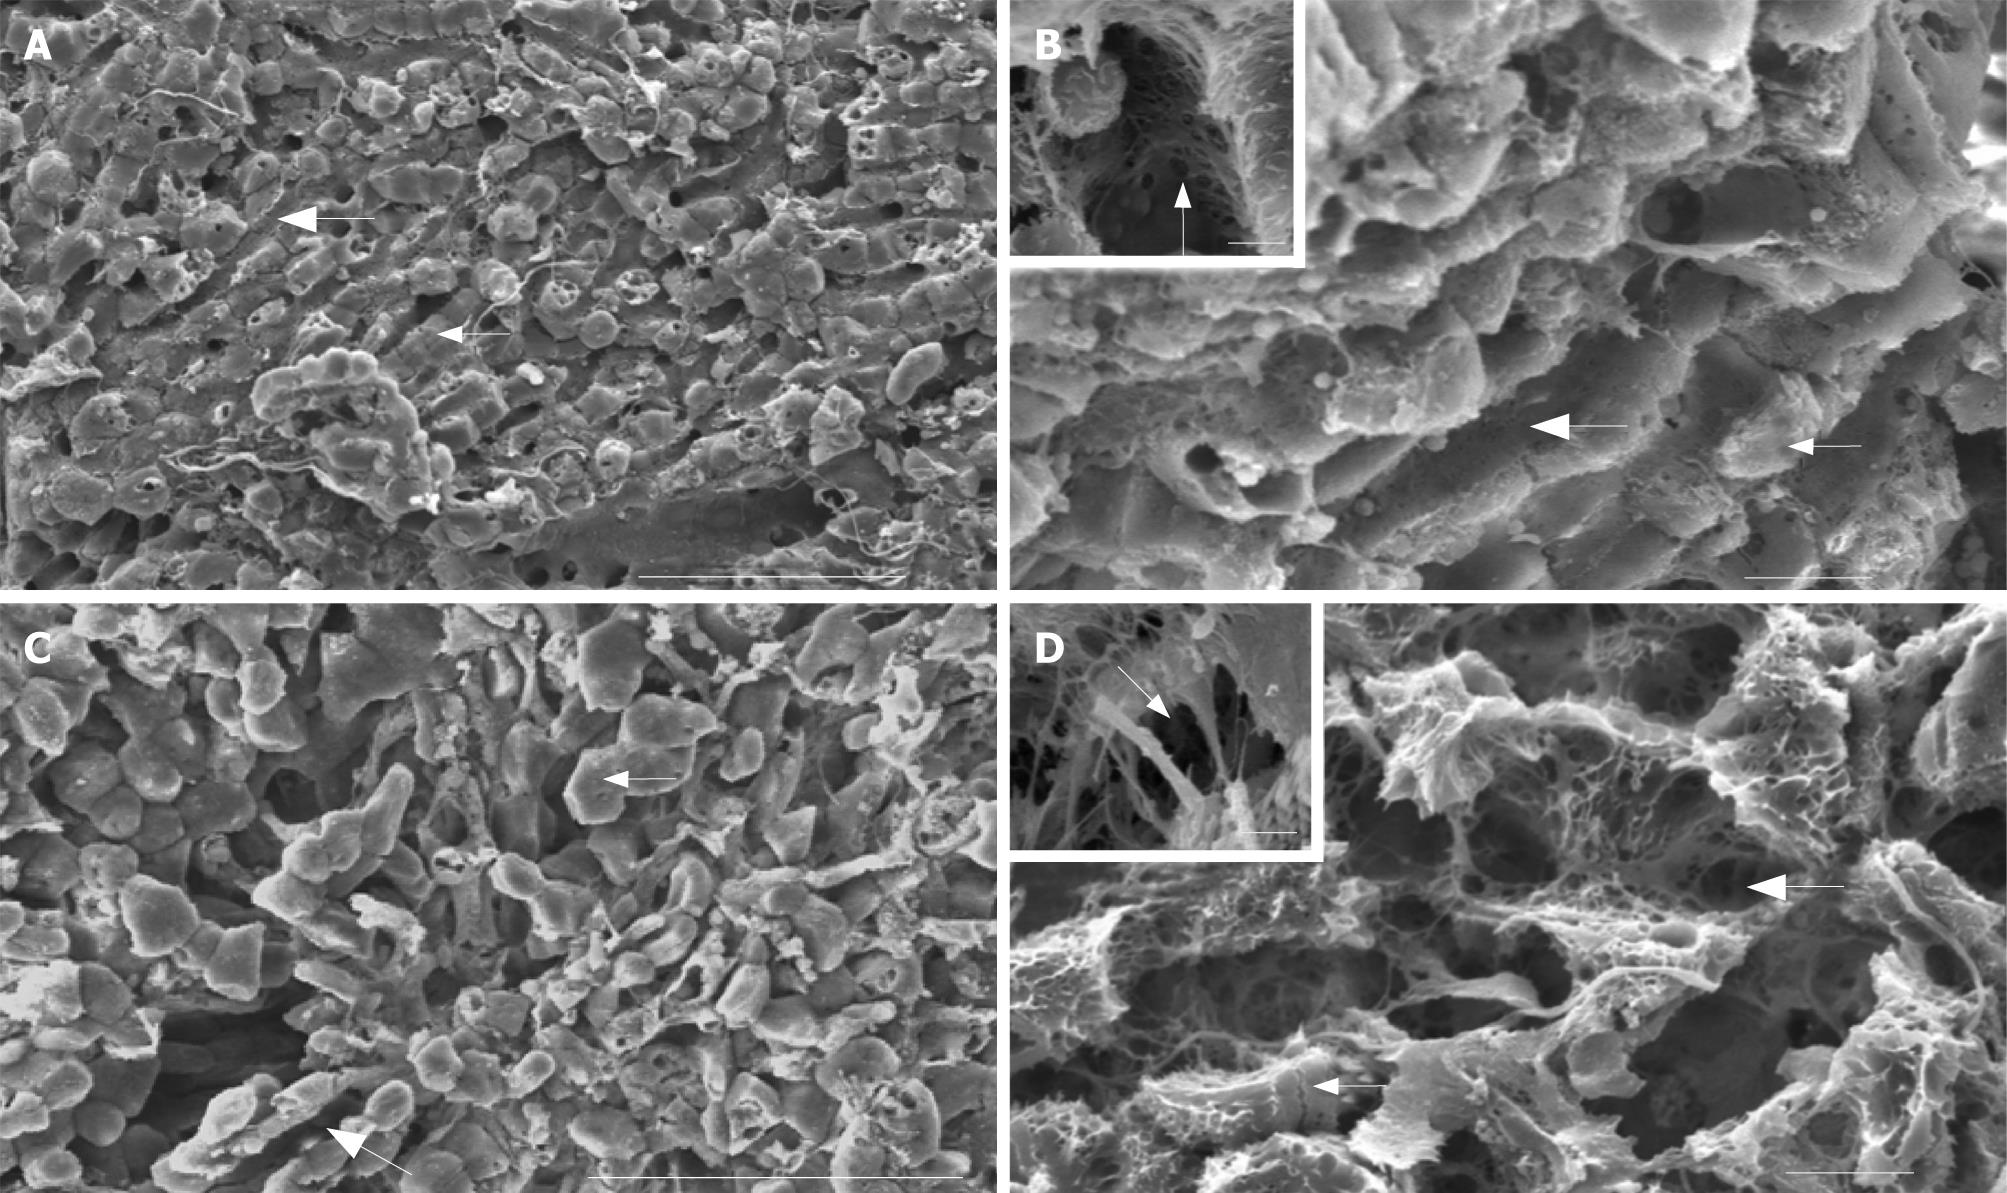
Figure 2 Scanning electron micrographs of control (A and B) and kavain-treated (C and D) livers.
A: Overall low magnification image shows the intact histological relationship between the liver sinusoidal vascular bed (large arrow) and the neighbouring liver parenchymal cells (small arrow) of control liver tissue. Scale bar, 100 micrometer; B: Intermediate magnification of control liver tissue reveals the intact hepatic endothelial lining (large arrow) and its relationship with the neighbouring hepatocytes (small arrow). Scale bar, 40 micrometer. Inset depicts the pores or so-called fenestrae (arrow) at high magnification (bar represents 1 micrometer); C: Observation of kavain-treated liver tissue at low magnification reveals loss of the normal straight and parallel aligned sinusoidal blood vessels, instead contracted and curly microvessels can be seen (large arrow). Note that the hepatocytes appear to be swollen and have lost their relationship with the bordering endothelial lining (small arrow). Scale bar, 100 micrometer; D: When the same tissue is observed at higher magnification the endothelial damage in the form of gaps (large arrow) and the disconnection of the liver parenchymal cells (small arrow) becomes apparent. Scale bar, 40 micrometer. The inset illustrates the severely damaged endothelial lining (arrow, gaps; scale bar 1 micrometer).
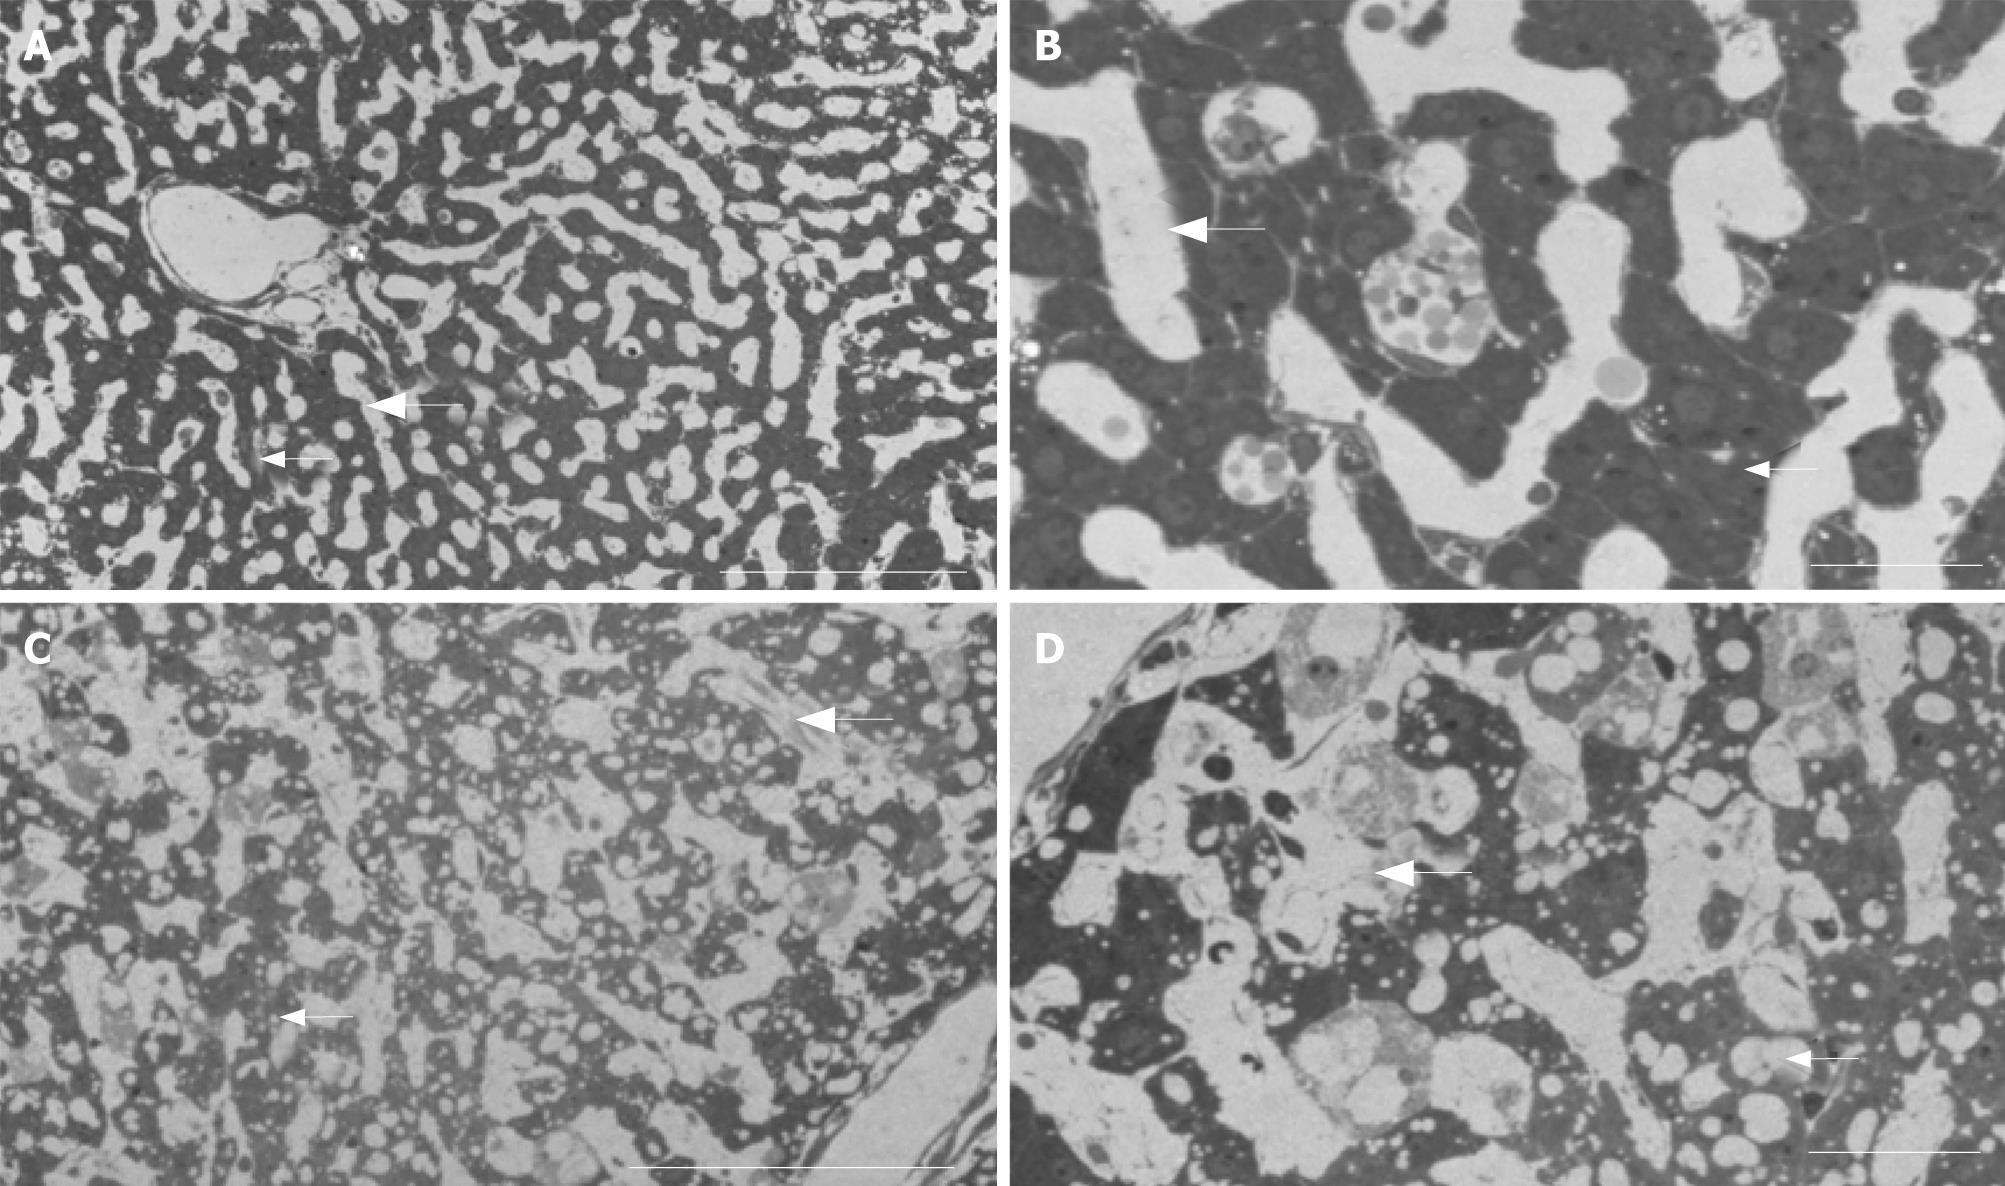
Figure 3 Bright field light optical micrographs of control (A and B) and kavain-treated livers (C and D).
Note, comparison with the high-magnification TEM data for comparative purposes. A: Control liver tissue at low magnification reveals normal histology: i.e., hepatocytes (small arrow) are organized in long cords following the liver sinusoids or microvascular bed (large arrow). Scale bar, 100 micrometer; B: Higher magnification of control tissue reveals the patent empty sinusoidal lumen (large arrow) and the relationship with the neighbouring hepatocytes (small arrow). Scale bar 40 micrometer; C: In contrast, kavain-treated samples reveal narrowing of the microvessels (large arrow), indicating sinusoidal blood vessel contraction (compare with A). Small arrow, hepatocytes. Scale bar, 100 micrometer; D: Intermediate magnification of kavain-treated samples reveal strong vacuolization of the liver parenchymal tissue (small arrow) and loss of normal sinusoidal vasculature (large arrow). Scale bar, 40 micrometer.
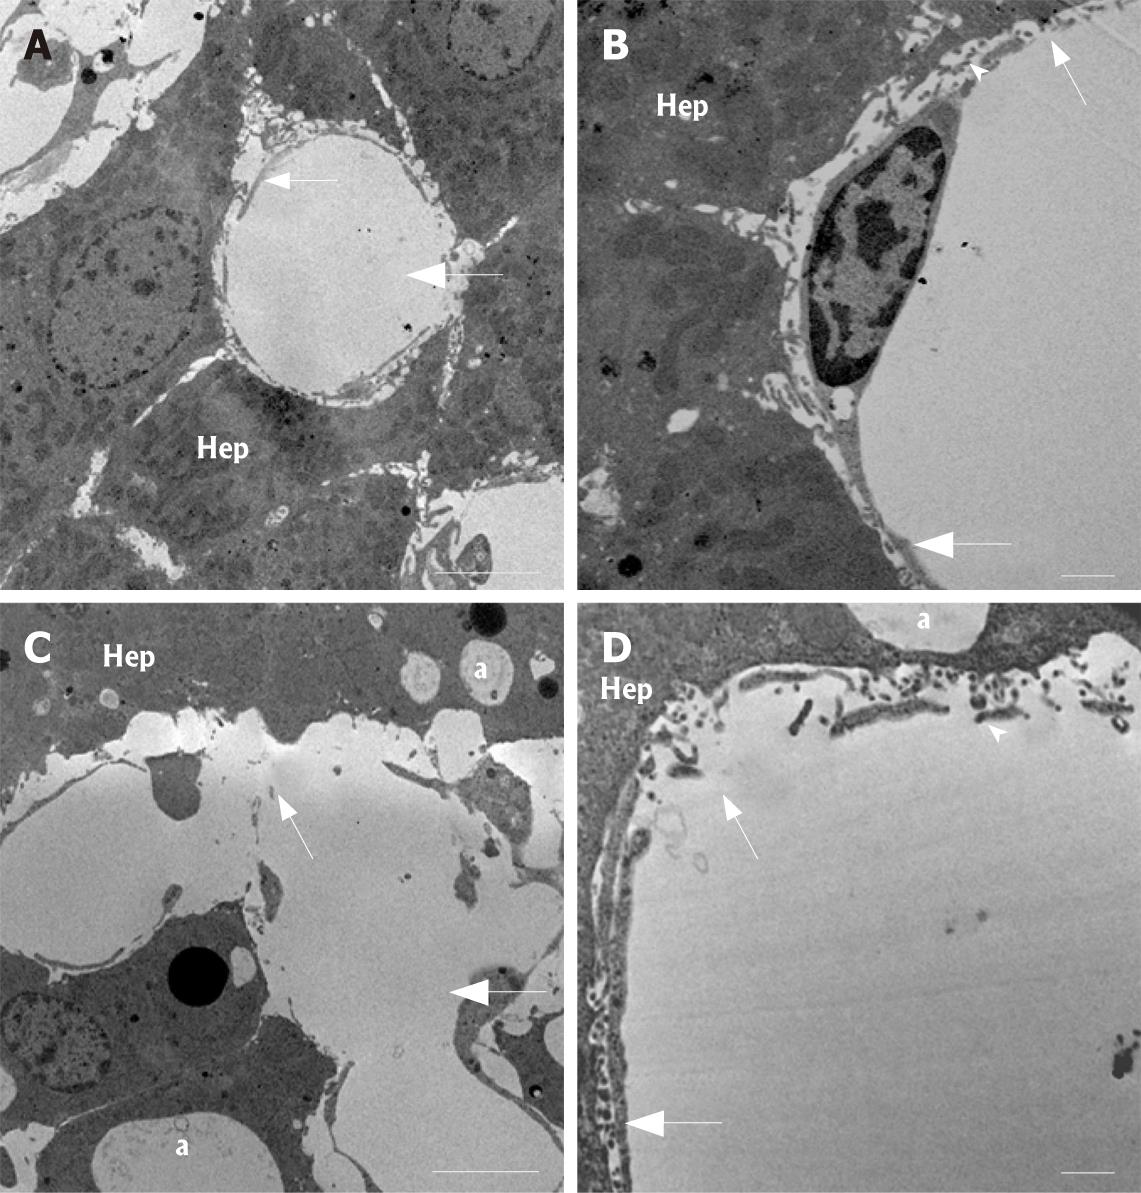
Figure 4 Transmission electron micrographs of control (A and B) and kavain-treated livers (C and D).
Note, comparisons of these high-resolution TEM data with the corresponding low-magnification light microscopy images. A: Intermediate magnification reveals the intact histological relationship between the liver sinusoidal endothelium (small arrow) and the neighbouring liver parenchymal cells (Hep) of control liver tissue. Note the lumen (large arrow) of the small liver capillaries, also called the liver sinusoids. Scale bar, 5 micrometer; B: Examination of control samples at higher magnification reveals the intact endothelial lining (large arrow) containing the typical small transportation pores (fenestrae) (small arrow). Hep, hepatocytes; arrowhead, the space of Disse (defined as the space between the endothelial processes and the hepatocytes). Scale bar, 1 micrometer; C: Kavain-treated liver tissue samples at intermediate magnification shows strong signs of vacuolization of the hepatic tissue (a), sinusoidal endothelial damage (small arrow). Large arrow, liver sinusoids; Hep, hepatocytes or liver parenchymal cells. Scale bar, 5 micrometer; D: High magnification of liver tissue of kavain-treated rats confirm the earlier SEM observations with respect to large gap formation of the endothelial lining (small arrow). Large arrow, sinusoids; arrowhead, space of Disse; asterisk, vacuolization. Scale bar, 1 micrometer.
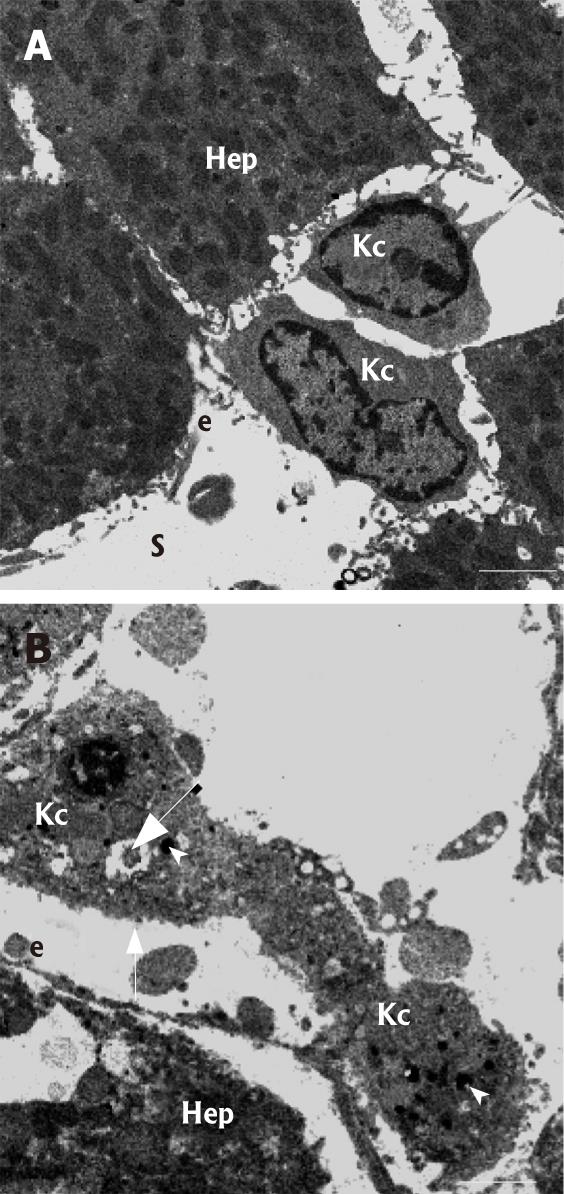
Figure 5 High-magnification transmission electron micro-graphs of Kupffer cells (Kc) in control (A) and kavain-treated livers (B).
A: Kupffer cells are located within the sinusoid (S) and adhere to the endothelial (e) lining by means of multiple cytoplasmic extensions. Note, hepatocytes (Hep); B: In kavain-treated livers, Kupffer cells (Kc) show an entire different ultrastructure when compared to control livers (see figure 4A for the difference): i.e., the cells look swollen, contain large amounts of electron dense phagocytosed material (arrowhead), have large vacuoles (large arrow), and have lost their ruffled and microvillous cell surface characteristics (small arrow). Scale bars, 5 micrometer.
- Citation: Fu S, Korkmaz E, Braet F, Ngo Q, Ramzan I. Influence of kavain on hepatic ultrastructure. World J Gastroenterol 2008; 14(4): 541-546
- URL: https://www.wjgnet.com/1007-9327/full/v14/i4/541.htm
- DOI: https://dx.doi.org/10.3748/wjg.14.541


