Copyright
©2008 The WJG Press and Baishideng.
World J Gastroenterol. Jan 28, 2008; 14(4): 532-540
Published online Jan 28, 2008. doi: 10.3748/wjg.14.532
Published online Jan 28, 2008. doi: 10.3748/wjg.14.532
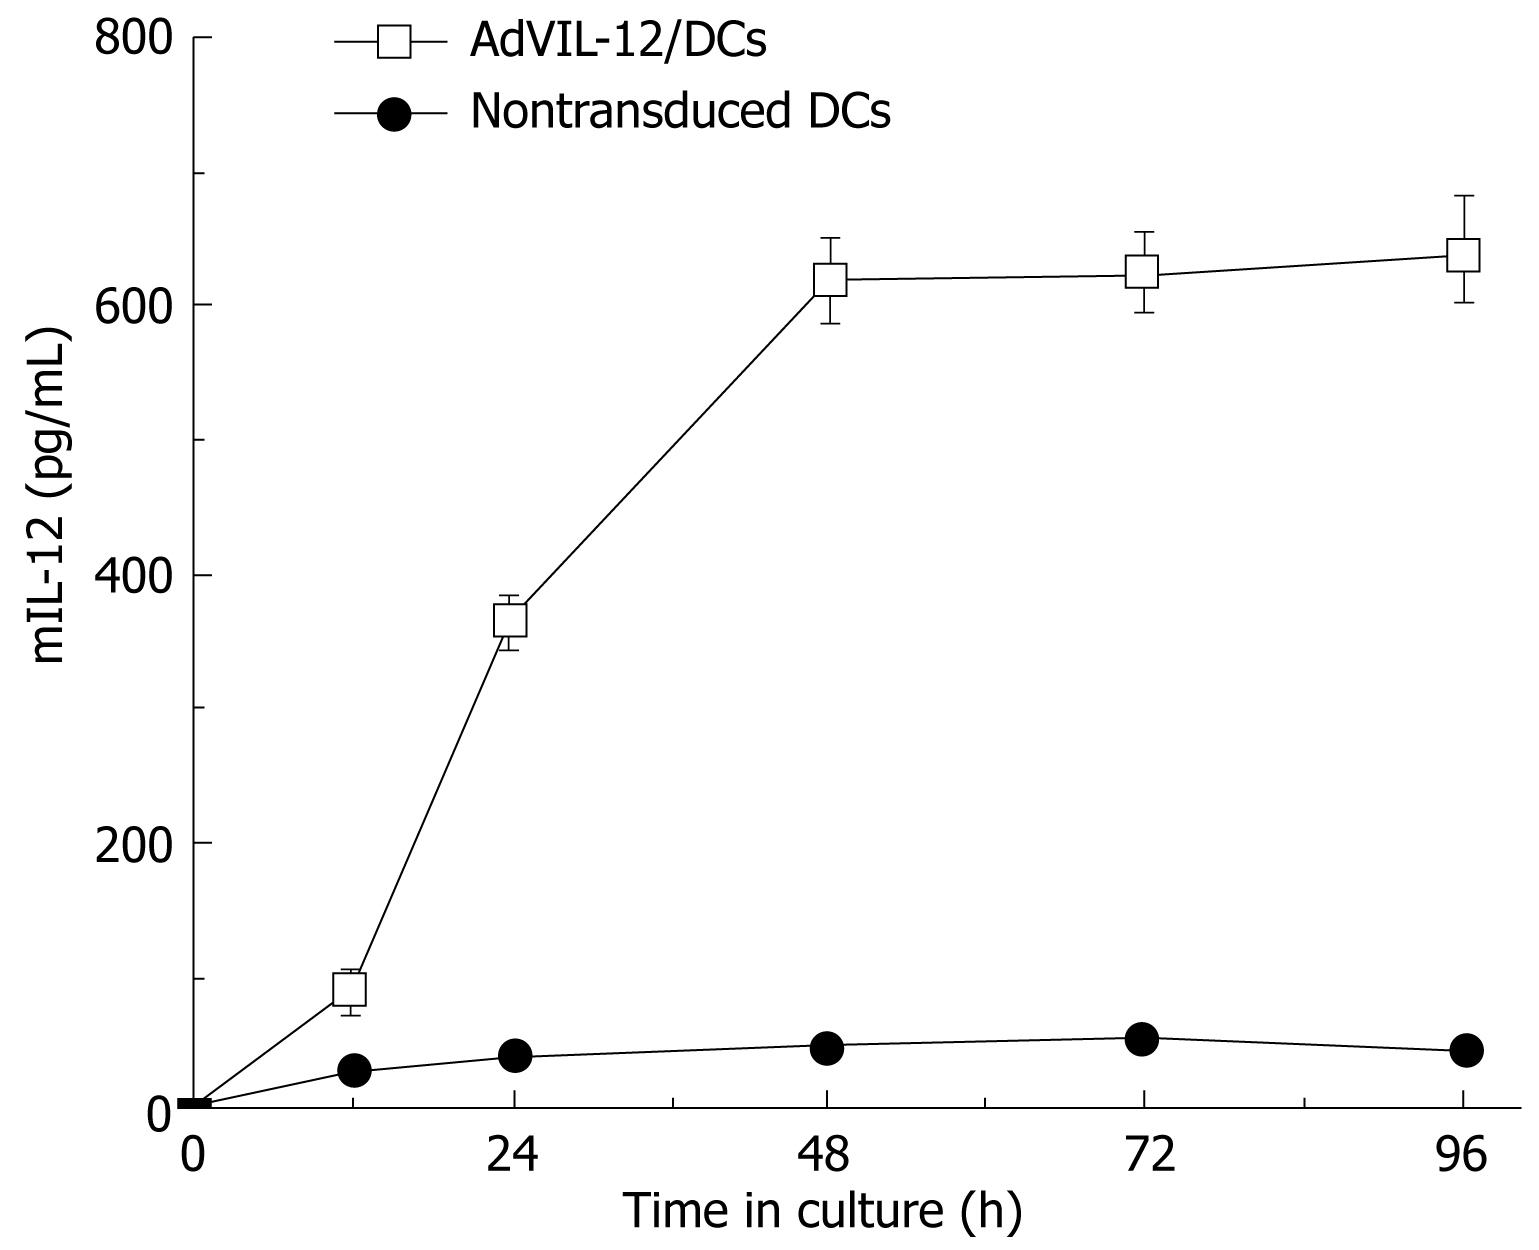
Figure 1 IL-12 production by the DCs transduced with AdVIL-12.
DCs and AdVIL-12 were incubated together at different time intervals (0 h, 12 h, 24 h, 48 h, 72 h, 96 h). Supernatant was collected and tested for mIL-12 by ELISA, with nontransduced DCs as control. Data is representative of two independent experiments, with a given as mean ± SE.
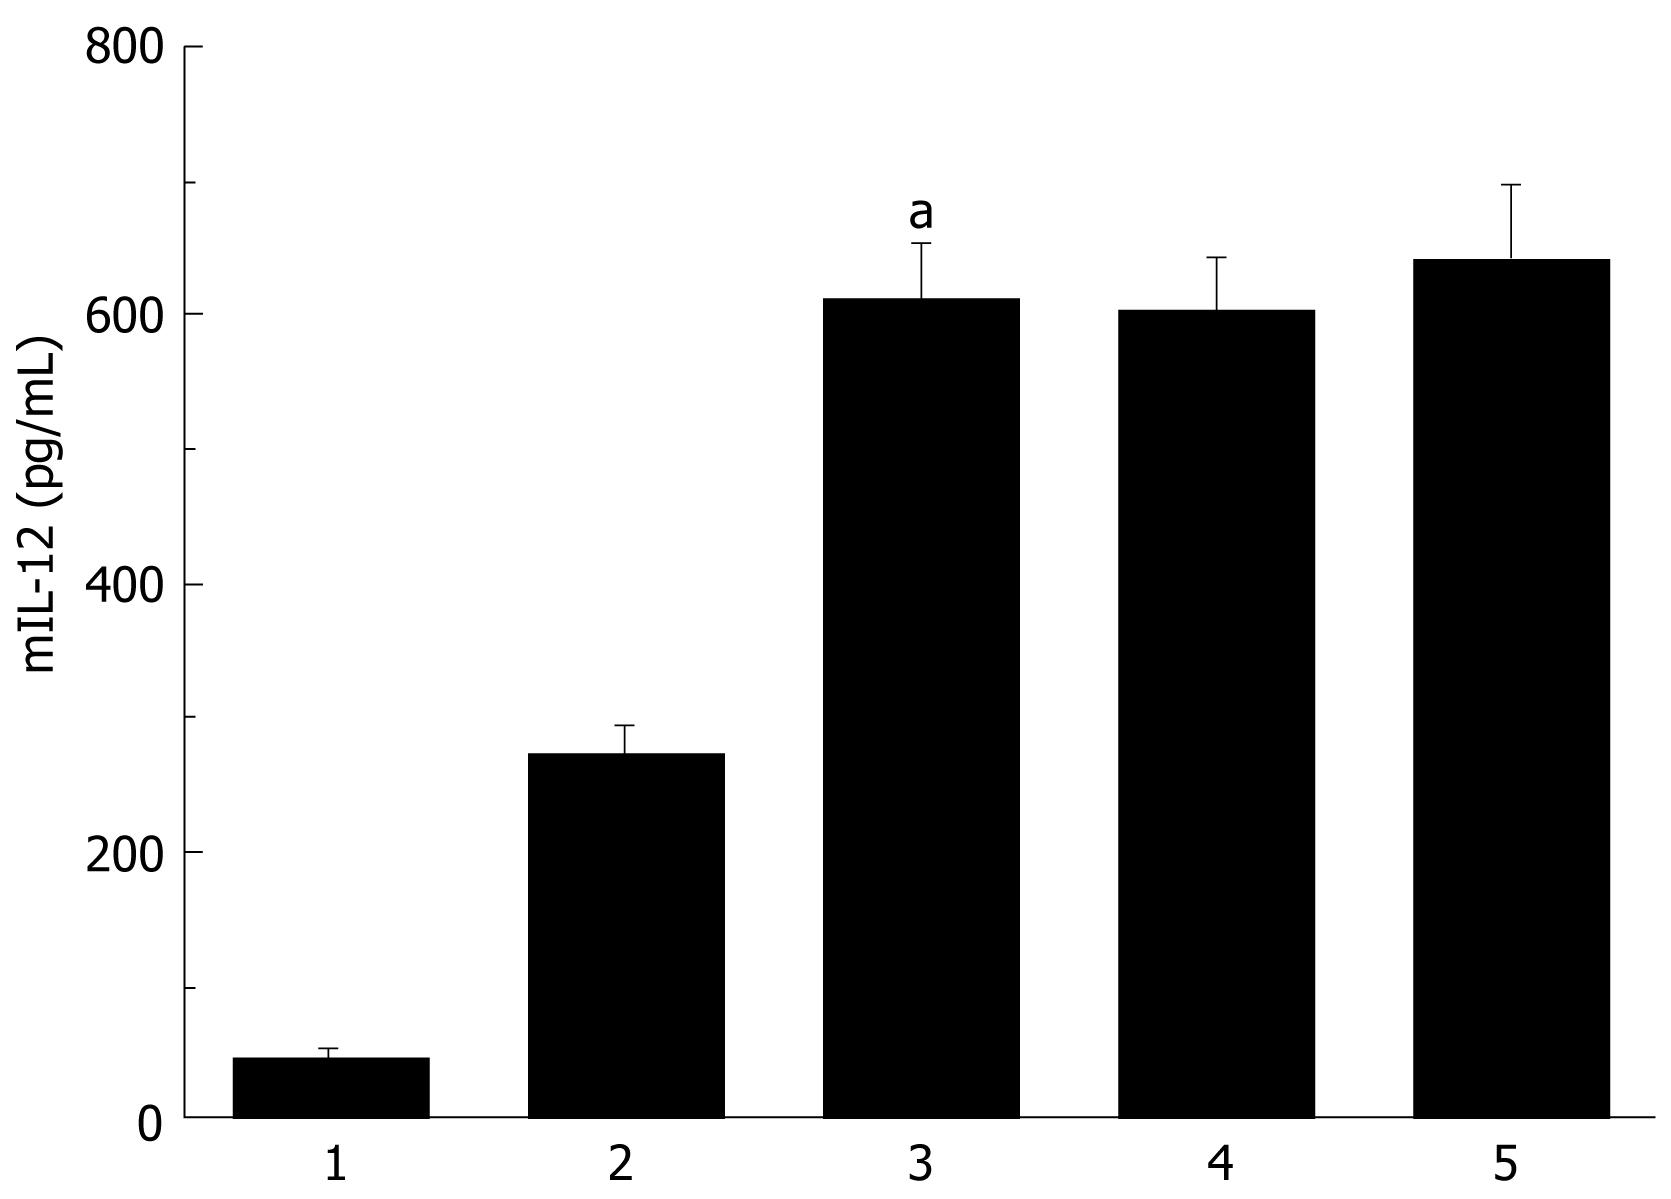
Figure 2 IL-12 production by the DCs transduced with AdVIL-12.
BM-DCs was transduced with AdVIL-12 at various doses. DCs supernatant was examined 48 hrs later for the IL-12 production by ELISA, with nontransduced DCs was as control. Statistical analysis used the paired Student’s t test. Data are given as mean ± SE. aP < 0.05 AdVIL-12/DCs (MOI 100) compared with nontransduced DCs or AdVIL-12/DCs (MOI 50). 1: Nontransduced DCs. 2: AdVIL-12/DCs (MOI 50). 3: AdVIL-12/DCs (MOI 100). 4: AdVIL-12/DCs (MOI 300). 5: AdVIL-12/DCs (MOI 500).
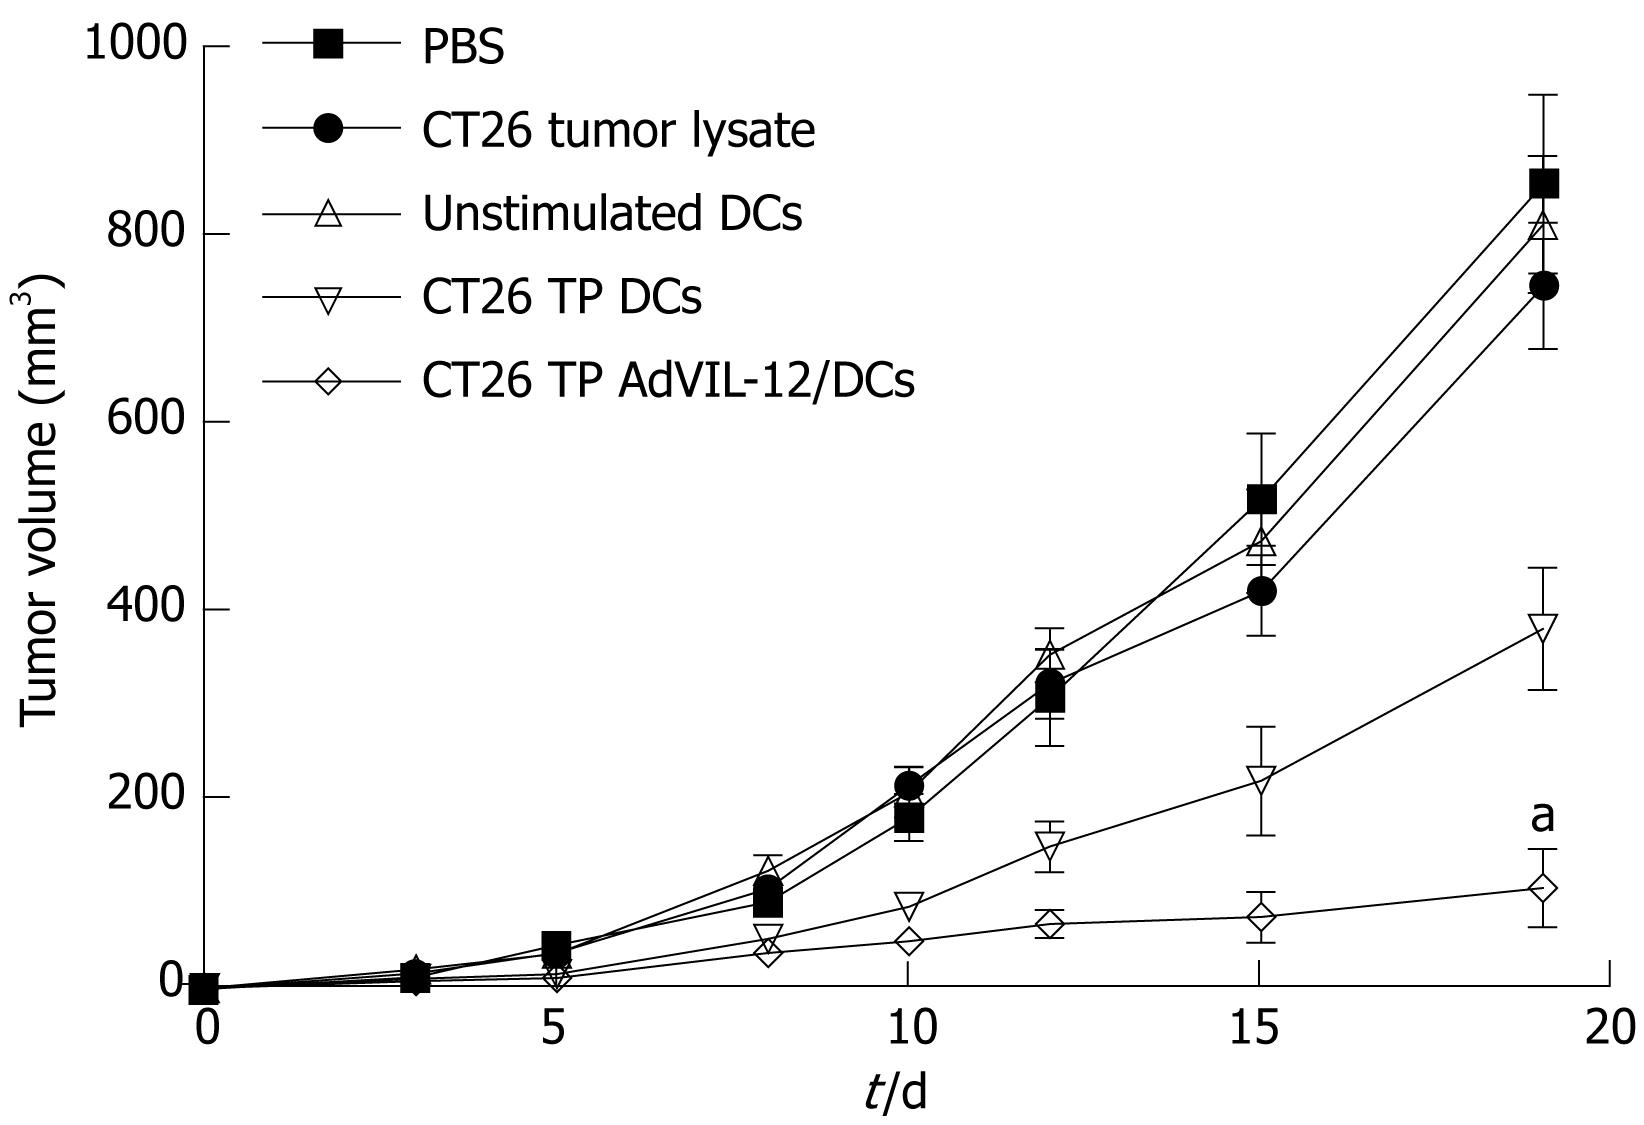
Figure 3 Vaccination with CT26 TP AdVIL-12/DCs enhances anti-tumor immunity in therapeutic tumor models.
CT26 tumor cells (5 × 10⁵ cells per mouse) were implanted s.c. in the midflank of naïve BALB/c mice. On d 3 and 10, tumor-bearing mice were injected with 1 × 10⁶ DCs vaccination with CT26 TP AdVIL-12/DCs. As control, tumor bearing mice were treated in parallel with CT26 TP DCs, unstimulated DCs, CT26 tumor lysate alone, or PBS alone. Tumor growth was assessed by calipers every 2-3 d thereafter. Tumor volume was estimated by the formula 4/3 πr3. Statistical analysis used the paired Student’s t test. Data are given as mean ± SE (n = 10 mice in each group). aP < 0.05, CT26 TP AdVIL-12/DCs vs CT26 TP DCs or the other control groups (d 19).
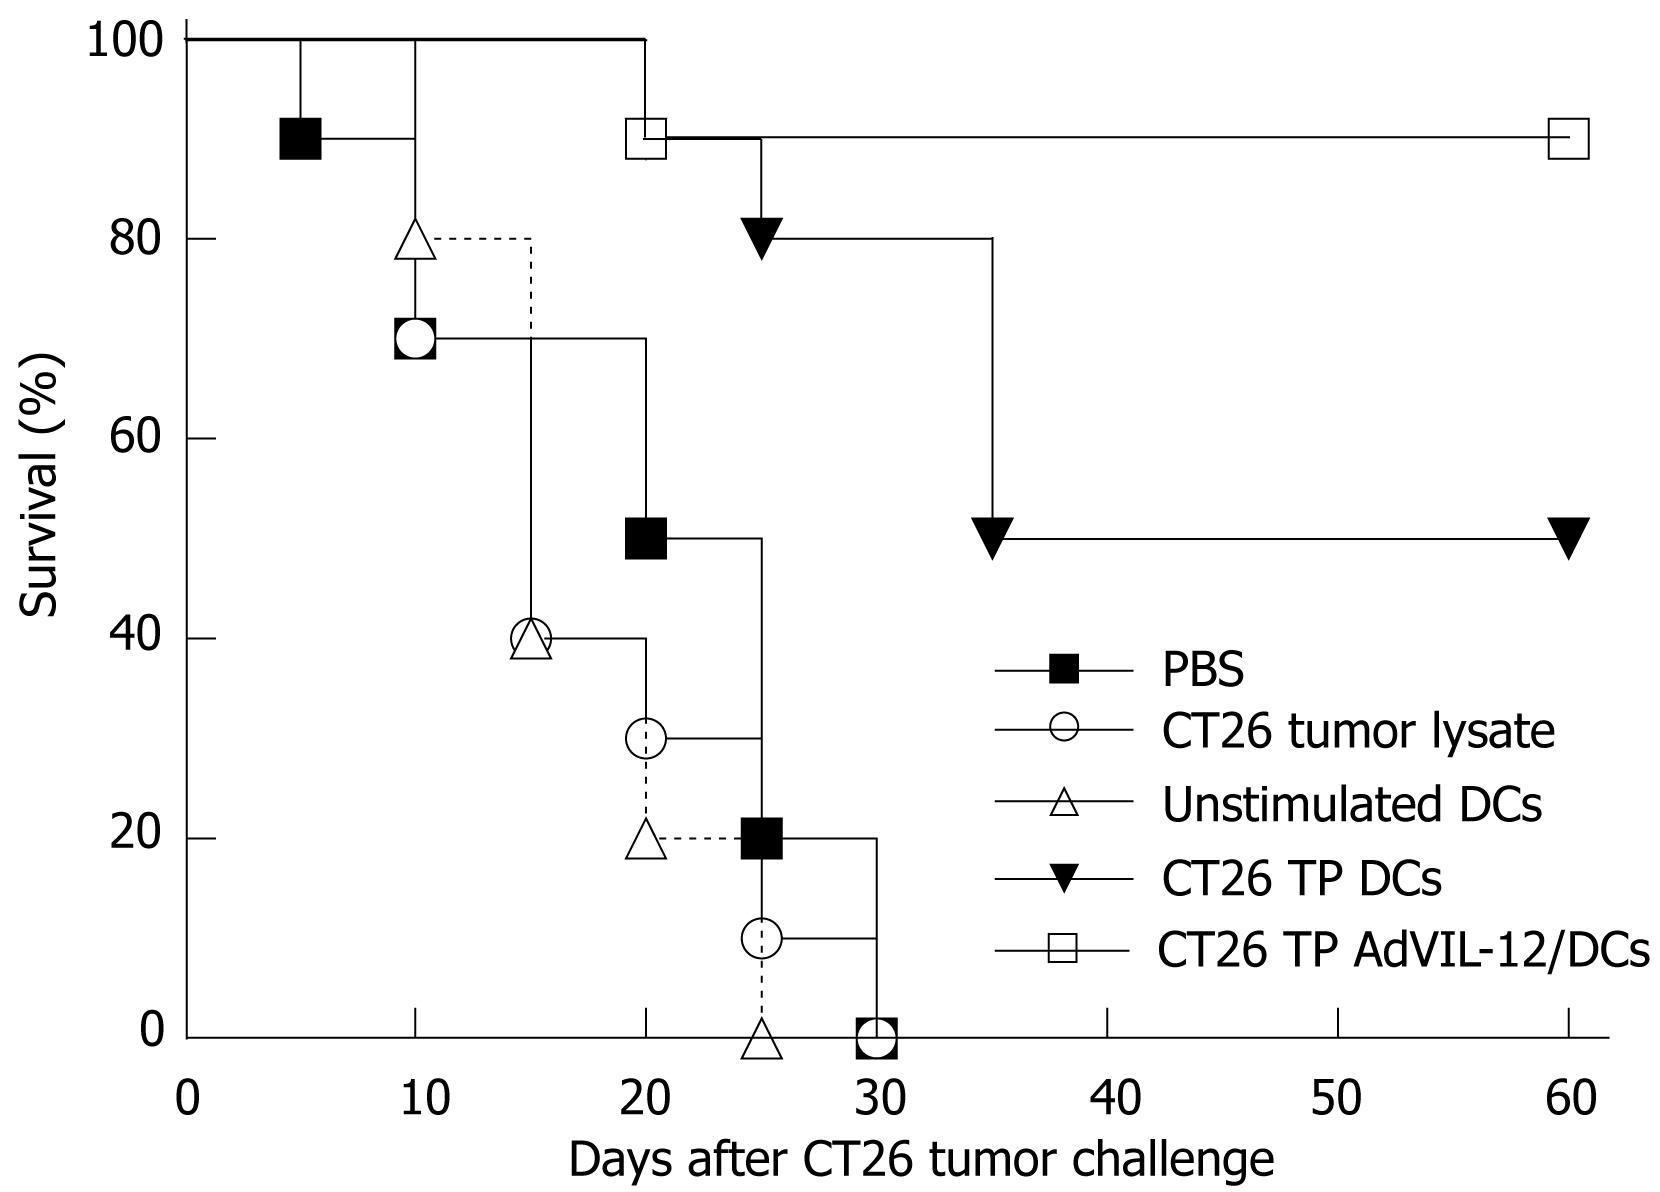
Figure 4 Protective effect of CT26 TP AdVIL-12/DCs in CT26 tumor models.
Naïve BALB/c mice were injected s.c. in their abdominal walls on d 0, 7, and 14 with 1 × 10⁶ DCs vaccination: CT26 TP AdVIL-12/DCs or CT26 TP DCs. Mice injected with unstimulated DCs, CT26 tumor lysate alone, and PBS alone were used as controls. On d 21, each mouse was challenged s.c. with a lethal dose of 2 × 10⁶ CT26 cells. Survival was observed after the challenge with tumor cells. Survival rate was compared with a log-rank test of Kaplan-Meier curves. The survival advantage conferred by the CT26 TP AdVIL-12/DC was statistically significant compared with CT26 TP DCs group and other control groups (Kaplan-Meier, P < 0.05).
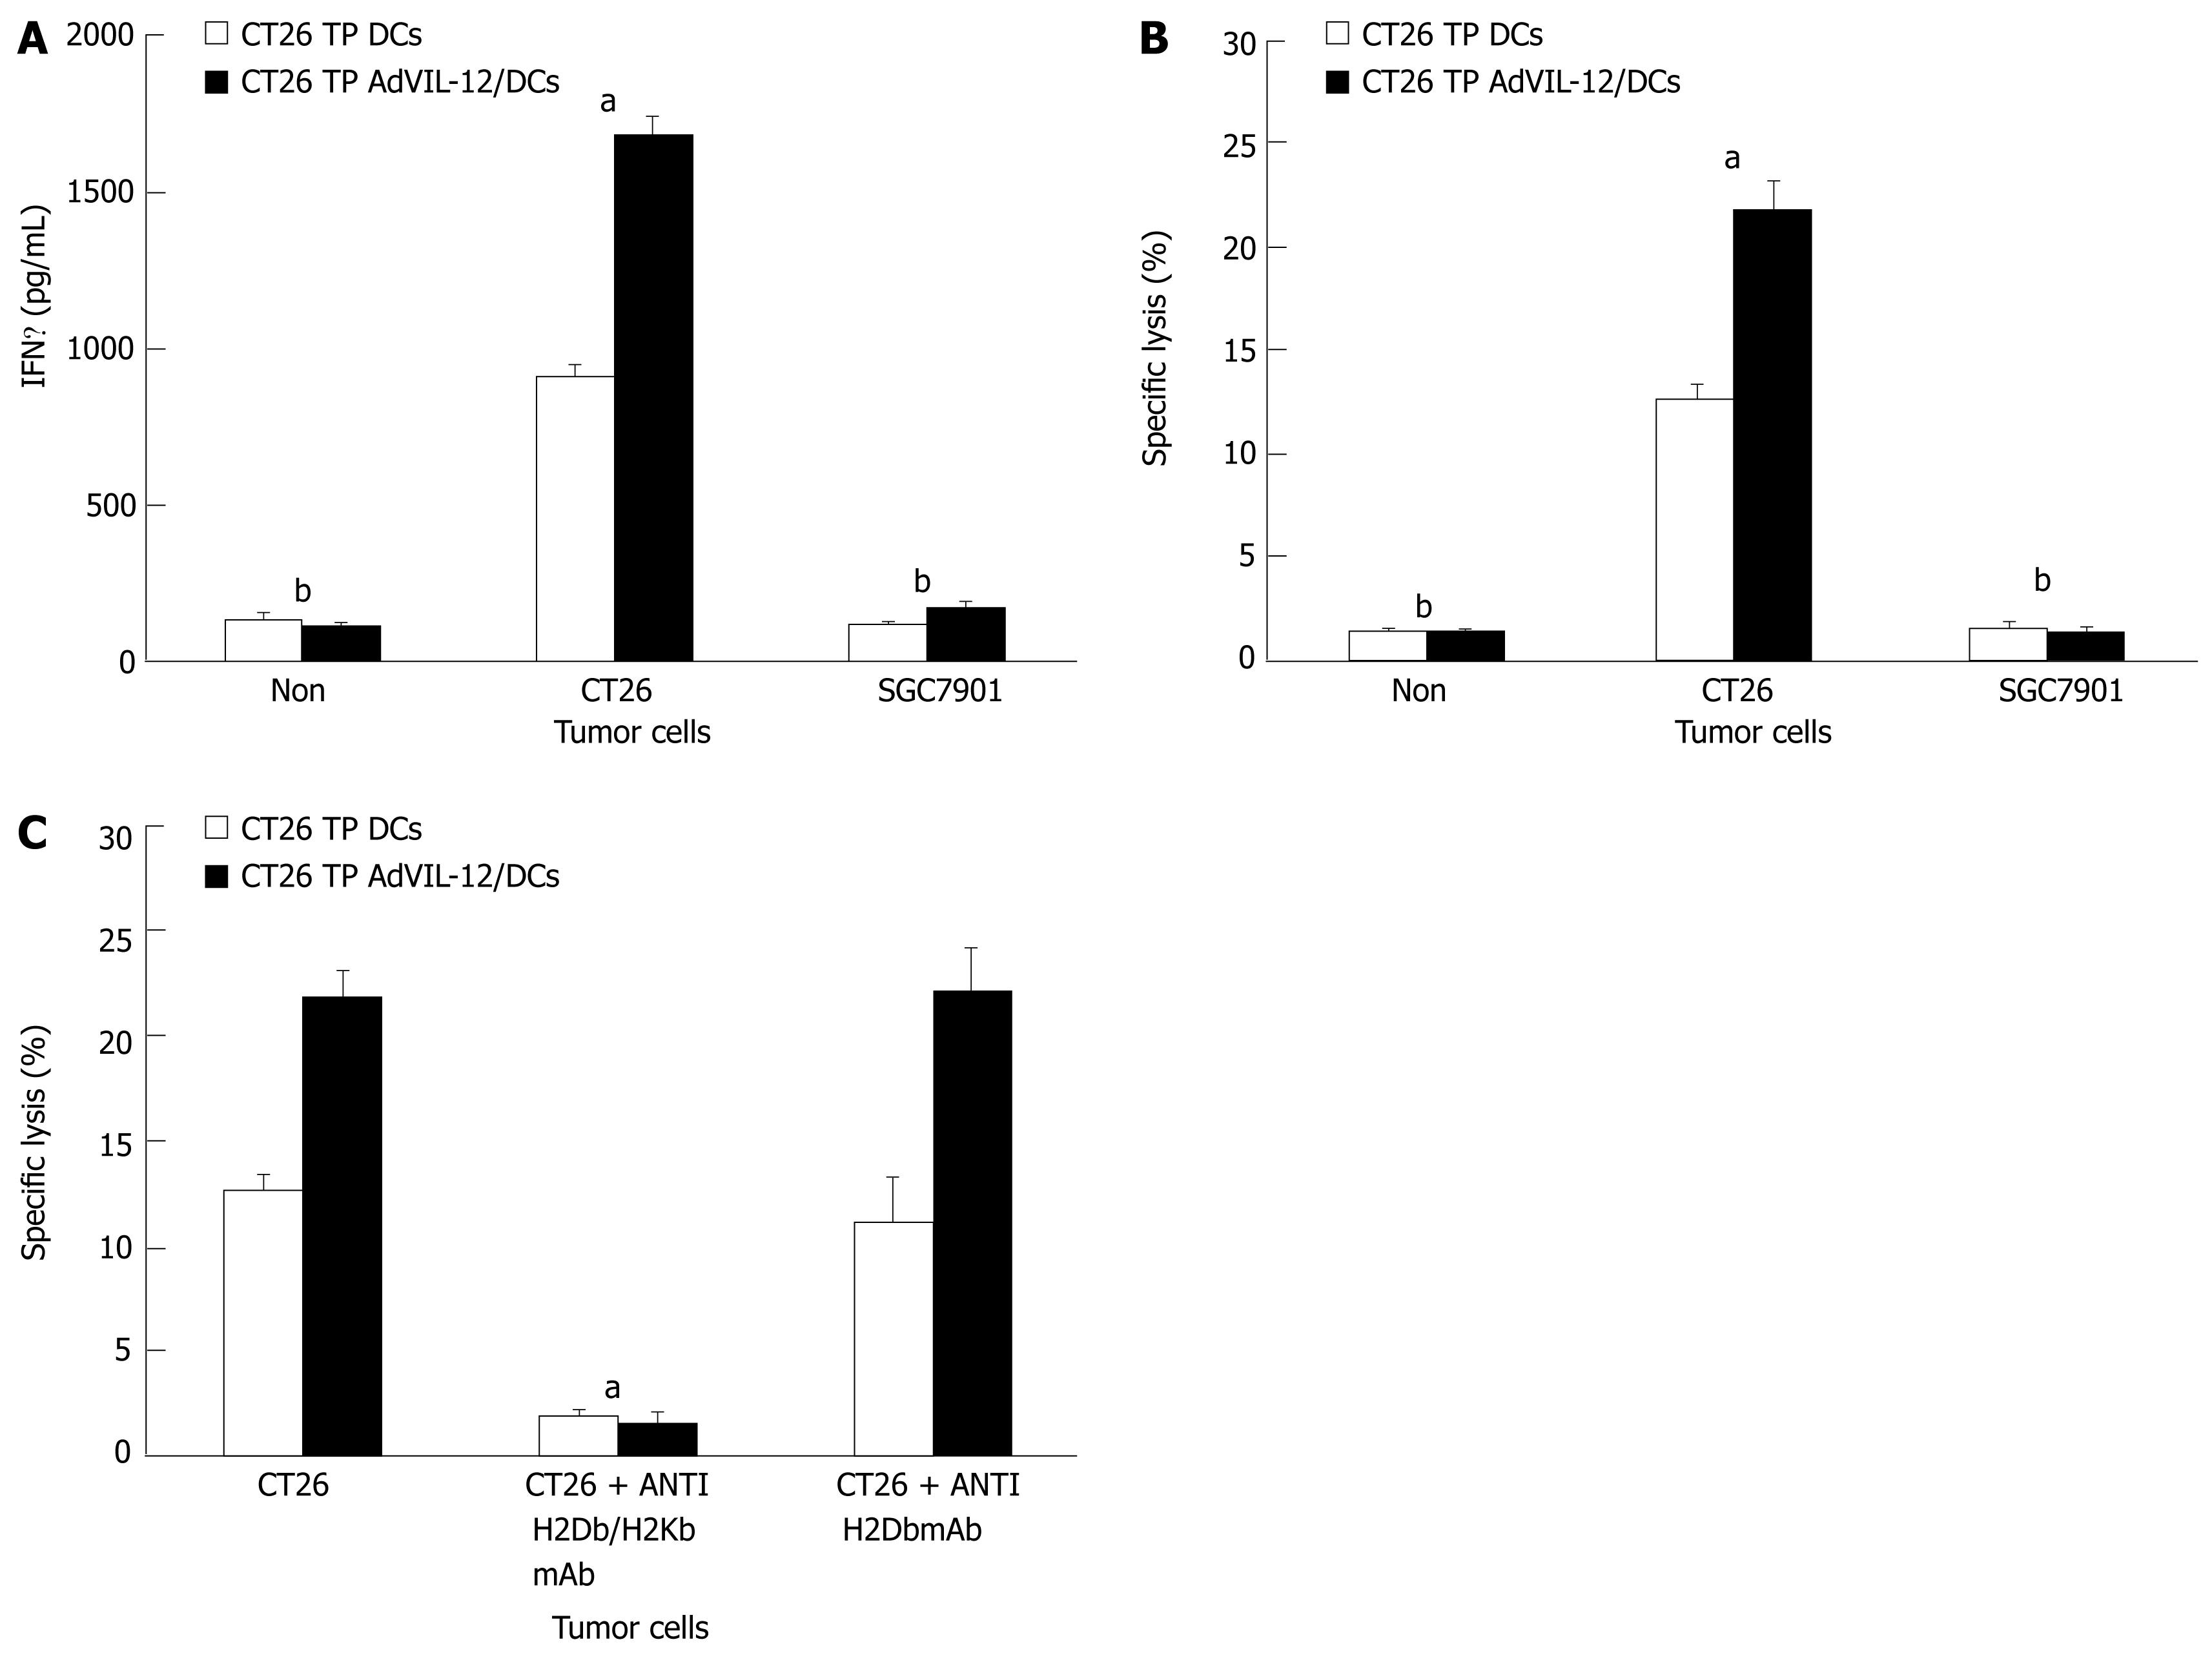
Figure 5 Assays for IFNγ secretion and tumor-specific CTL activity in the immunized mice.
Splenic CD3+ T cells from mice that survived the CT26 tumor challenge until d 61 in protective models were magnetically isolated. CD3+ T cells were restimulated ex vivo by culturing with the MMC-treated CT26 tumor cells. Then these restimulated effector T cells were added to the wells containing target CT26 or SGC-7901 tumor cells in 96-well plates. After 20 h, supernatant from each well was collected for measuring IFNγ production with the mouse IFNγ ELISA kit (A), and for measuring cytolytic activity with a Cytotoxicity Detection Kit (B). In some experiments, the target CT26 tumor cells were incubated with a MAb to MHC classImolecules (anti-H2Db/H2Kb) or with control antibody (anti-H2Dd) before the addition of restimulated effector T cells to evaluate the specificity of CTL activity. Statistical analysis used the paired Student’s t test. Data are given as mean ± SE. A, B aP < 0.05, CT26 TP AdVIL-12/DCs compared with CT26 TP DCs in the CT26 groups, bP < 0.01 CT26 vs SGC7901 or Non, respectively. (C), aP < 0.05, CT26 + antiH-2kb/DbmAb vs CT26 or CT26 + antiH-2DbmAb, respectively.
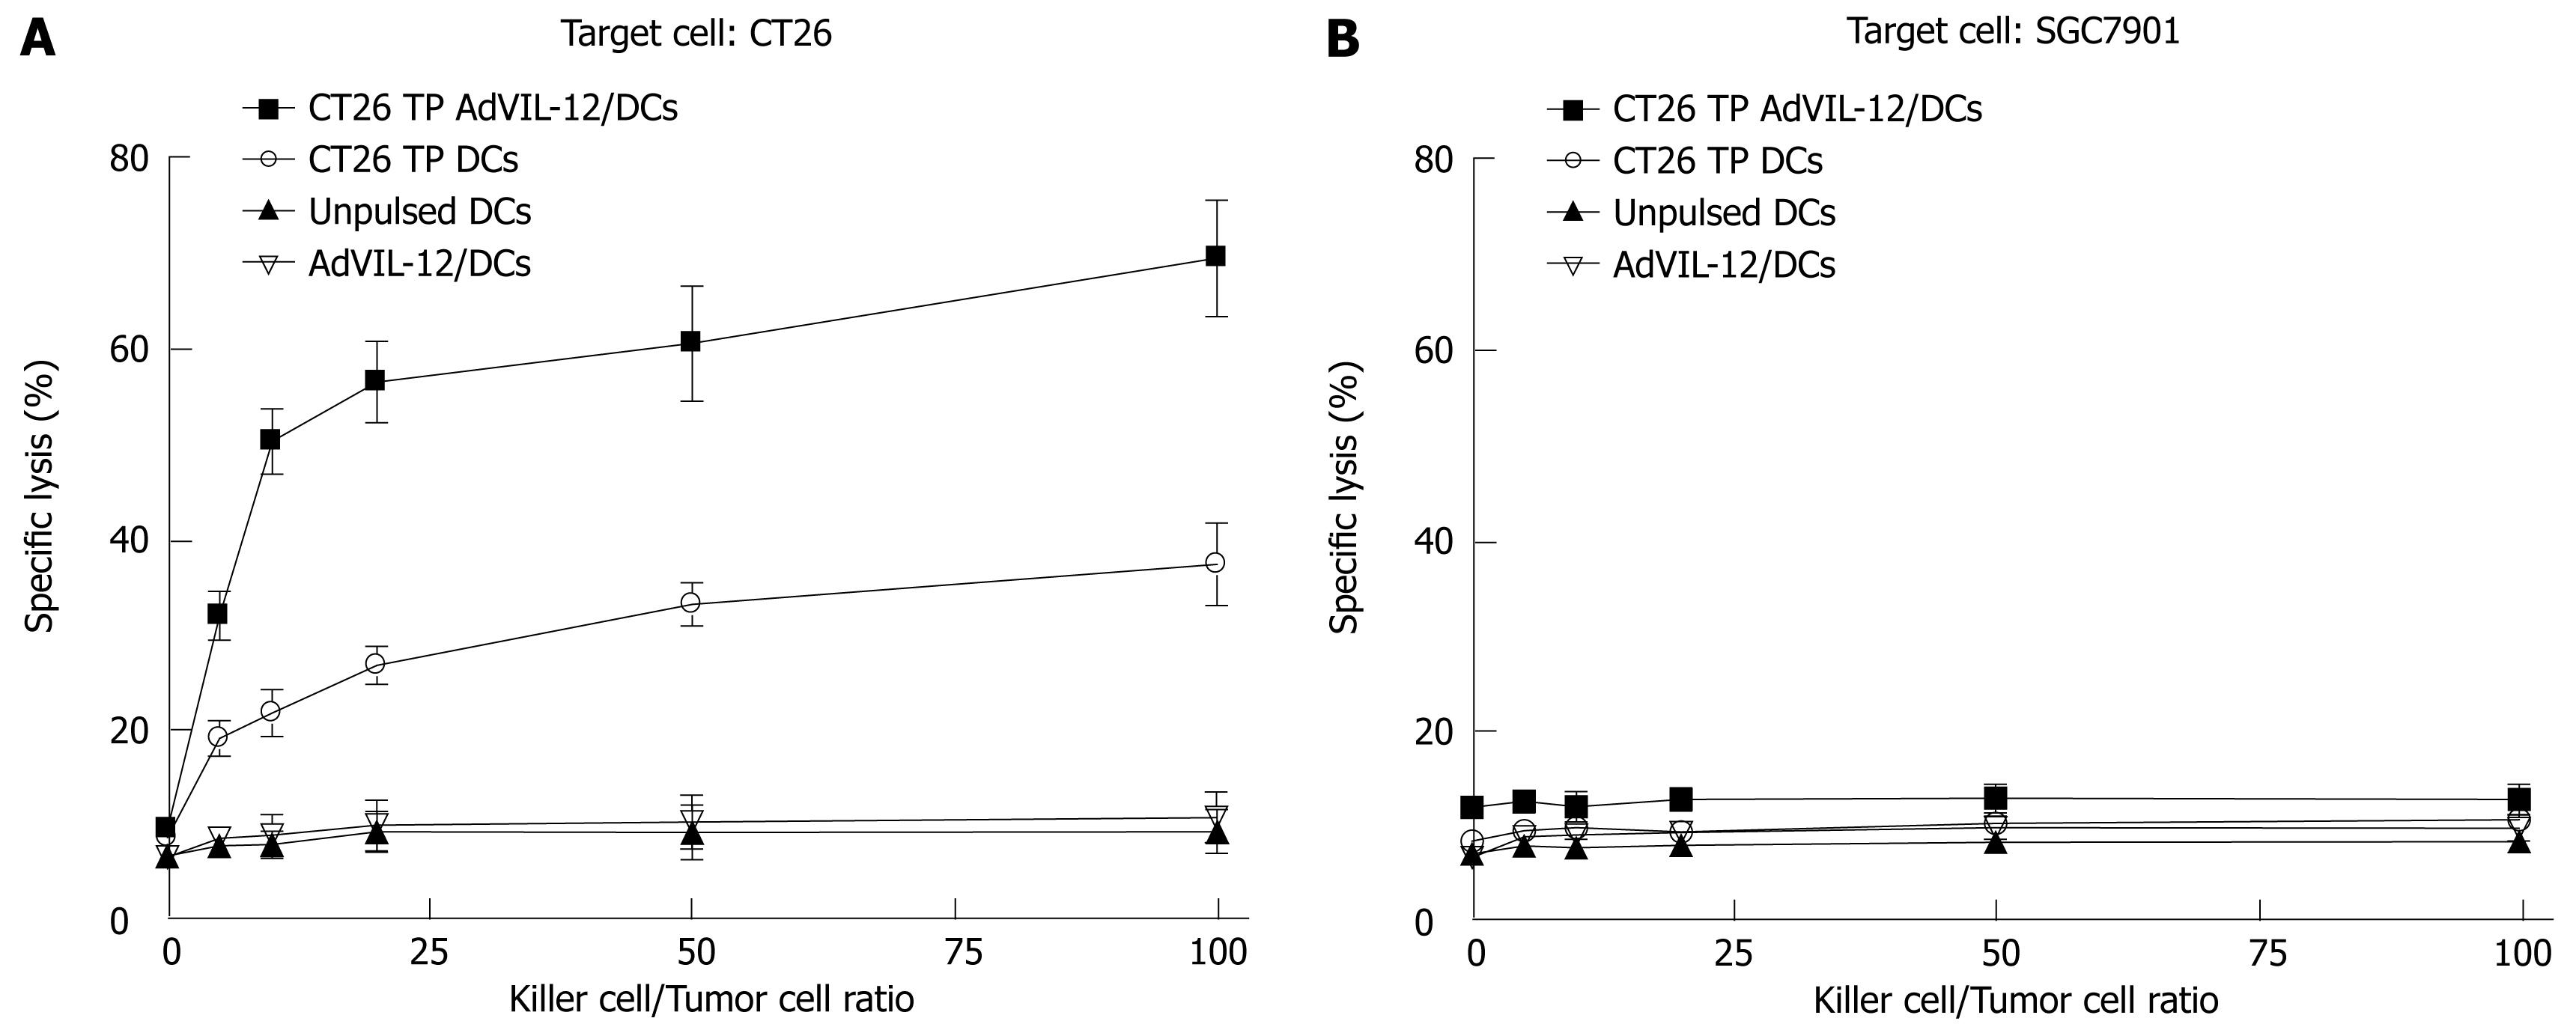
Figure 6 Generation of tumor-specific cytotoxic T cells ex vivo.
Splenic CD3+ T cells were magnetically isolated from naïve BALB/c mice. These cells were cultured ex vivo in the presence of cytokines including IL-2 and IL-7 and with CT26 TP AdVIL-12/DCs or CT26 TP DCs at a stimulator to responder cell ratio of 1:20. The primed T cells were effector cells, CT26 or SGC-7901 tumor cells were target cells. Then these effector T cells were titrated by serial dilution (E-T mix, E:T 1:1, 5:1, 10:1, 25:1, 50:1, 100:1), and their lytic activity against CT26 or SGC-7901 were assayed by a Cytotoxicity Detection Kit. Statistical analysis used the paired Student’s t test. Data are given as mean ± SE. A aP < 0.05, CT26 TP AdVIL-12/DCs vs CT26 TP DCs or other control groups in the CT26 groups.
- Citation: He XZ, Wang L, Zhang YY. An effective vaccine against colon cancer in mice: Use of recombinant adenovirus interleukin-12 transduced dendritic cells. World J Gastroenterol 2008; 14(4): 532-540
- URL: https://www.wjgnet.com/1007-9327/full/v14/i4/532.htm
- DOI: https://dx.doi.org/10.3748/wjg.14.532


