Copyright
©2008 The WJG Press and Baishideng.
World J Gastroenterol. Oct 21, 2008; 14(39): 6044-6051
Published online Oct 21, 2008. doi: 10.3748/wjg.14.6044
Published online Oct 21, 2008. doi: 10.3748/wjg.14.6044
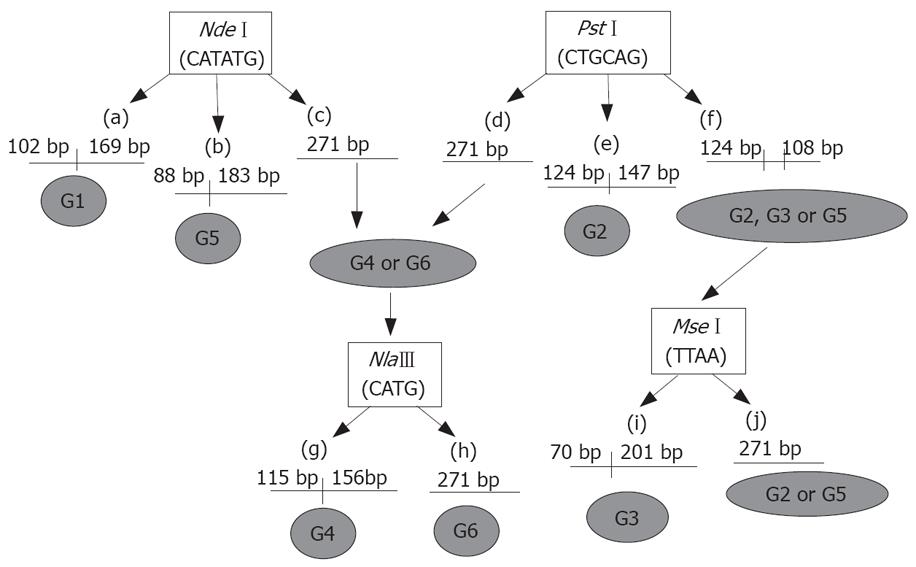
Figure 1 Strategy for RFLP analysis (Tanaka et al[24], 1998).
Figure 2 TTV detection by PCR (ORF2: nt 107-712).
Amplifiction of ORF-2 region of TTV-DNA using NS1, NS2, NS3 and NS4 primers. (Biagini et al[23], 1999. Accession No.: AB008394)
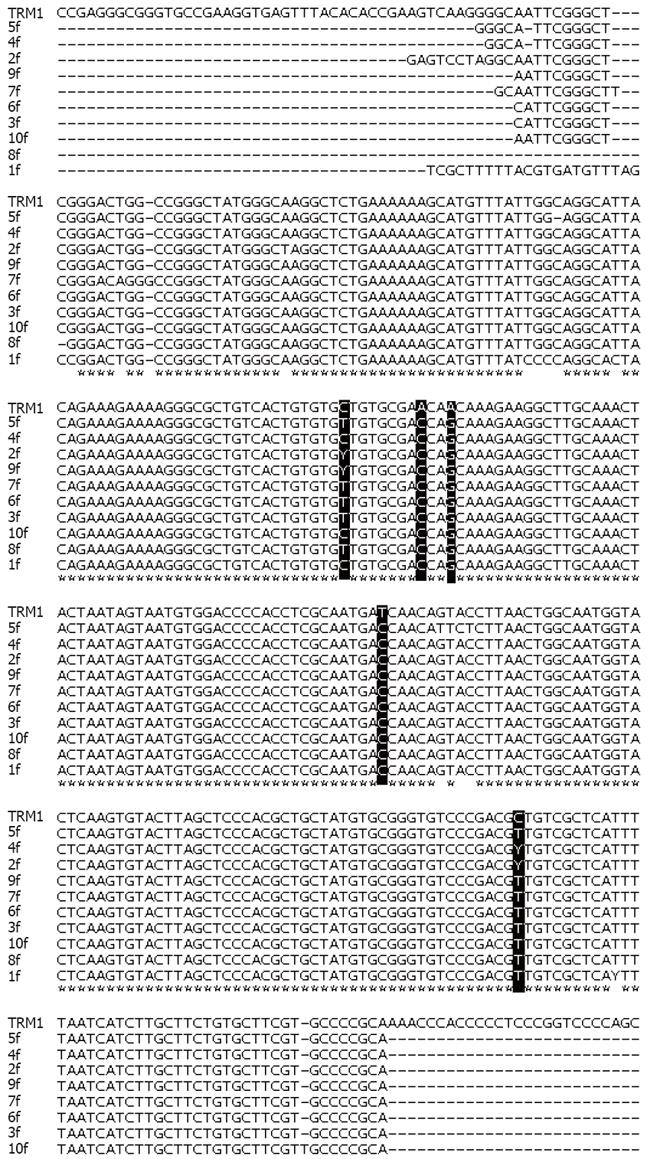
Figure 3 Sequence analysis of amplicons and their comparison with TRM1 isolates of Genotype 1 (ORF2: nt 107-712).
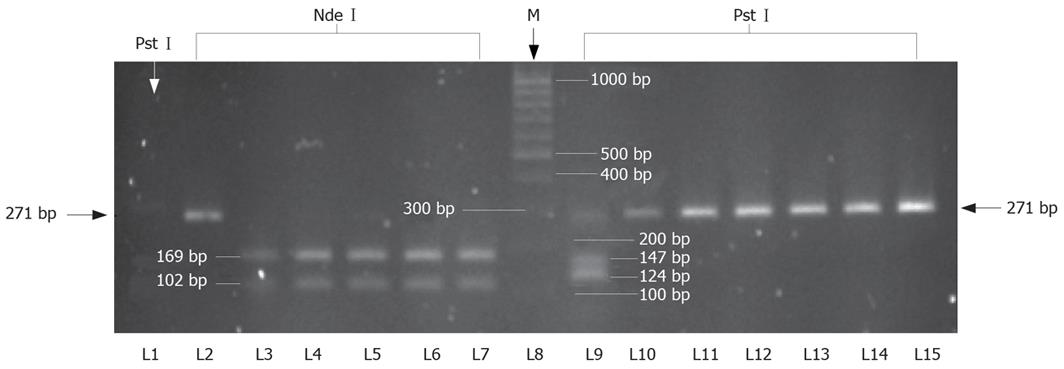
Figure 4 RFLP pattern of N22 region of TTV-DNA.
L1-15: Lane 1 to lane 15. L1 is Pst I undigested product (271 bp), L2 is Nde I undigested product (271 bp), L3-7 is Nde I degested product resulting in 102 bp & 169 bp fragments, L8 is marker, L9 is Pst I digested product resulting in fragments of 124 bp & 147 bp size, L10-15 is Pst I undigested product (271 bp).
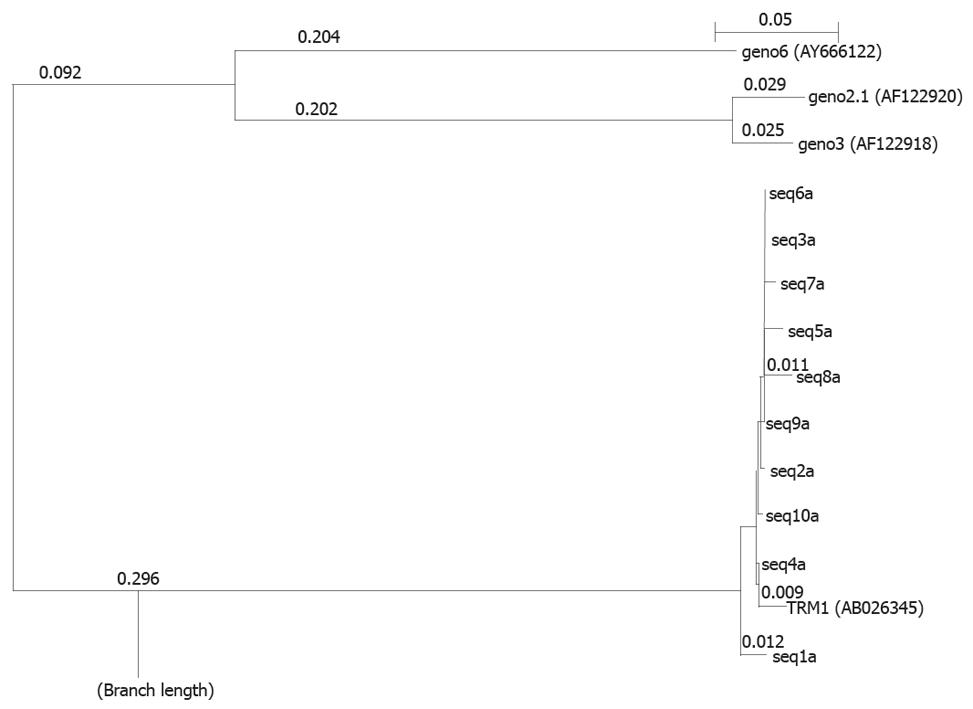
Figure 5 Phylogenetic tree analysis of amplicons with known TTV genotypes.
- Citation: Irshad M, Singh S, Irshad K, Agarwal SK, Joshi YK. Torque teno virus: Its prevalence and isotypes in North India. World J Gastroenterol 2008; 14(39): 6044-6051
- URL: https://www.wjgnet.com/1007-9327/full/v14/i39/6044.htm
- DOI: https://dx.doi.org/10.3748/wjg.14.6044


