Copyright
©2008 The WJG Press and Baishideng.
World J Gastroenterol. Oct 21, 2008; 14(39): 6036-6043
Published online Oct 21, 2008. doi: 10.3748/wjg.14.6036
Published online Oct 21, 2008. doi: 10.3748/wjg.14.6036
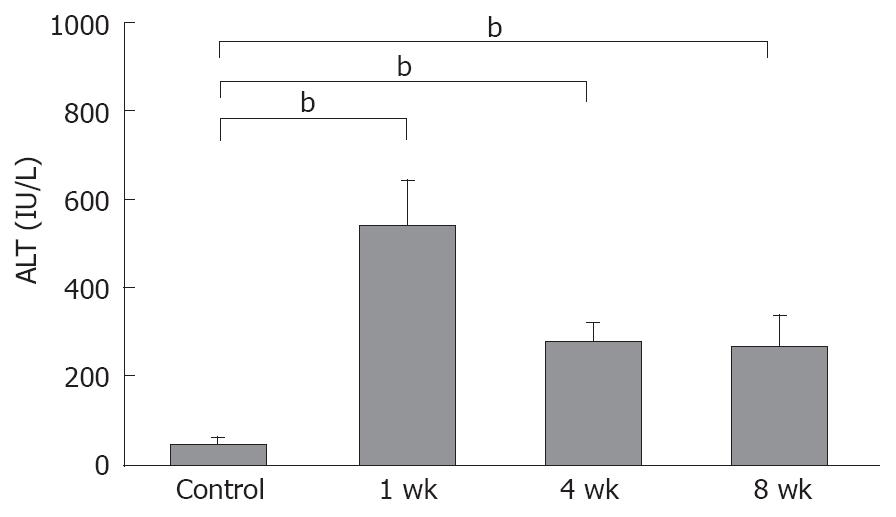
Figure 1 Serum ALT levels were elevated significantly in 1-wk CDAA-fed rats, and decreased gradually in the 4 and 8-wk CDAA-fed rats, although, both were elevated significantly compared with the control animals (n = 5), bP < 0.
01.
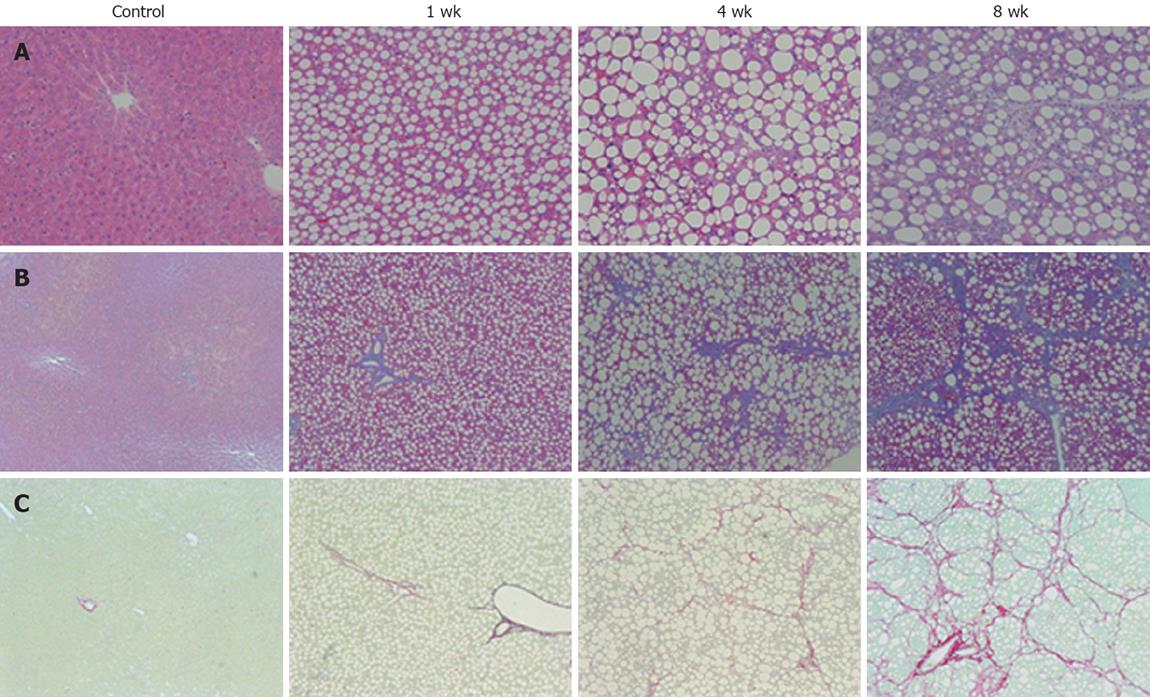
Figure 2 Histological analysis of the liver sections.
A: Hematoxylin and eosin stain (× 200); B: Azan stain (× 100); C: Sirius red stain (× 100). Histological examination of the liver tissue of 1-wk CDAA-fed rats showed inflammation and fat deposits, but no fibrosis, corresponding to Matteoni’s type 2. The 4-wk CDAA-fed rats had more inflammation, fat deposits, and fibrosis, which was equivalent to Matteoni’s type 3 and grade 2/stage 2 of Brunt’s NASH classification. The histological findings in the 8-wk CDAA-fed rats were equivalent to Matteoni’s type 4 and Brunt’s grade 2/stage 3. In the 4 and 8-wk groups, Sirius red staining revealed abundant collagen (n = 5).
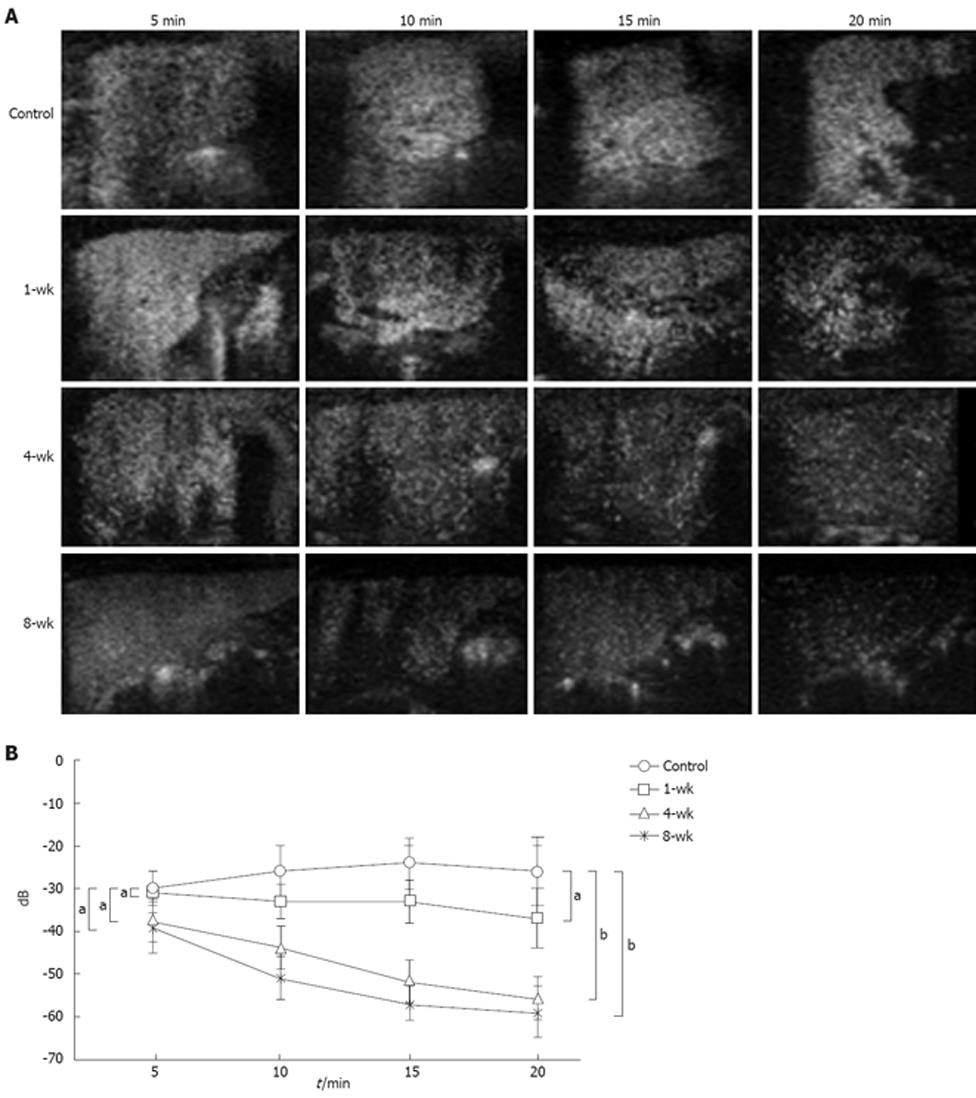
Figure 3 Results of Levovist® CEUS in each group.
A: Examination of changes in the fluorescent intensity up to 20 min after administration of Levovist®, with the values at 5 min considered as the standard, showed that the fluorescent intensity in the control group tended to rise from 10 min onwards, and remained elevated. In the 1-wk group, the contrast effect remained fairly constant from 5 min to 20 min. After 4 or more wk of the CDAA diet, CEUS examination revealed a decrease in the signal intensity, 20 min after intravenous Levovist®; B: Changes in the fluorescent intensity in Levovist® contrast enhanced ultrasonograms in each group. In the control group, the fluorescent intensity increased significantly at 20 min compared with the findings at 5 min, whereas a significant chronological decrease was seen in the NASH groups (n = 5). aP > 0.05, bP < 0.01.
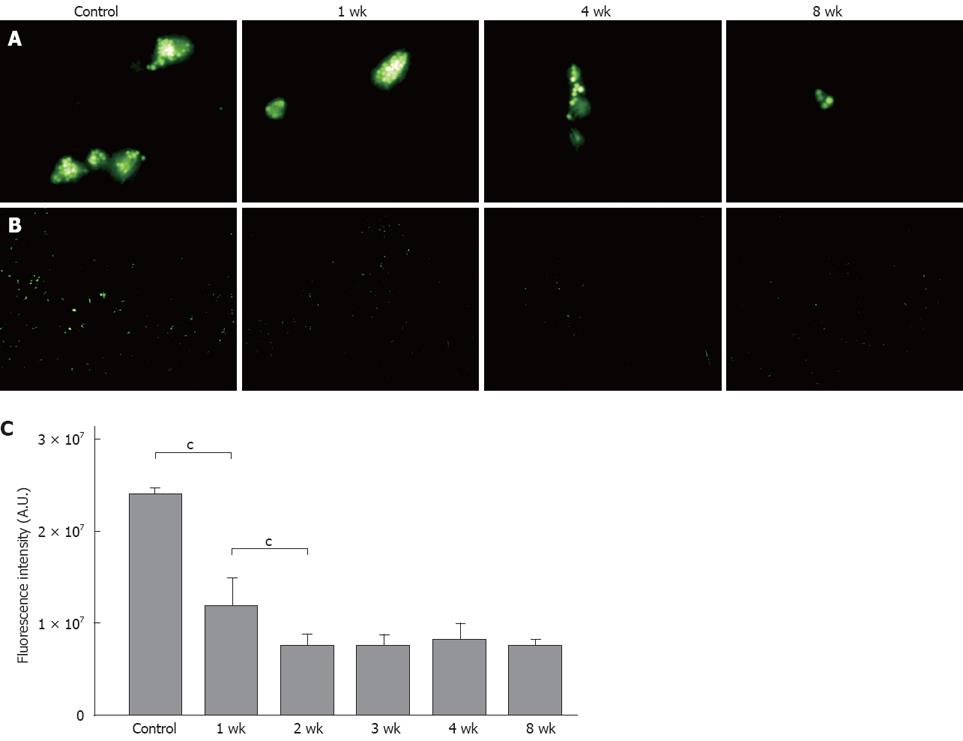
Figure 4 A: Fluorescence micrographs (× 1000).
In the control group, there was no uptake of multiple latex beads (phagocytic activity) by the triangular shaped Kupffer cells, whereas the latex bead uptake was reduced in the NASH groups; B: Phagocytosis of FITC-latex beads by Kupffer cells in vivo (× 100). Decreased latex bead uptake was seen in the NASH groups compared with the control group; C: When compared with the control group, fluorescence was reduced to approximately 50% in the 1-wk group, and to 30% in the 2-wk group, but there was no further decrease after 3 wk (n = 5). cP < 0.001.
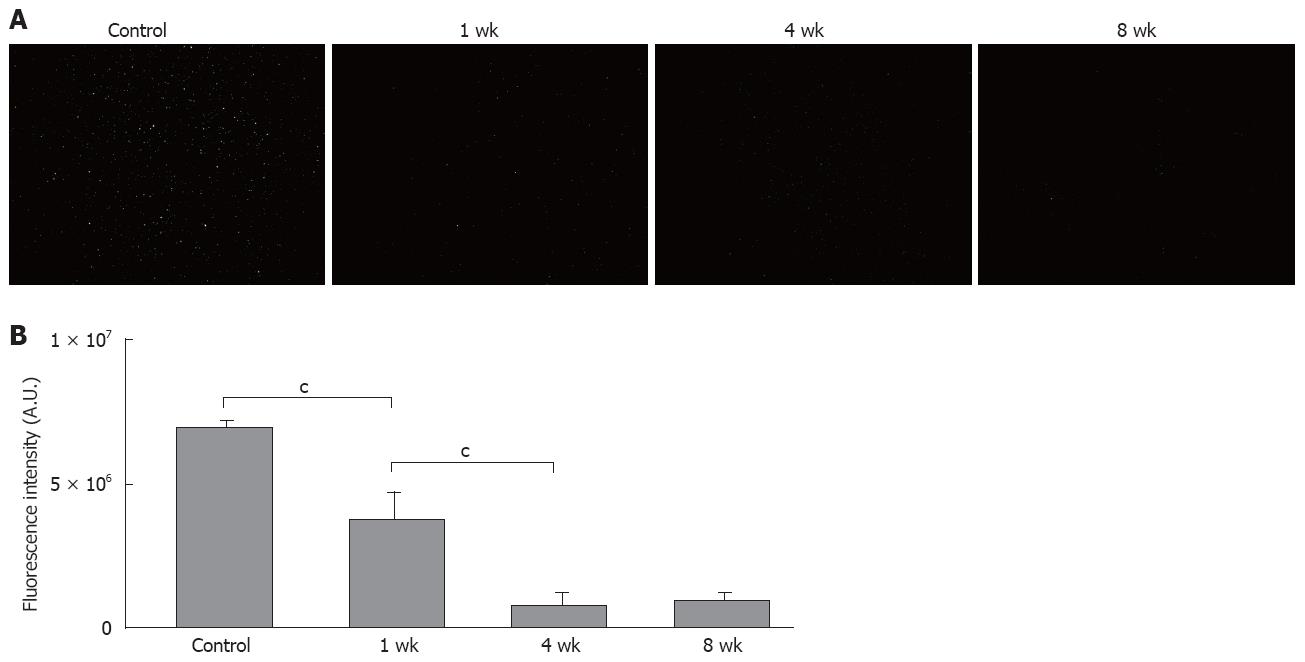
Figure 5 A: Phagocytosis of FITC-latex beads by the Kupffer cells in vitro (× 100).
There was reduced latex bead uptake in the NASH groups compared with the control group; B: When compared with the control group, fluorescence was reduced to approximately 60% in the 1-wk group, and to 30% in the 2-wk group, but no further decrease was observed after 4 wk (n = 5). cP < 0.001.
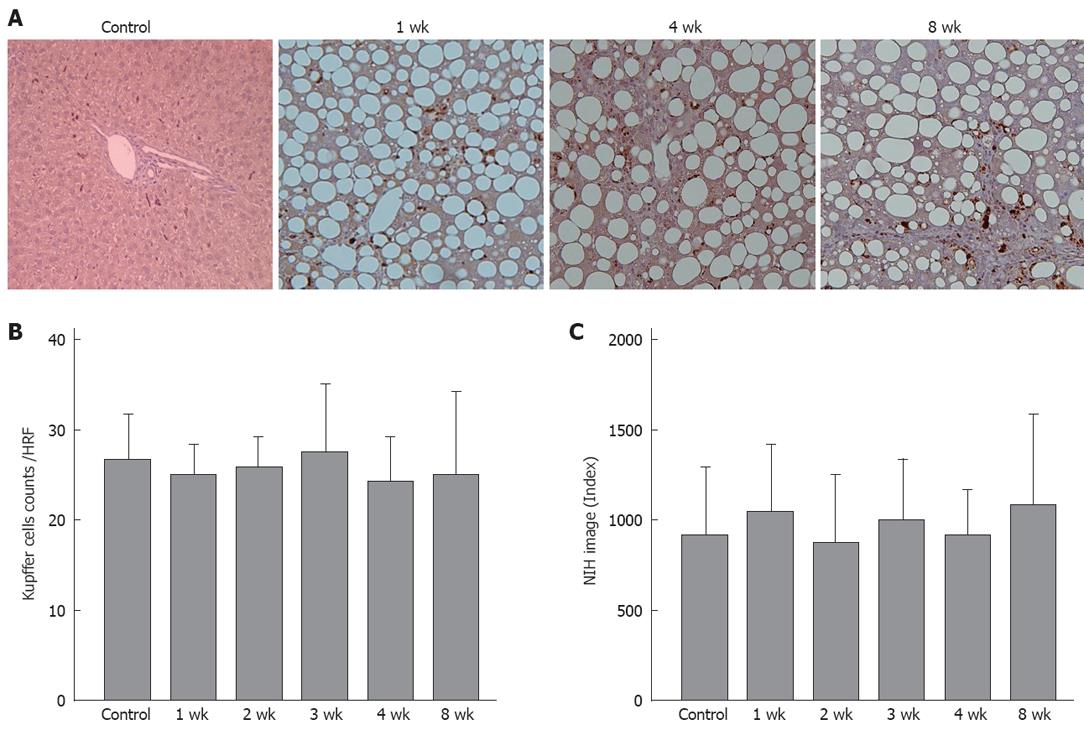
Figure 6 A: Kupffer cell immunohistochemical staining (× 200).
Brown-stained cells are positive; B: There were no significant differences between the different groups in the number of stained cell per field; C: No significant differences were found between the groups in the quantitative analyses (n = 5).
- Citation: Tsujimoto T, Kawaratani H, Kitazawa T, Hirai T, Ohishi H, Kitade M, Yoshiji H, Uemura M, Fukui H. Decreased phagocytic activity of Kupffer cells in a rat nonalcoholic steatohepatitis model. World J Gastroenterol 2008; 14(39): 6036-6043
- URL: https://www.wjgnet.com/1007-9327/full/v14/i39/6036.htm
- DOI: https://dx.doi.org/10.3748/wjg.14.6036


