Copyright
©2008 The WJG Press and Baishideng.
World J Gastroenterol. Oct 14, 2008; 14(38): 5842-5850
Published online Oct 14, 2008. doi: 10.3748/wjg.14.5842
Published online Oct 14, 2008. doi: 10.3748/wjg.14.5842
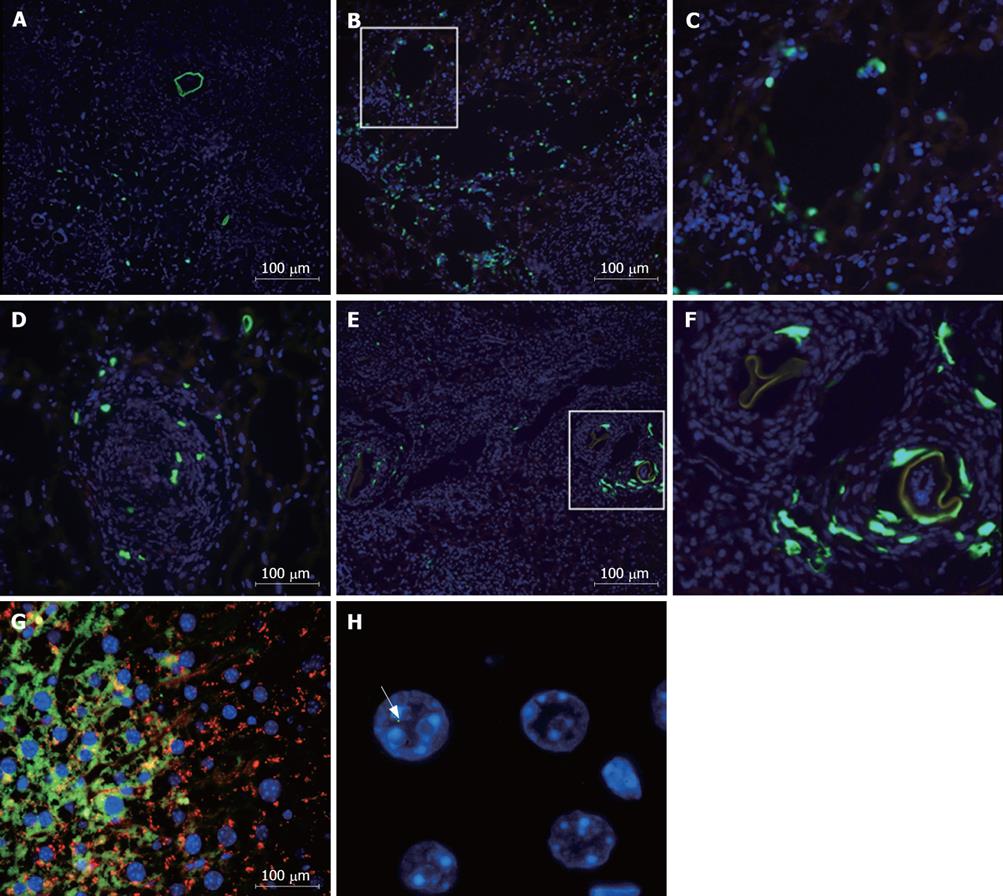
Figure 1 Visualization of donor-derived cells in liver sections of S.
mansoni-infected mice. Mice chronically infected with S.mansoni were treated with GFP+ BMC by injection into the left hepatic lobe (A-F) or by iv route (G and H) and sacrificed after different time points for evaluation by fluorescence microscopy. For visualization of GFP+ cells (green), sections were mounted with the nuclear counterstaining with DAPI (blue). A and B: Sections of injected lobe of mice sacrificed 2 h after transplantation; C: Magnification of square area of image B. Sections of livers obtained from mice sacrificed 24 h (D) or 5 d (E) after intralobular BMC injection. F: Magnification of square area of image E; G: GFP+ albumin+ cells found in liver sections 2 mo after iv injection of BMC; H: Detection of Y chromosome (arrow) in liver section of BMC-treated mice 1 mo after transplantation by iv route.
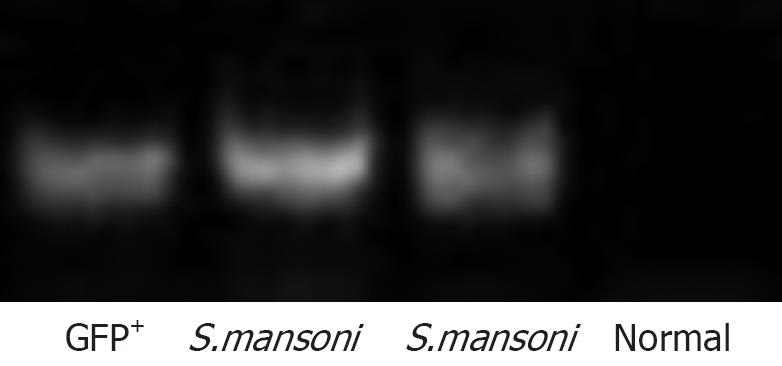
Figure 2 Detection of donor cell DNA in livers of BMC-transplanted mice.
S.mansoni-infected mice treated with BMC by iv route were sacrificed 2 mo after therapy. Liver fragments were used for DNA extraction and PCR amplification of GFP gene. Liver fragments of normal wild-type and GFP mice were used as controls.
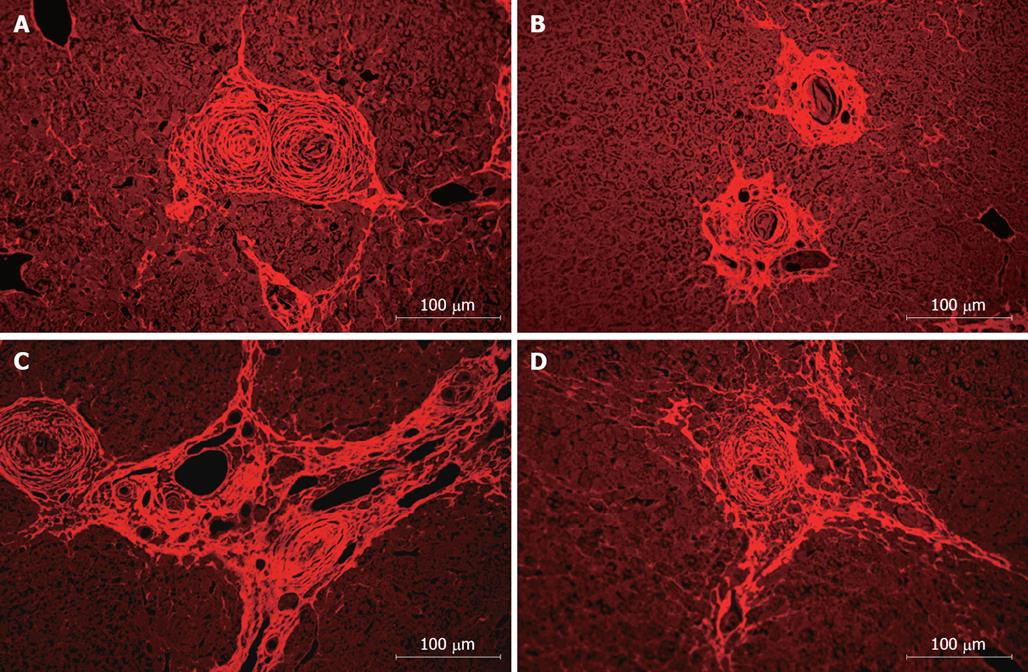
Figure 3 Alterations in liver fibrosis after BMC therapy in S.
mansoni-infected mice. The morphological aspects of liver sections were detected by fluorescence analyses. Representative images of liver sections stained by Sirius red-Fast green of S.mansoni-infected mice 2 mo after saline (A and B) or BMC (C and D) treatment by iv route.
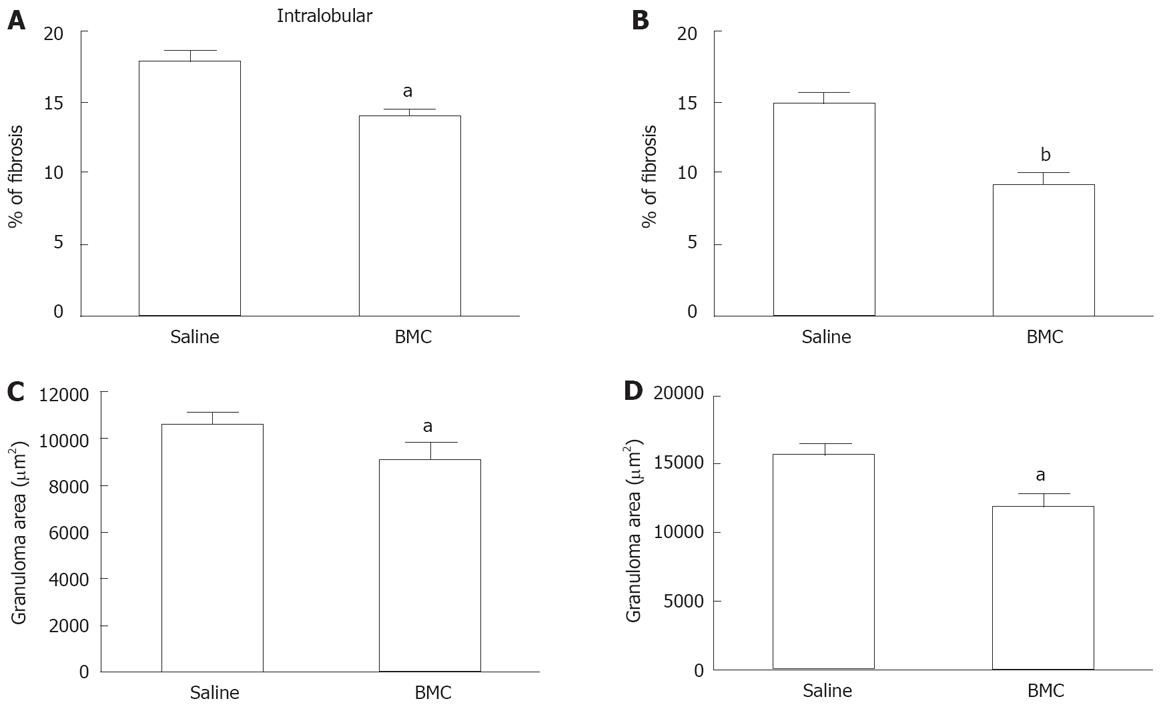
Figure 4 Reduction of fibrosis and granuloma area after BMC therapy.
Mice infected with S.mansoni and treated with saline or BMC by intralobular (A and C) or iv B and D routes were sacrificed 2 mo after treatment. Liver sections sampled randomly and stained with Sirius red-Fast green were examined by optical microscopy. Images were digitalized and analyzed by morphometry. The percentage of fibrosis (A and B) and the area of periocular granulomas (C and D) were evaluated. Data were represented graphically as mean ± SE of 5-14 animals per group. aP < 0.05 and bP < 0.01 compared to saline-treated group.
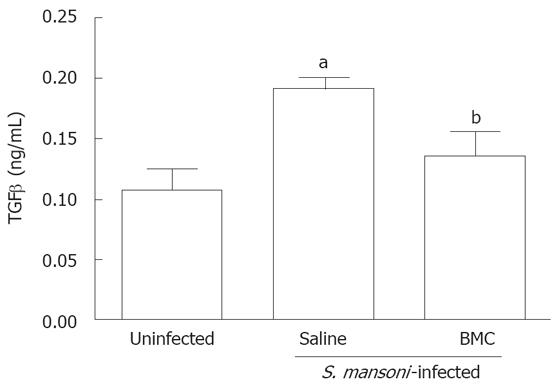
Figure 5 BMC therapy decreases the levels of TGF-β in the liver.
TGF-β levels were assessed in fragments of hepatic tissue of uninfected, saline-treated or BMC-treated S. mansoni-infected mice 2 mo after BMC infusion by iv route, by sandwich ELISA. Data represents the mean ± SE of 4-8 animals per group. aP < 0.05 compared to uninfected group; bP < 0.01 compared to saline-treated group.
Figure 6 Increased numbers of oval cells after BMC therapy.
Oval cells (OV-6+ stained in red) in sections of saline (A) or BMC (B) treated mice 2 mo after transplantation by iv route. C: The number of oval cells in liver sections of uninfected, saline-treated or BMC-treated S. mansoni-infected mice 2 mo after cellular infusion by iv route was determined by immunofluorescence analysis using an anti-OV-6 antibody. Data represents the mean ± SE of 5-6 animals per group. aP < 0.05 compared to uninfected group; bP < 0.001 compared to saline-treated group.
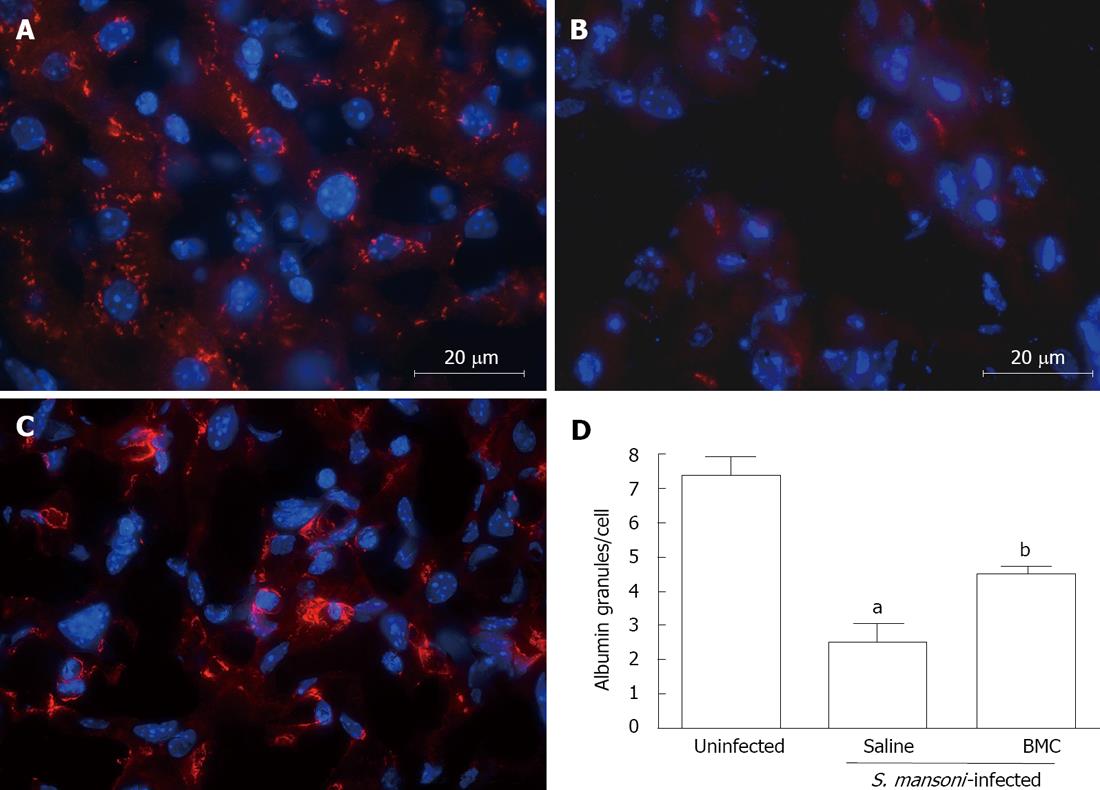
Figure 7 Increased albumin expression after BMC therapy.
Albumin (red) and nuclei (blue) staining in sections of uninfected (A), saline-treated (B) or BMC-treated (C), S.mansoni-infected mice, 2 mo after treatment by iv route. D: Albumin+ granules were quantified by morphometry in liver sections of uninfected, saline-treated or BMC-treated S.mansoni-infected mice 2 mo after cellular infusion by iv route. Data represents the mean ± SE of 7 animals per group. aP < 0.05 compared to uninfected group; bP < 0.001 compared to saline-treated group.
-
Citation: Oliveira SA, Souza BSF, Guimarães-Ferreira CA, Barreto ES, Souza SC, Freitas LAR, Ribeiro-dos-Santos R, Soares MBP. Therapy with bone marrow cells reduces liver alterations in mice chronically infected by
Schistosoma mansoni . World J Gastroenterol 2008; 14(38): 5842-5850 - URL: https://www.wjgnet.com/1007-9327/full/v14/i38/5842.htm
- DOI: https://dx.doi.org/10.3748/wjg.14.5842


