Copyright
©2008 The WJG Press and Baishideng.
World J Gastroenterol. Oct 14, 2008; 14(38): 5827-5833
Published online Oct 14, 2008. doi: 10.3748/wjg.14.5827
Published online Oct 14, 2008. doi: 10.3748/wjg.14.5827
Figure 1 p27mt sequencing assay of transductants.
Sequencing result was consistent with p27mt sequence in gene bank. Sequencing result was shown and the underline was mutant site Met-187/Ile-188 (ATGATC).
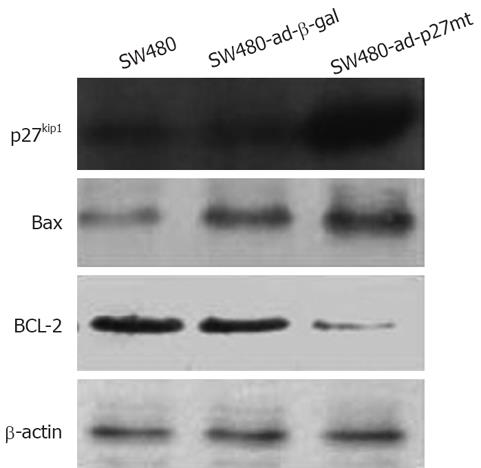
Figure 2 Expression of p27, Bcl-2 and Bax protein in each transductant by Western blot analysis.
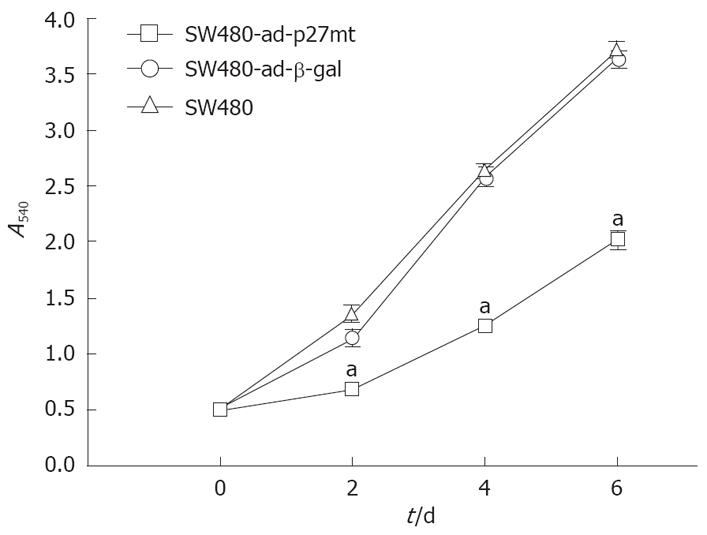
Figure 3 Growth of transductants in vitro.
Relative cell number was evaluated by comparing the absorbance in each cell at day 2, 4 and 6. The values shown are the mean of eight determinations. aP < 0.05, vs control cells.
Figure 4 Cell cycle analysis of transductants by flow cytometry.
A: SW480; B: SW480-ad-β-gal; C: SW480-ad-p27mt. C-F: Sub-G1, G0/G1, S and G2/M phase, respectively. The percentage of cells in sub-G1, G0/G1, S and G2/M phase is shown in Table 1.
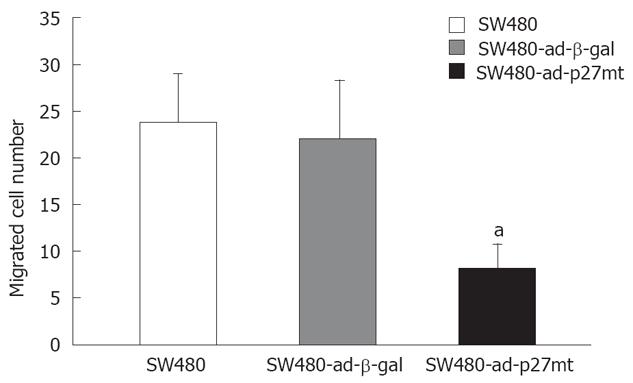
Figure 5 Cell migration assay by Boyden chamber.
After 24 h of cell incubation, the migrated cells in each transductant were counted in six different fields under a light microscope. aP = 0.004, vs control cells.
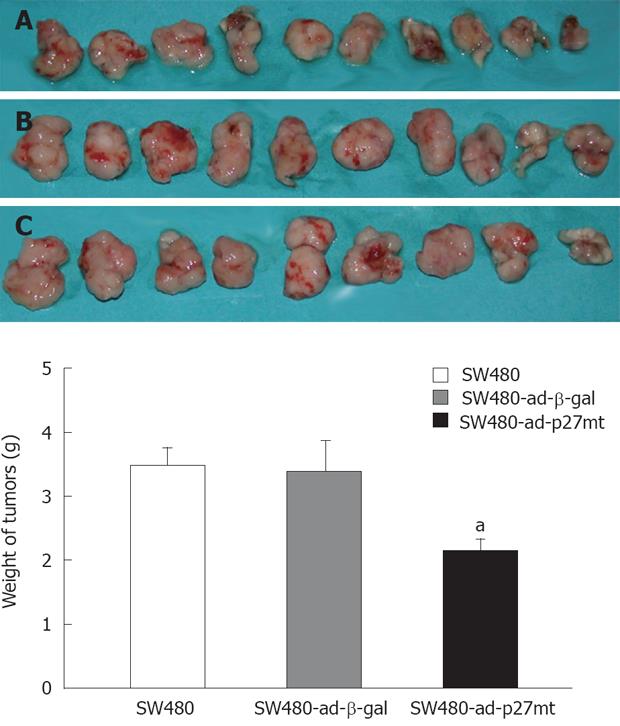
Figure 6 Upper: A, B and C indicated respectively the groups which received respectively intratumoral injections of ad-p27mt, ad-β-gal or PBS.
Lower: In vivo tumor growth inhibition assay. The weight of tumors was measured. The values are mean of the weight of tumors of each group aP = 0.002, vs control groups.
- Citation: Sun ZQ, Deng CS, Xu SY, Du Y. Antitumor bioactivity of adenovirus-mediated p27mt in colorectal cancer cell line SW480. World J Gastroenterol 2008; 14(38): 5827-5833
- URL: https://www.wjgnet.com/1007-9327/full/v14/i38/5827.htm
- DOI: https://dx.doi.org/10.3748/wjg.14.5827


