Copyright
©2008 The WJG Press and Baishideng.
World J Gastroenterol. Oct 7, 2008; 14(37): 5650-5656
Published online Oct 7, 2008. doi: 10.3748/wjg.14.5650
Published online Oct 7, 2008. doi: 10.3748/wjg.14.5650
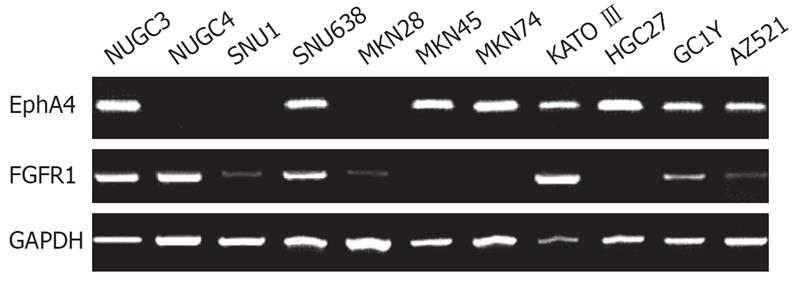
Figure 1 RT-PCR analysis of the EphA4 and FGFR1 in gastric cancer cell lines.
Figure 2 Real time RT-PCR (A) and semiquantitative RT-PCR (B) analysis of the EphA4 in gastric cancer tissues.
A: From left to right; case 1 tumor, case 2 tumor, case 3 tumor, case 4 tumor, case 3 normal, case 1 normal, and case 2 normal; B: N and T = matched samples from non-tumor and tumor tissue, respectively.
Figure 3 Immunohistochemistry for EphA4 in gastric cancer tissues (× 200).
A: Well differentiated gastric cancer negative for EphA4; B: Poorly differentiated gastric cancer negative for EphA4; C: Normal gastric epithelia negative for EphA4; D: Moderately differentiated gastric cancer positively stained for EphA4; E: Poorly differentiated gastric cancer positively stained for EphA4.
Figure 4 Kaplan-Meier survival curves of patients with gastric cancer according to the expression of EphA4 (P = 0.
0008).
Figure 5 RT-PCR analysis of the type A ephrins and type B ephrins in gastric cancer cell lines.
1: NUGC3; 2: NUGC4; 3: SNU1; 4: SNU638; 5: MKN28; 6: MKN45; 7: MKN74; 8: KATOIII; 9: HGC27; 10: GC1Y; 11: AZ521.
- Citation: Oki M, Yamamoto H, Taniguchi H, Adachi Y, Imai K, Shinomura Y. Overexpression of the receptor tyrosine kinase EphA4 in human gastric cancers. World J Gastroenterol 2008; 14(37): 5650-5656
- URL: https://www.wjgnet.com/1007-9327/full/v14/i37/5650.htm
- DOI: https://dx.doi.org/10.3748/wjg.14.5650


