Copyright
©2008 The WJG Press and Baishideng.
World J Gastroenterol. Sep 14, 2008; 14(34): 5274-5281
Published online Sep 14, 2008. doi: 10.3748/wjg.14.5274
Published online Sep 14, 2008. doi: 10.3748/wjg.14.5274
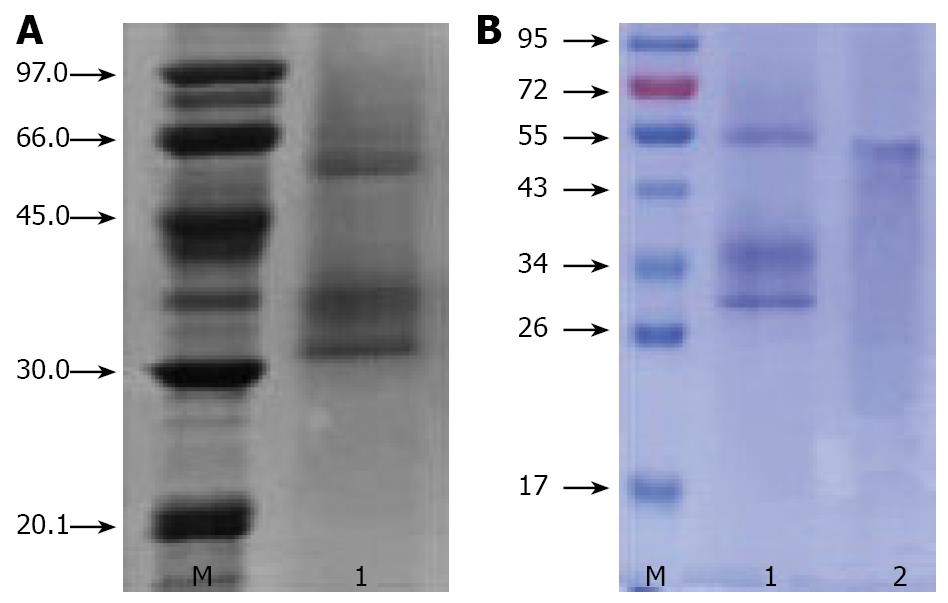
Figure 1 A: SDS-PAGE profiles of ACML-55.
ACML-55 was determined by SDS-PAGE; ACML-55. B: ACML-55 was also determined by SDS-PAGE. ACML-55. ACML-55 in presence (lane 1) and absence (lane 2) of reducing agent.
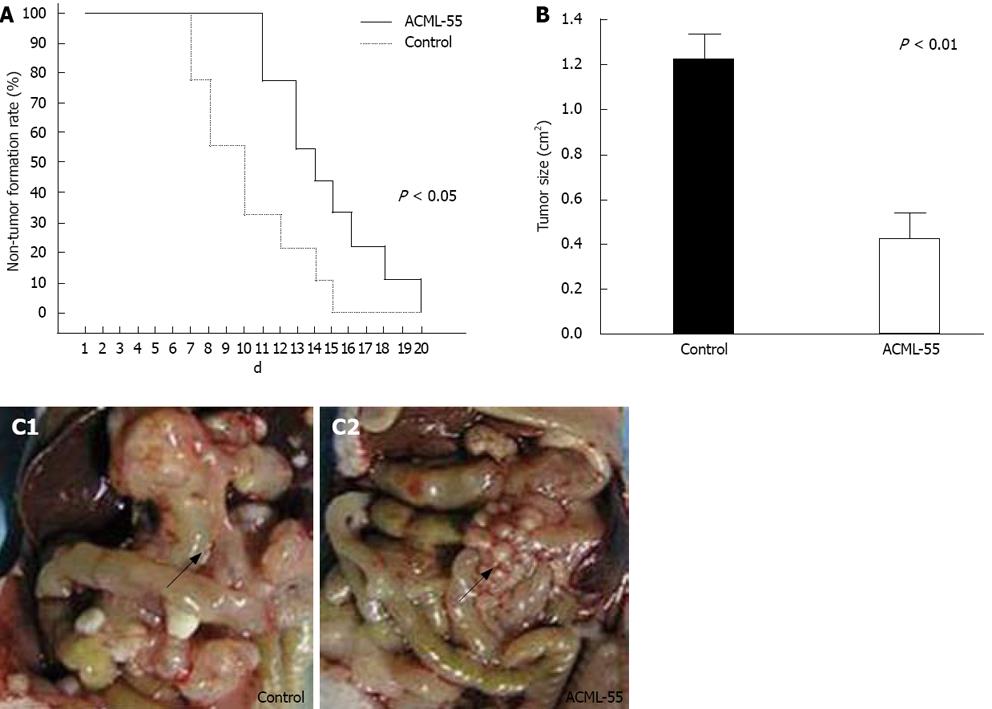
Figure 2 ACML-55 enhances tumor surveillance.
A: ACML-55 treatment delays CT26 melanoma tumor formation. Sex- and age-matched BALB/c mice were administered orally either with 2 mg/mL (200 μL/mouse) ACML-55 or equivalent volume of PBS (control) daily for fifteen days (n = 20 for each group), followed by subcutaneous inoculation of CT26 melanoma tumor cells (5 × 10⁵/mouse) on day 7 after the initiation of ACML-55 or PBS treatment. Tumor growth was recorded daily. Tumor size > 5 mm × 5 mm was considered positive. Data represents three independent experiments (P < 0.01). B: ACML-55 treatment inhibits tumor growth. The mean tumor size from ACML-55 and PBS-treated mice at day 20 is shown in this figure (P < 0.01). C: ACML-55 treatment significantly reduces intraperitoneal tumor formation. BALB/c mice were treated with ACML-55 or PBS followed by CT26 tumor cell inoculation intraperitoneally (n = 20 for each group) as described above, and tumor growth was monitored. A representative example of tumor formation is provided. Arrows point to intraperitoneal tumor.
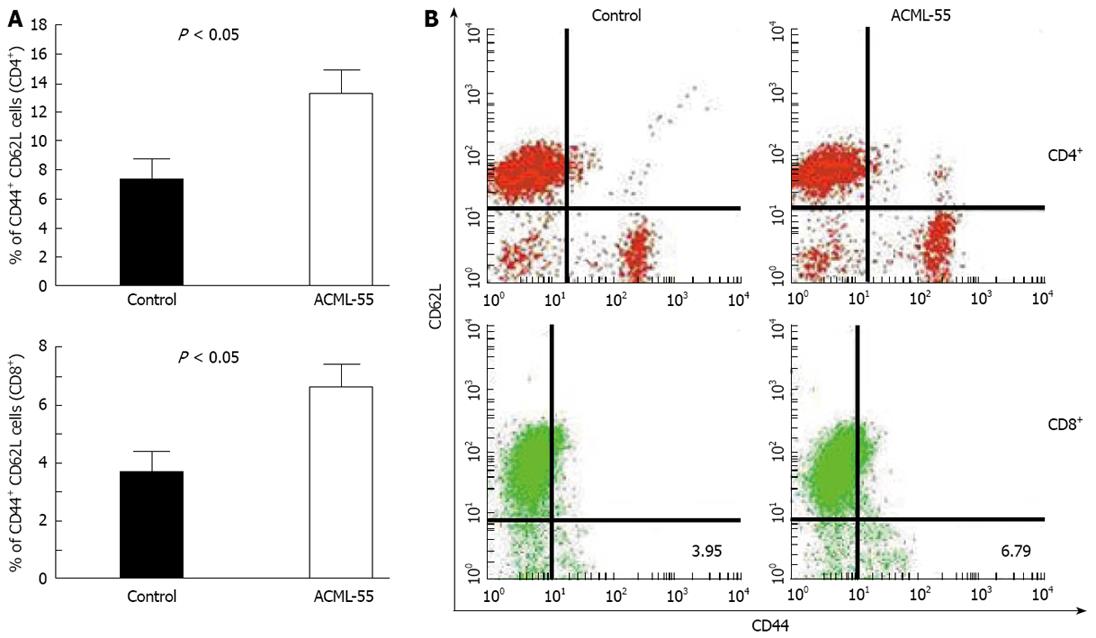
Figure 3 ACML-55 enhances CD4+ and CD8+ T cell activation.
Sex- and age- matched BALB/c mice were administered orally with 2 mg/mL (200 μL/mouse) ACML-55 or equivalent volume of PBS daily for 15 days (n = 5 for each group), and on day 7, received an intraperitoneal inoculation with EG7 tumor cells (1 × 10⁶ cells/mouse). Ten days postinoculation, splenoctyes were stained with antibodies against different surface molecules and analyzed by FACS. A: The percentage of activated CD4+ and CD8+ T cells (mean ± SD) is shown (P < 0.05); B: An example of the FACS profile for CD4+ and CD8+T cells is given.
Figure 4 ACML-55 increases the number of IFN-γ+CD8+ T cells.
Sex- and age- matched BALB/c mice were administered orally with 2 mg/mL (200 μL/mouse) ACML-55 or equivalent volume of PBS daily (n = 5 for each group) for fourteen days, followed by immunization with 200 μg of CT26 tumor lysate emulsified in CFA. After seven days, lymphocytes recovered from draining lymph nodes of immunized mice were cultured with 200 μg/mL of tumor lysate for 24 h, with the addition of brefeldin A to the culture for the remaining 3 h. Cells were then fixed with 2% formaldehyde and permeabilized with 0.5% saponin for intracellular IFN-γ staining. A: The percentage of IFN-γ producing cells (mean ± SD) from CD8+ T cells is shown; B: An example of intracellular cytokine staining upon gating on CD8+ T cells is shown.
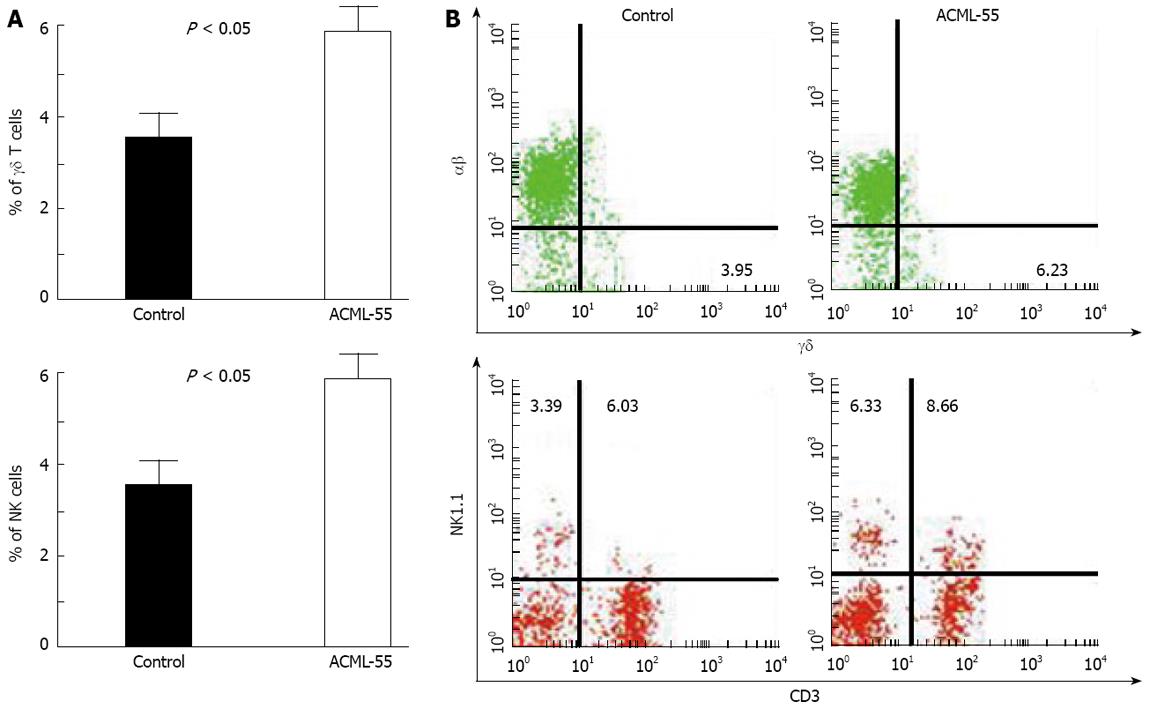
Figure 5 ACML-55 treatment increases the number of NK and γδ T cells.
Sex- and age- matched BALB/c mice were administered orally with 2 mg/mL (200 μL/mouse) ACML-55 or equivalent volume of PBS daily (n = 5 for each group) for fourteen days, followed by inoculation with CT26 tumor cells intraperitoneally. Ten days post-inoculation, splenocytes were used for analysis of NK, NKT, αβ, and γδ T cells. A: The percentage of NK and γδ T cells (mean ± SD) is shown (P < 0.05); B: An example of the FACS analysis is given.
- Citation: Ma YH, Cheng WZ, Gong F, Ma AL, Yu QW, Zhang JY, Hu CY, Chen XH, Zhang DQ. Active chinese mistletoe lectin-55 enhances colon cancer surveillance through regulating innate and adaptive immune responses. World J Gastroenterol 2008; 14(34): 5274-5281
- URL: https://www.wjgnet.com/1007-9327/full/v14/i34/5274.htm
- DOI: https://dx.doi.org/10.3748/wjg.14.5274


