Copyright
©2008 The WJG Press and Baishideng.
World J Gastroenterol. Jul 28, 2008; 14(28): 4492-4498
Published online Jul 28, 2008. doi: 10.3748/wjg.14.4492
Published online Jul 28, 2008. doi: 10.3748/wjg.14.4492
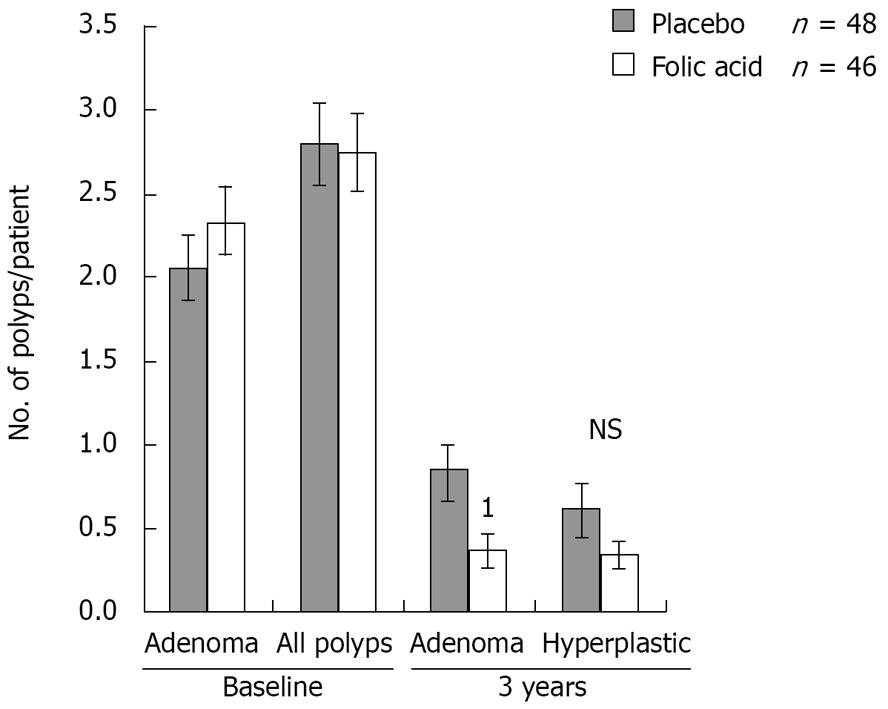
Figure 1 Number of adenomas versus treatment.
Histograms showing the number of adenomas or all types of polyps in folic acid and placebo-treated groups at baseline and 3 years after treatment. 1P = 0.02514, compared to the placebo-treated group. Each histogram represents the mean ± SD.
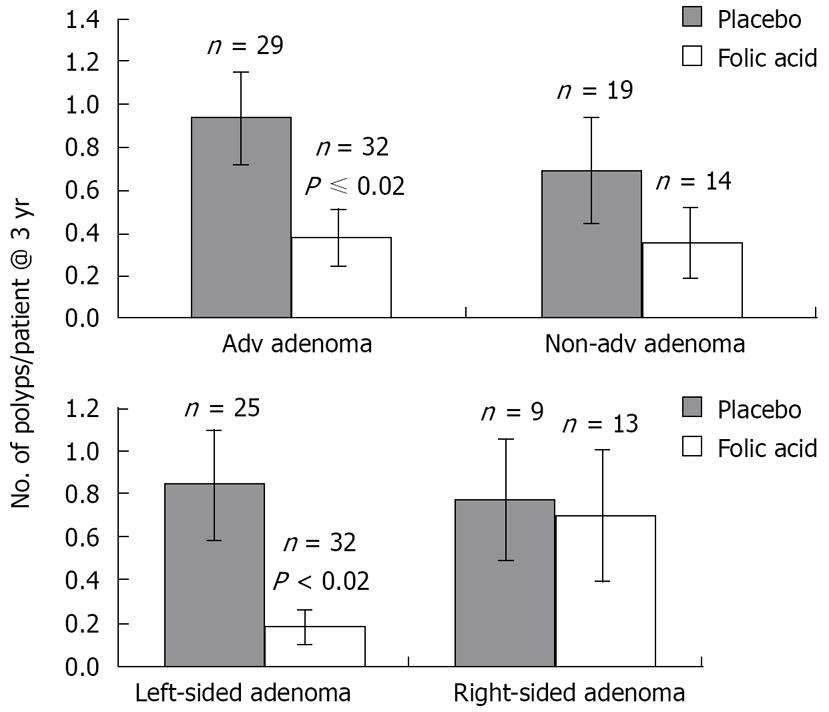
Figure 2 Polyp characteristics and response to treatment.
Recurrence of advanced [large (> 1 cm) and polyps with villous component] or non-advanced adenomas (upper panel) as well as right or left-sided adenomas (lower panel) following 3 years of treatment with a high dose of folic acid. The numbers of subjects as well as the levels of significance between the two groups are shown.
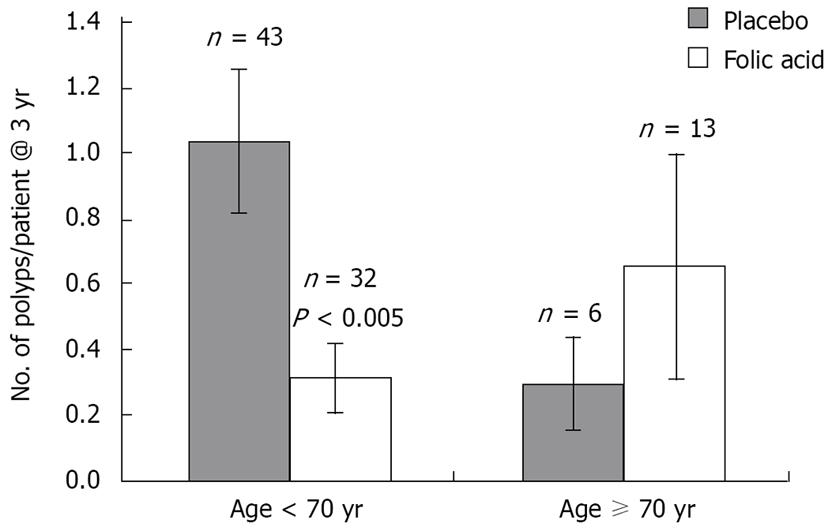
Figure 3 The effect of age on the response to treatment.
Recurrence of adenomas in response to 3 years of folic acid treatment in patients over or below 70 years of age in shown. The number of subjects in each group as well as the levels of significance is shown in the figure.
- Citation: Jaszewski R, Misra S, Tobi M, Ullah N, Naumoff JA, Kucuk O, Levi E, Axelrod BN, Patel BB, Majumdar AP. Folic acid supplementation inhibits recurrence of colorectal adenomas: A randomized chemoprevention trial. World J Gastroenterol 2008; 14(28): 4492-4498
- URL: https://www.wjgnet.com/1007-9327/full/v14/i28/4492.htm
- DOI: https://dx.doi.org/10.3748/wjg.14.4492


