Copyright
©2008 The WJG Press and Baishideng.
World J Gastroenterol. Jul 21, 2008; 14(27): 4383-4388
Published online Jul 21, 2008. doi: 10.3748/wjg.14.4383
Published online Jul 21, 2008. doi: 10.3748/wjg.14.4383
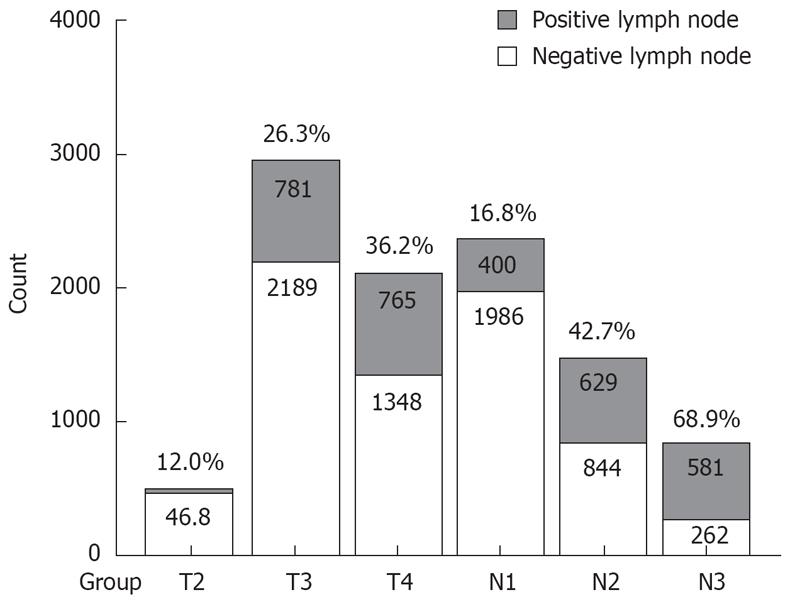
Figure 1 MLR of different pT/pN subcategories.
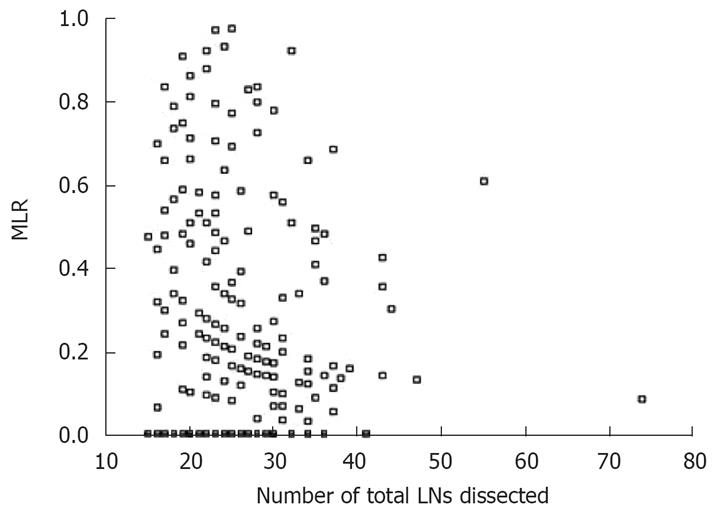
Figure 2 Scatter of MLR and total LNs dissected.
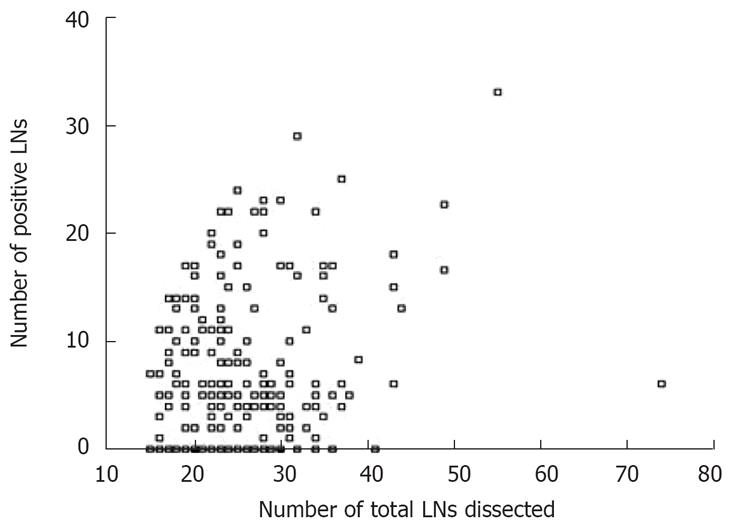
Figure 3 Scatter of positive LNs and total LNs dissected.
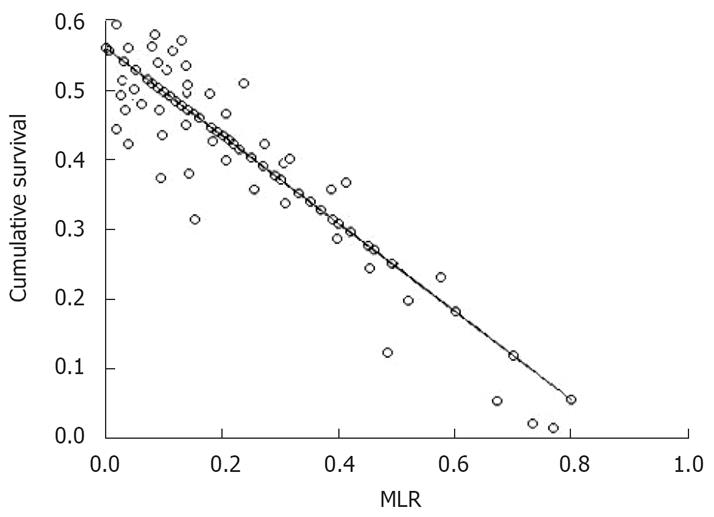
Figure 4 Regression line of MLR impact on the 5-year survival rate.
- Citation: Huang CM, Lin BJ, Lu HS, Zhang XF, Li P, Xie JW. Prognostic impact of metastatic lymph node ratio in advanced gastric cancer from cardia and fundus. World J Gastroenterol 2008; 14(27): 4383-4388
- URL: https://www.wjgnet.com/1007-9327/full/v14/i27/4383.htm
- DOI: https://dx.doi.org/10.3748/wjg.14.4383


