Copyright
©2008 The WJG Press and Baishideng.
World J Gastroenterol. Jul 21, 2008; 14(27): 4377-4382
Published online Jul 21, 2008. doi: 10.3748/wjg.14.4377
Published online Jul 21, 2008. doi: 10.3748/wjg.14.4377
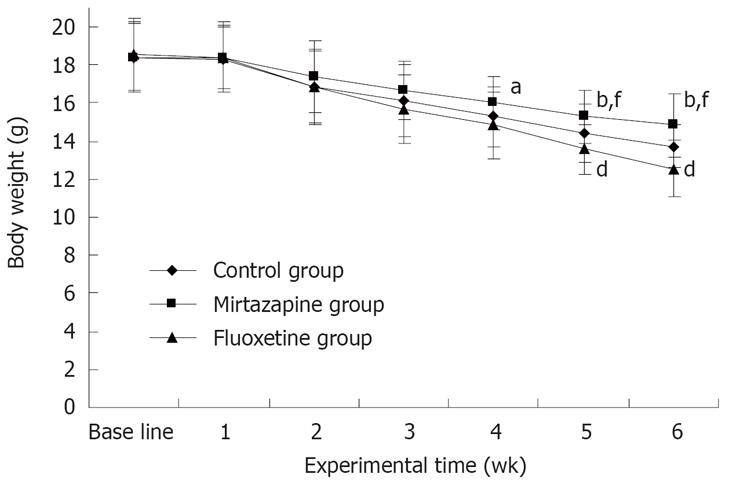
Figure 1 Effects of antidepressants on body weight of nude mice.
Data are represented as mean ± SD. aP < 0.05, bP < 0.01 vs fluoxetine group, dP < 0.01 vs control group, fP < 0.01 vs control group.
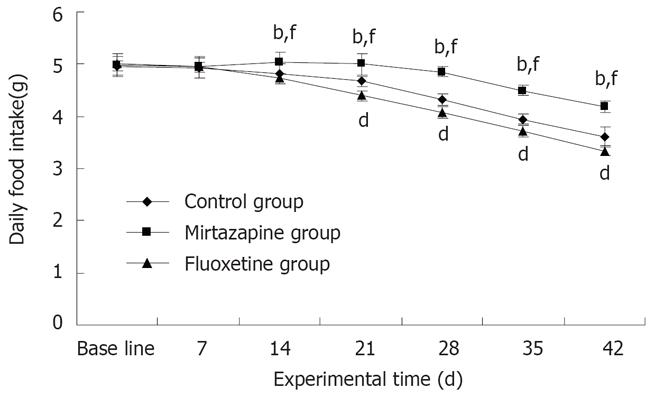
Figure 2 Effects of antidepressants on food intake of mice.
Data are represented as mean ± SD. bP < 0.01 vs fluoxetine group, dP < 0.01 vs control group, fP < 0.01 vs control group.
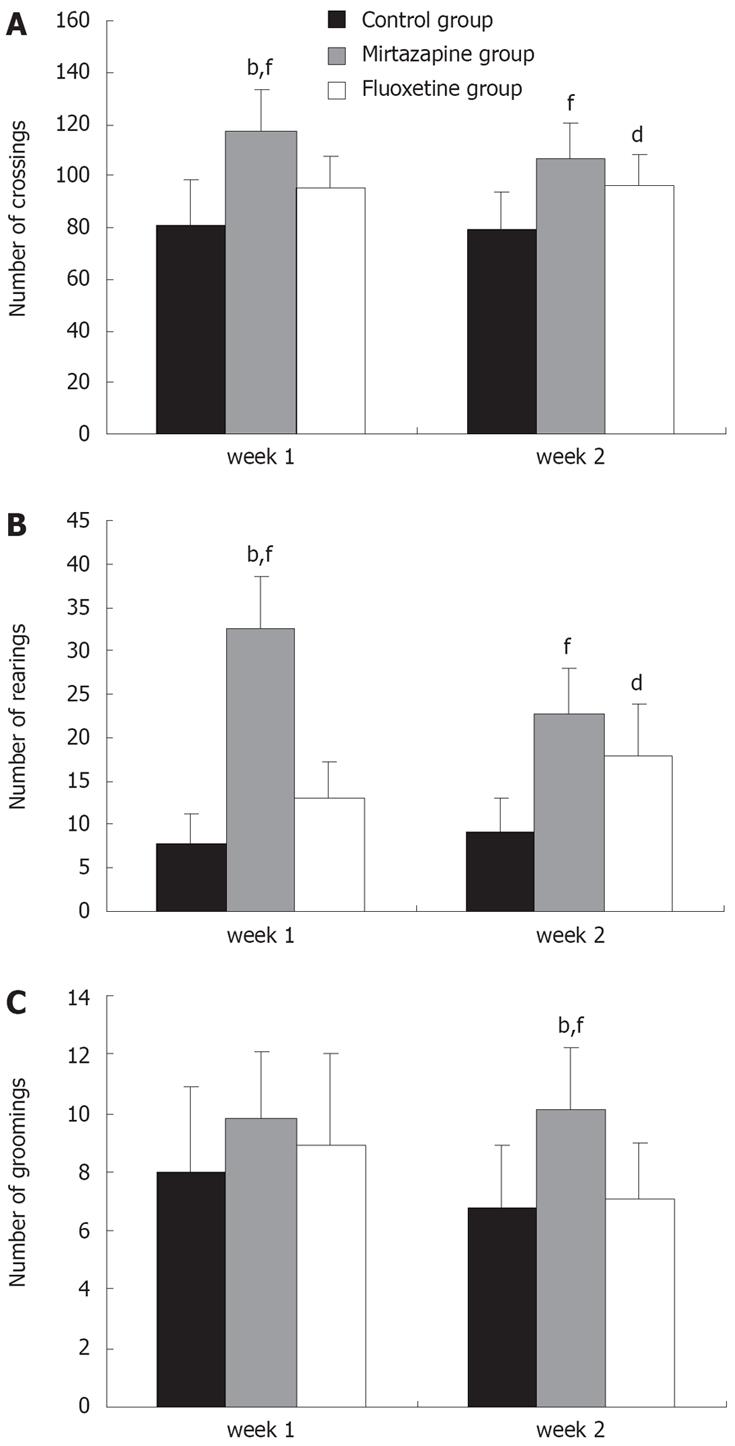
Figure 3 Horizontal (A), vertical (B) and grooming (C) activity in pancreatic tumor-bearing mice in the OFT.
Data are represented as mean ± SD. bP < 0.01 vs fluoxetine group, dP < 0.01 vs control group, fP < 0.01 vs control group.
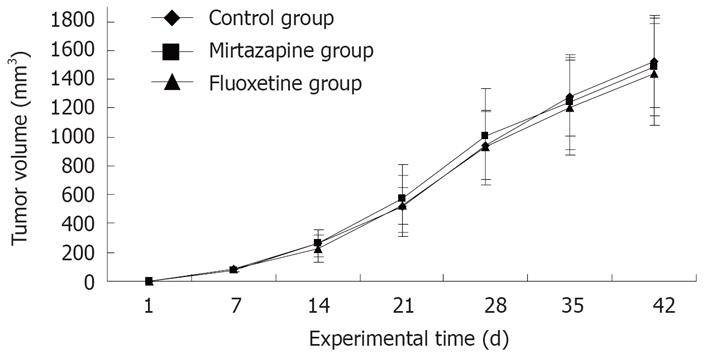
Figure 4 Effect of antidepressants on the growth of pancreatic cancer xenografts.
Data are represented as mean ± SD.
- Citation: Jia L, Shang YY, Li YY. Effect of antidepressants on body weight, ethology and tumor growth of human pancreatic carcinoma xenografts in nude mice. World J Gastroenterol 2008; 14(27): 4377-4382
- URL: https://www.wjgnet.com/1007-9327/full/v14/i27/4377.htm
- DOI: https://dx.doi.org/10.3748/wjg.14.4377


