Copyright
©2008 The WJG Press and Baishideng.
World J Gastroenterol. Jul 7, 2008; 14(25): 4011-4019
Published online Jul 7, 2008. doi: 10.3748/wjg.14.4011
Published online Jul 7, 2008. doi: 10.3748/wjg.14.4011
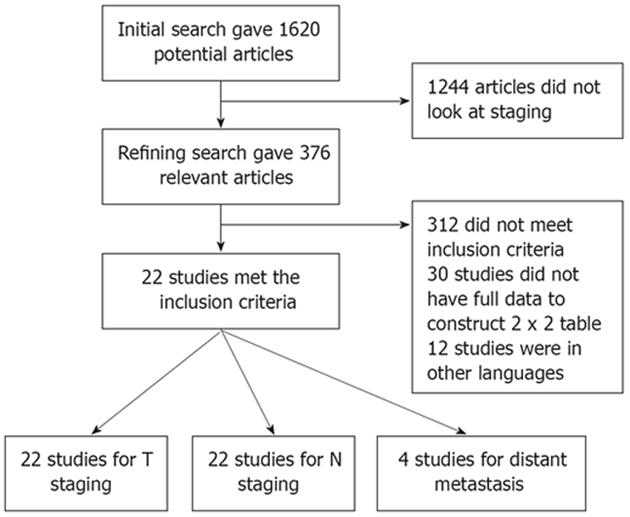
Figure 1 Flow sheet shows search results.
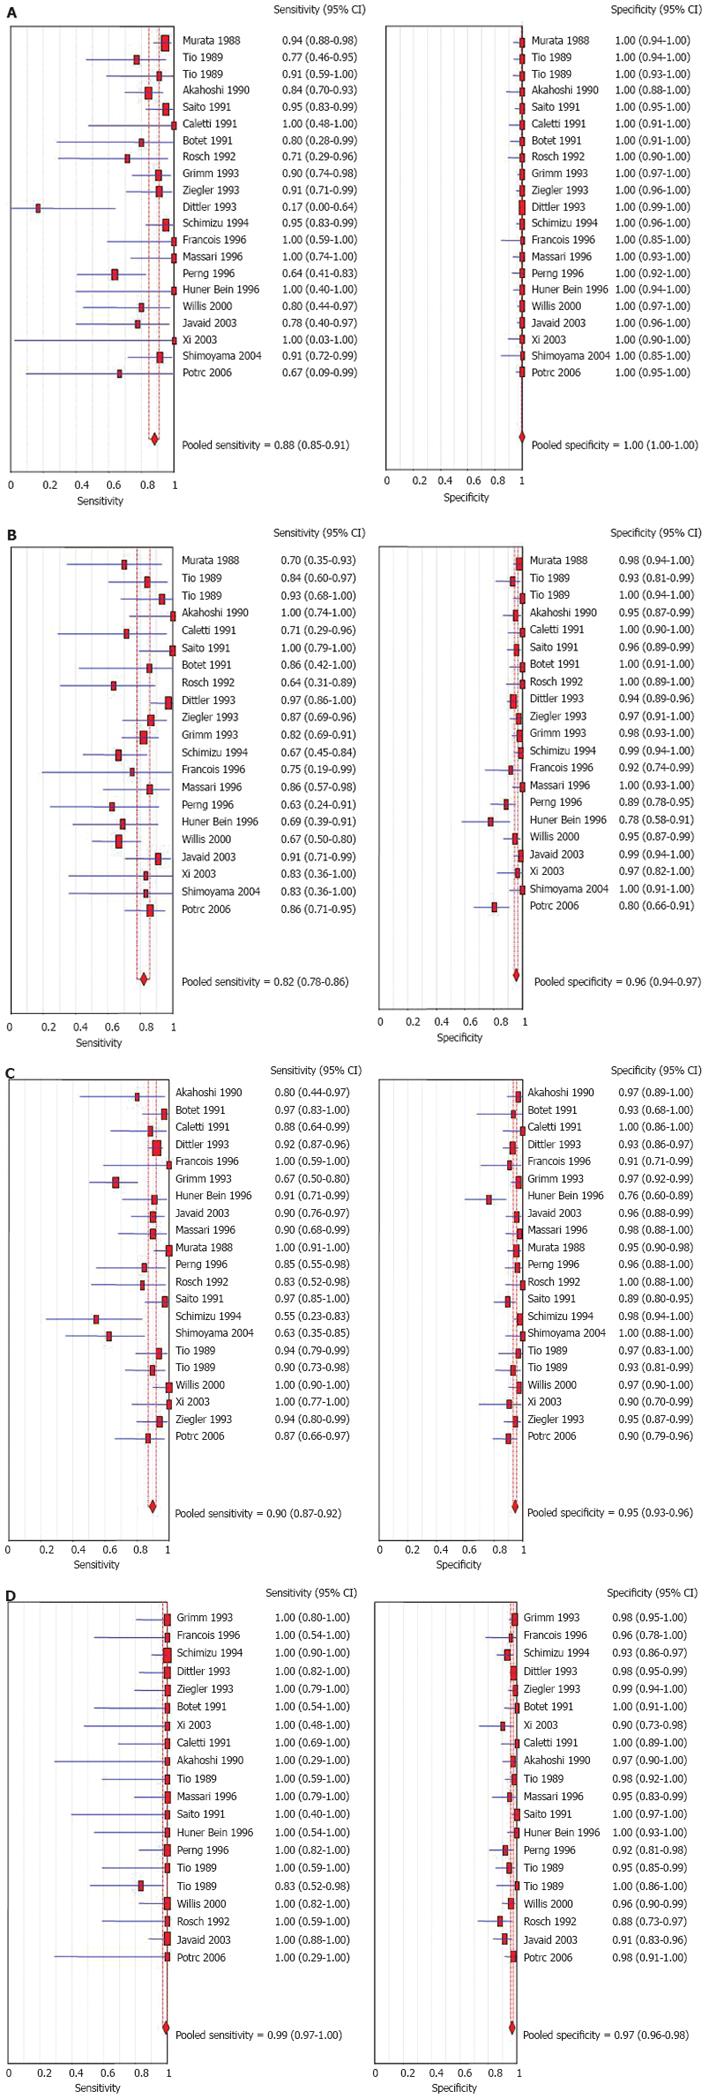
Figure 2 Forrest plot showing sensitivity and specificity of EUS in diagnosing T stage of gastric cancers.
A: T1 Stage; B: T2 Stage; C: T3 Stage; D: T4 Stage.
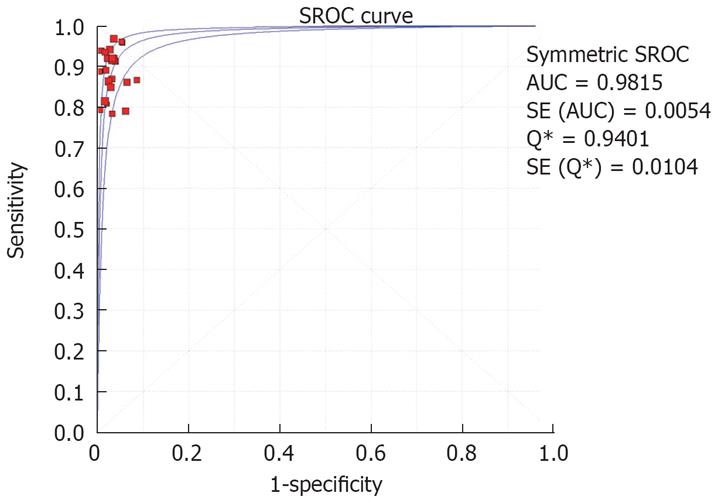
Figure 3 Summary receiver operator curve showing AUC.
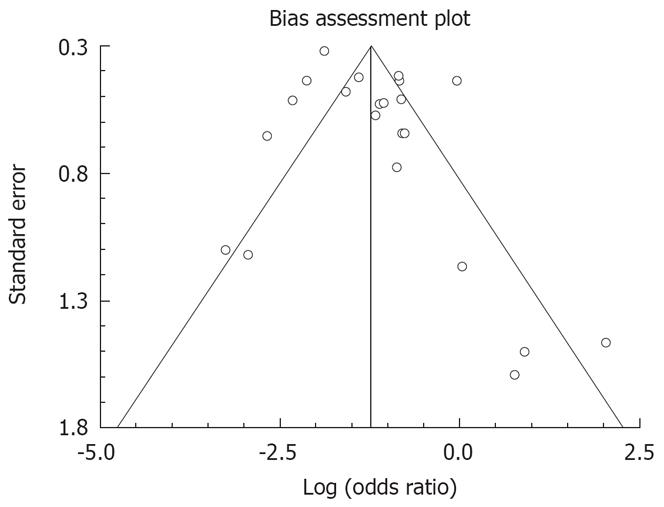
Figure 4 Funnel plot showing bias assessment.
- Citation: Puli SR, Reddy JBK, Bechtold ML, Antillon MR, Ibdah JA. How good is endoscopic ultrasound for TNM staging of gastric cancers? A meta-analysis and systematic review. World J Gastroenterol 2008; 14(25): 4011-4019
- URL: https://www.wjgnet.com/1007-9327/full/v14/i25/4011.htm
- DOI: https://dx.doi.org/10.3748/wjg.14.4011


