Copyright
©2008 The WJG Press and Baishideng.
World J Gastroenterol. Jun 28, 2008; 14(24): 3908-3913
Published online Jun 28, 2008. doi: 10.3748/wjg.14.3908
Published online Jun 28, 2008. doi: 10.3748/wjg.14.3908
Figure 1 Liver of a VX2 tumor-bearing rabbit imaged in the conventional mode before (A), immediately after 18 s (B) and 96 s (C) of injection of 0.
1 mL sonazoid microbubbles/kg. Arrows indicate VX2 tumor.
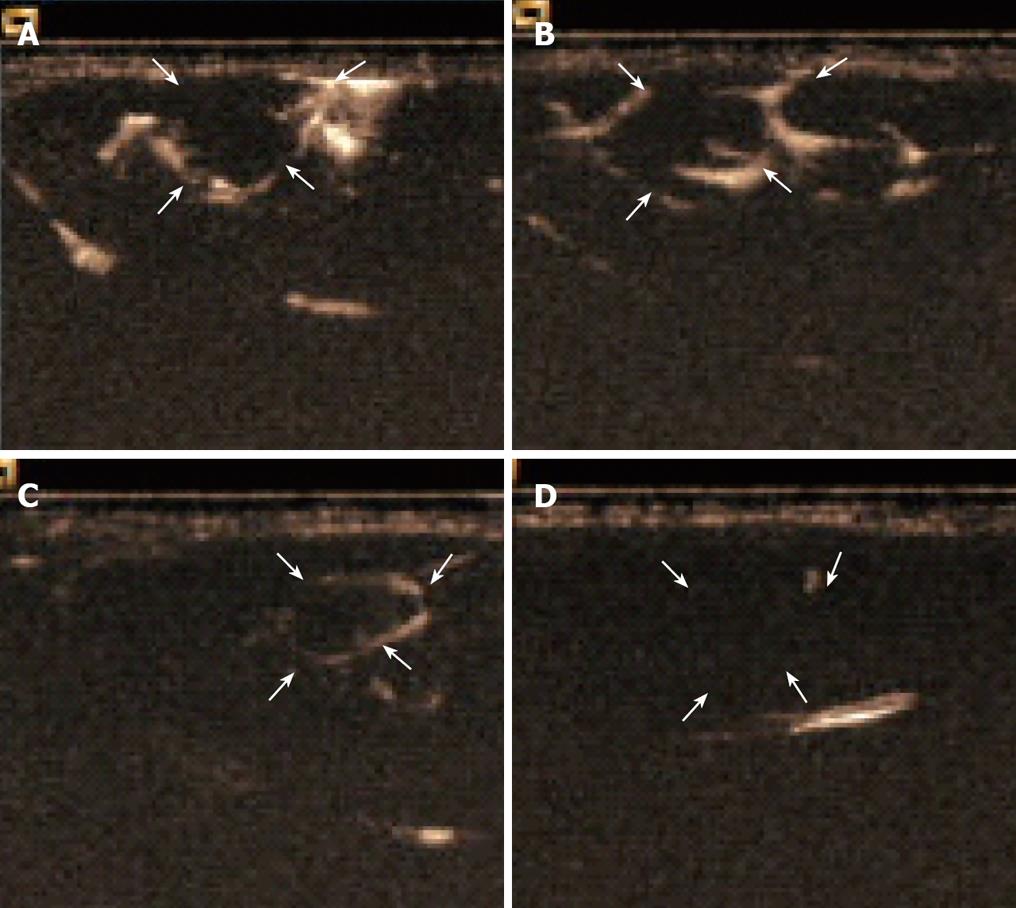
Figure 2 Hepatic lymph vessels visualized 36 s (A), 4 min (B), 7 min (C) 18 min (D) after injection of contrast agent and continuously visualized with SonoVue® during PTL with hyperechoic boundaries of VX2 tumors to liver parenchyma and the tumor.
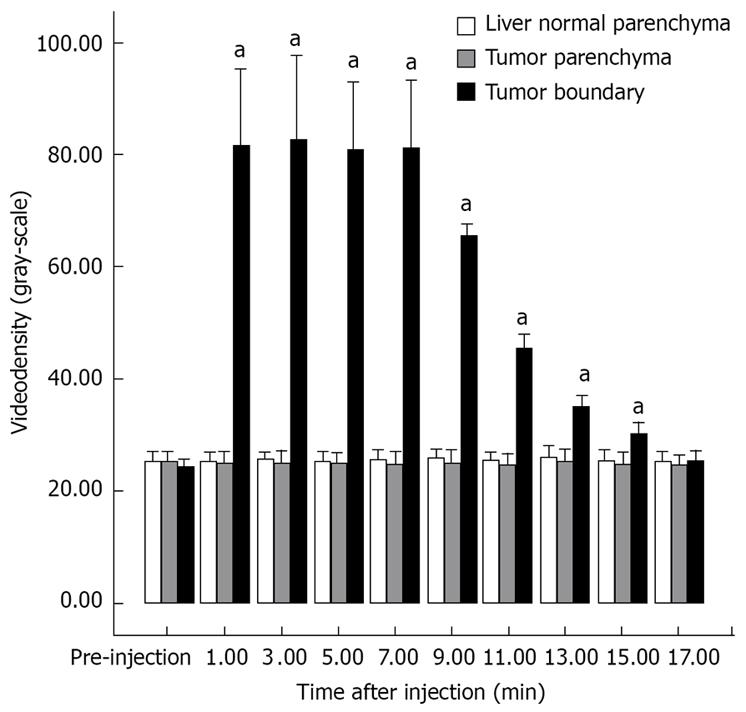
Figure 3 Videodensitometric measurements of liver normal parenchyma (white), tumor parenchyma (gray) and tumor boundary (black) before and after percutaneous transhepatic injection of contrast agent SonoVue® into the normal liver parenchyma near the VX2 tumors during PTL.
aP < 0.05 vs respective pre-injection values (Dunnett).
- Citation: Liu C, Liang P, Wang Y, Zhou P, Li X, Han ZY, Liu SP. Assessment of hepatic VX2 tumors with combined percutaneous transhepatic lymphosonography and contrast-enhanced ultrasonographic imaging. World J Gastroenterol 2008; 14(24): 3908-3913
- URL: https://www.wjgnet.com/1007-9327/full/v14/i24/3908.htm
- DOI: https://dx.doi.org/10.3748/wjg.14.3908


