Copyright
©2008 The WJG Press and Baishideng.
World J Gastroenterol. Jun 28, 2008; 14(24): 3841-3848
Published online Jun 28, 2008. doi: 10.3748/wjg.14.3841
Published online Jun 28, 2008. doi: 10.3748/wjg.14.3841
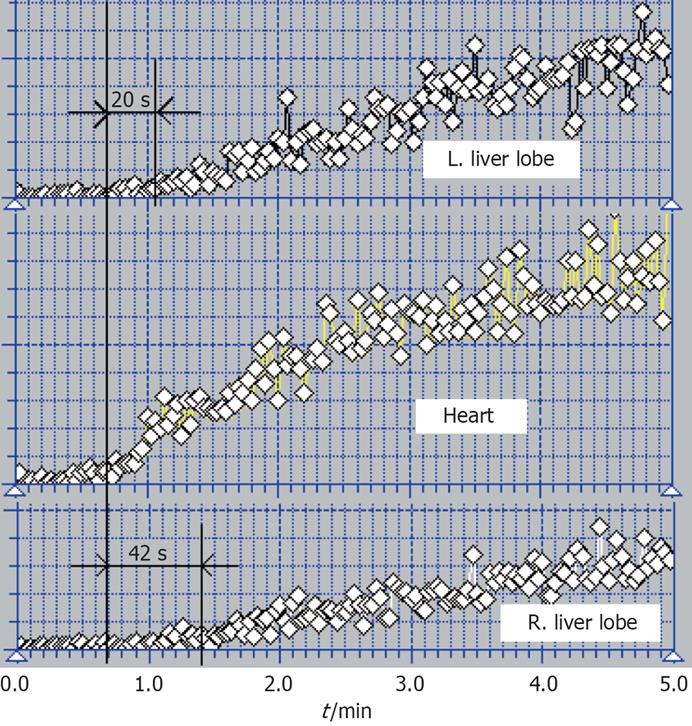
Figure 1 Per-rectal portal scintigraphy dynamic curves.
Separate analyses of the two liver lobes for a cirrhotic patient (stage 4b).
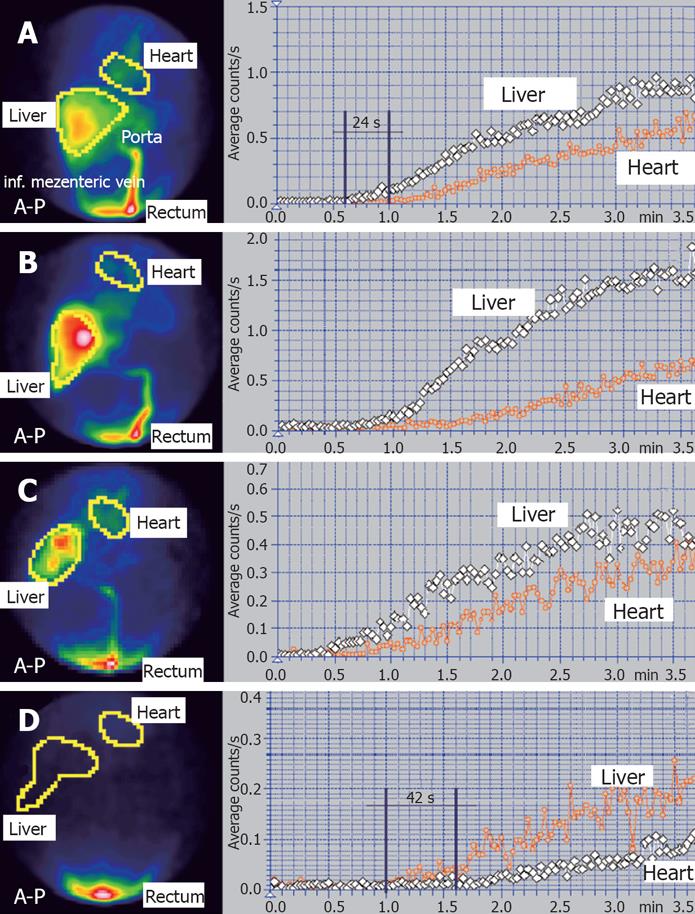
Figure 2 Per-rectal portal scintigraphy.
A: Stage 0, normal aspect. LTT = 24 s, PRSI < 5%; B: Stage 1. LTT increased (33 s). PRSI < 5%; C: Stage 2. Decreased LTT (18 s), PRSI slightly increased (8%); D: Stage 4c. Time between heart and liver curves is equal to RHTL = 42 s. Cirrhosis with undetectable portal inflow to the both lobes.
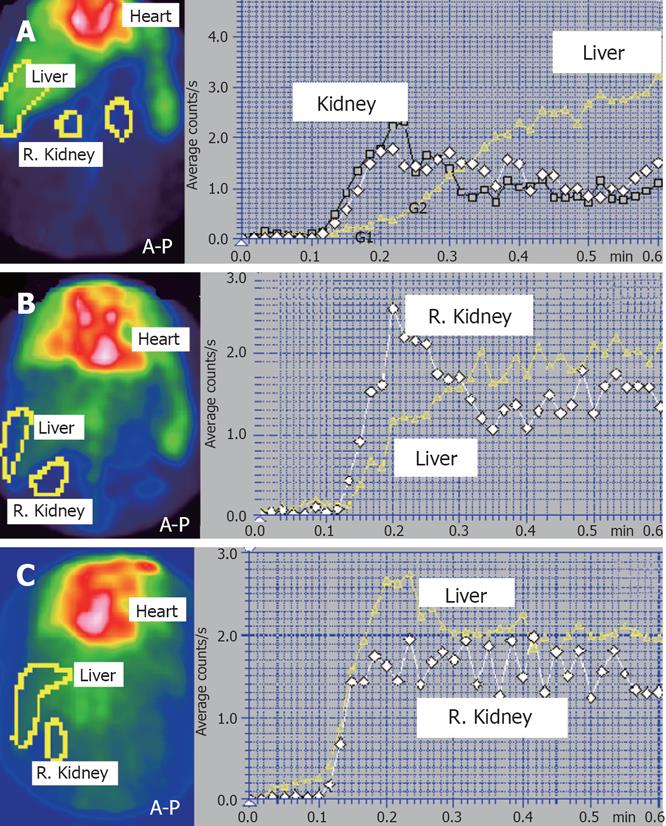
Figure 3 Liver angioscintigrahy.
A: Normal aspect. HPI = 30%. G1 = arterial inflow segment; G2 = portal inflow segment; B: Cirrhotic patient. HPI = 60%; C: Cirrhosis with reversed portal flow. HPI = 130%.
- Citation: Dragoteanu M, Balea IA, Dina LA, Piglesan CD, Grigorescu I, Tamas S, Cotul SO. Staging of portal hypertension and portosystemic shunts using dynamic nuclear medicine investigations. World J Gastroenterol 2008; 14(24): 3841-3848
- URL: https://www.wjgnet.com/1007-9327/full/v14/i24/3841.htm
- DOI: https://dx.doi.org/10.3748/wjg.14.3841


