Copyright
©2008 The WJG Press and Baishideng.
World J Gastroenterol. Jun 21, 2008; 14(23): 3672-3680
Published online Jun 21, 2008. doi: 10.3748/wjg.14.3672
Published online Jun 21, 2008. doi: 10.3748/wjg.14.3672
Figure 1 Ellagic acid stimulates apoptosis in pancreatic cancer cells.
MIA PaCa-2 (A, C) and PANC-1 (B) cells were cultured for 48 h in the presence or absence of indicated doses of ellagic acid. Internucleosomal DNA fragmentation was measured using the Cell Death Detection ELISA kit (A, B); Dead cells were assessed by flow cytometry using AnV/PI staining (C). AnV+/PI- and AnV+/PI+ cells were considered dying through apoptosis and/or secondary necrosis. Values are normalized to control (A, B). Values are mean ± SE (n = 3), aP < 0.05 vs control.
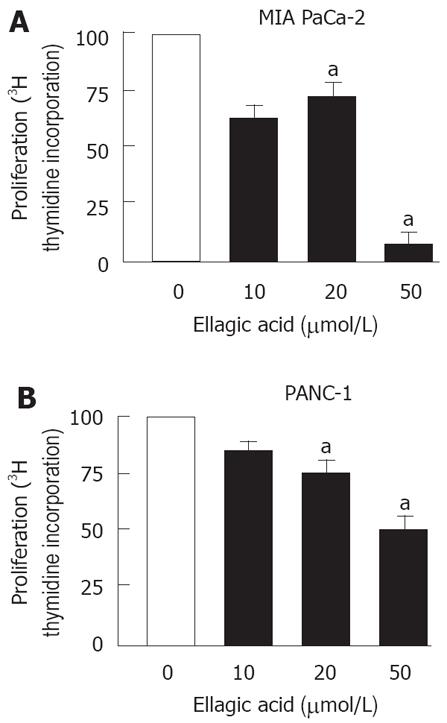
Figure 2 Ellagic acid inhibits proliferation in pancreatic cancer cells.
MIA PaCa-2 (A, C) and PANC-1 (B) cells were cultured for 48 h in the presence or absence of indicated doses of ellagic acid. Proliferation was assessed by measuring (3H) thymidine incorporation into DNA. The results are representative of at least 3 independent experiments, aP < 0.05 vs control.
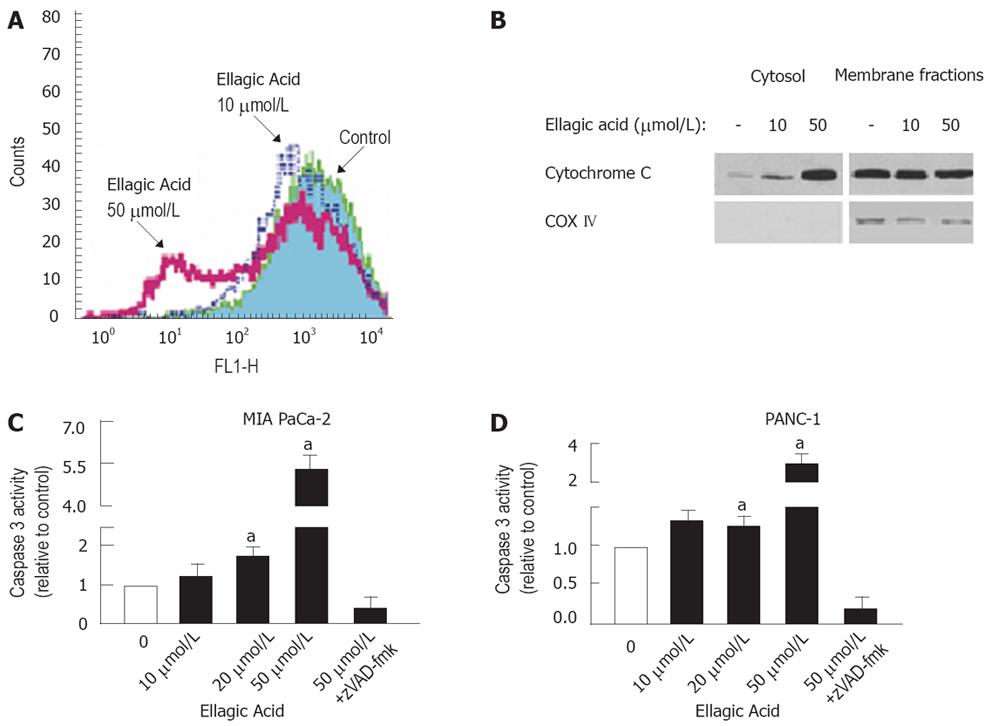
Figure 3 Ellagic acid induces loss of mitochondrial membrane potential, cytochrome C release, and caspase-3 activation in pancreatic cancer cells.
MIA PaCa-2 (A-C) and PANC-1 (B) cells were cultured for 48 h in the presence or absence of indicated doses of ellagic acid or broad-spectrum caspase inhibitor zVAD-fmk (100 &mgr;mol/L). A: Changes in ΔΨm were measured by flow cytometry using the potential-sensitive probe 3,3’dihexyloxa-carbocyanine DiOC6 (3); B: Cytochrome C release was assessed by measuring cytochrome C levels in both cytosolic and mitochondria-enriched membrane fractions using Western blot analysis. Blots were re-probed for cytochrome C oxidase (COX IV), a specific mitochondrial marker. Western blots of cytosolic fractions re-probed for actin to confirm equal protein loading; C and D: Caspase-3 activity was assessed by measuring the DEVDase (caspase-3 like) activities in cell lysates using a fluorometric assay with a specific substrate. The results are representative of at least 3 independent experiments. Values are normalized to control (C and D). Values are mean ± SE (n = 3), aP < 0.05 vs control.
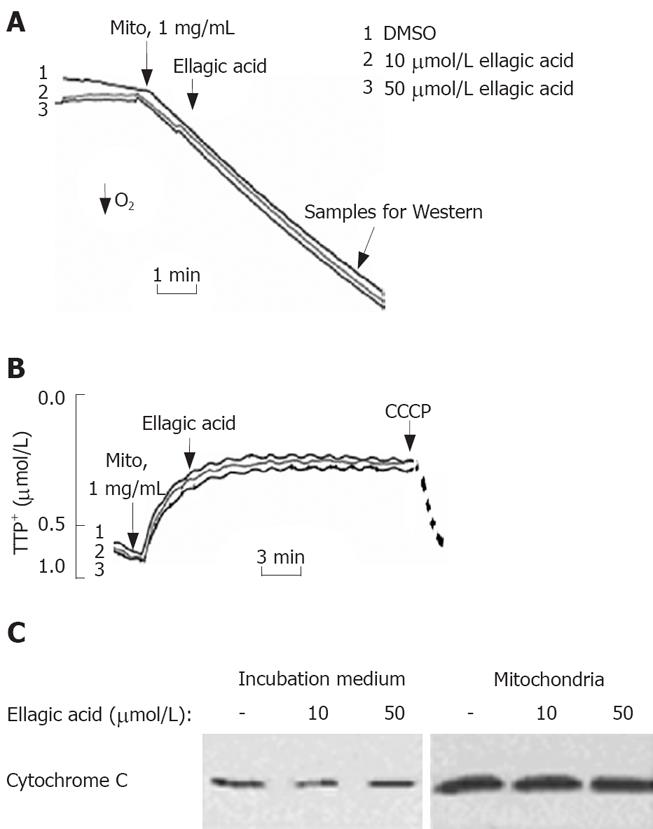
Figure 4 Ellagic acid does not directly affect the function of isolated mitochondria.
Mitochondria were isolated from MIA PaCa-2 cells cultured in the absence of ellagic acid. A: Oxygen consumption was measured using a Clark-type electrode connected to an oxygen meter; B: Mitochondrial membrane potential (ΔΨm) was monitored in the presence of 2 &mgr;mol/L tetraphenyl phosphonium (TPP+) using a TPP+-sensitive electrode connected to an amplifier. Protonophore CCCP (10 &mgr;mol/L) was added to dissipate ΔΨm; C: Cytochrome C levels were measured in the incubation medium and the mitochondrial pellet by Western blot analysis. The results are representative of 3 independent experiments.
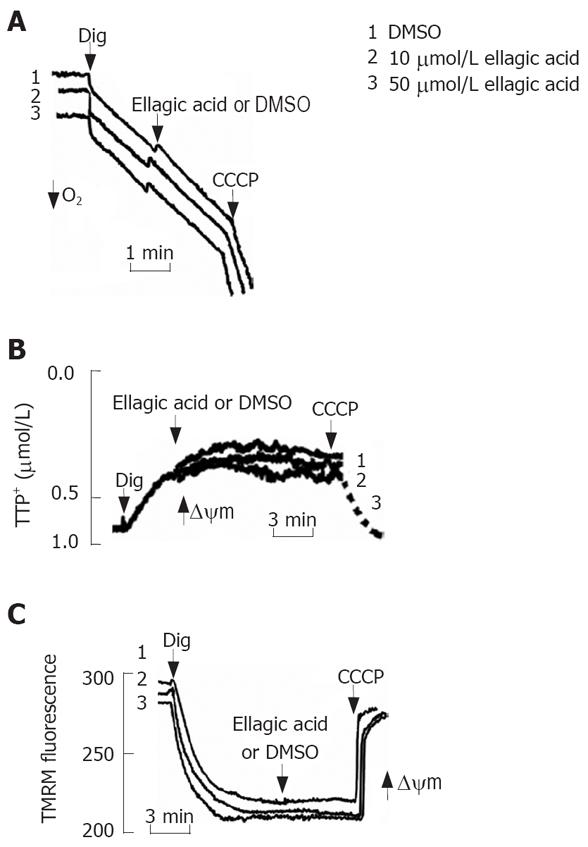
Figure 5 Ellagic acid does not directly affect mitochondria function inpermeabilized MIA PaCa-2 cells.
MIA PaCa-2 cells were permeabilized with 0.001% digitonin. A: Oxygen consumption was measured using a Clark-type electrode connected to an oxygen meter; B: Changes in ΔΨm were monitored in the presence of 2 &mgr;mol/L tetraphenyl phosphonium (TPP+) using a TPP+-sensitive electrode connected to an amplifier; C: Changes in ΔΨm were monitored using the ΔΨm-sensitive fluorescent probe tetramethylrhodamine methyl ester (TMRM); changes in the fluorescence intensities were measured using the excitation at 543 nm and the emission at 578 nm. Protonophore CCCP (10 &mgr;mol/L) was added to dissipate ΔΨm.
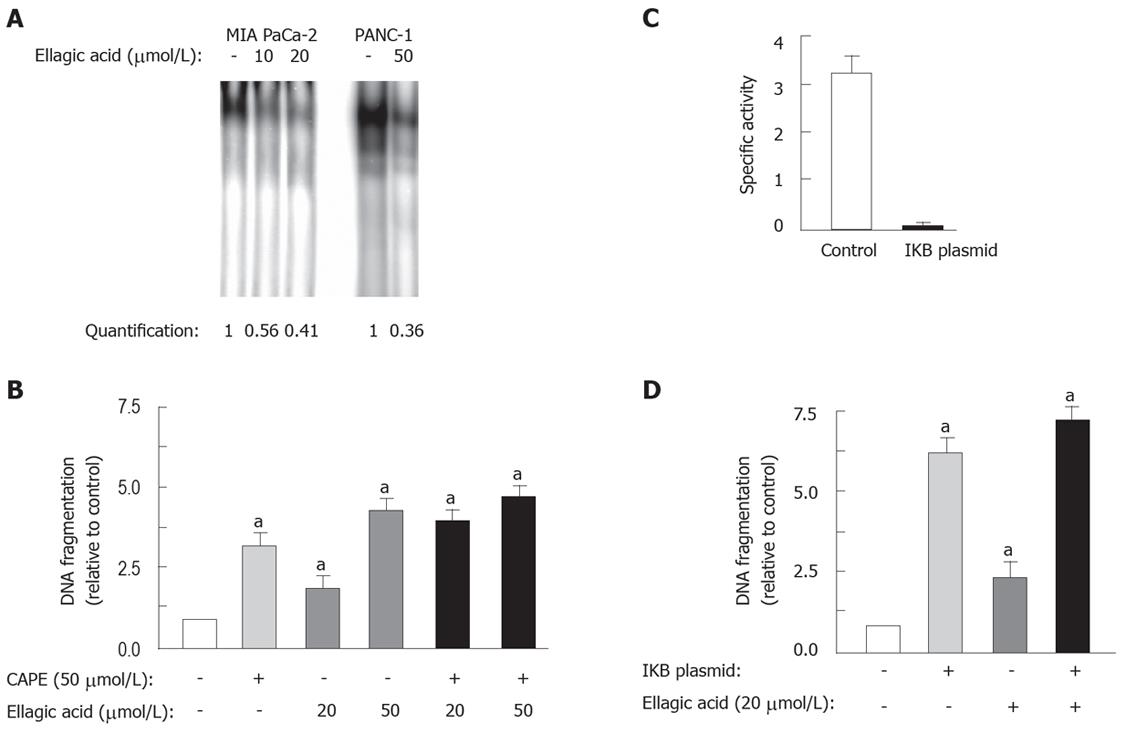
Figure 6 Ellagic acid decreases the activity of the transcription factor NF-κB.
The effects of ellagic acid and pharmacological or molecular inhibition of NF-κB on apoptosis are not additive. MIA PaCa-2 (A and B) cells were cultured for 48 h in the presence or absence of indicated doses of ellagic acid. MIA PaCa-2 cells were transfected with 4KBwt-pRL-TK luciferase plasmid and pRL-TK luciferase as a control using the NucleofectorTM II electroporation system(C and D). A: NF-κB binding activity was measured as described in Experimental procedures; B and D: Internucleosomal DNA fragmentation was measured using the Cell Death Detection ELISA kit; C: NF-κB transcriptional activity was assessed using the dual-Luciferase Reporter Assay System assay. Results are representative of at least 3 independent experiments. Values are normalized to control (B and D). Values are mean ± SE (n = 3), aP < 0.05 vs control.
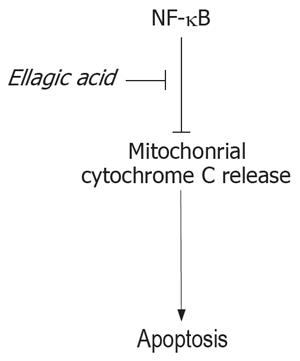
Figure 7 Representative scheme of the proposed mechanism of induction of apoptosis by ellagic acid.
- Citation: Edderkaoui M, Odinokova I, Ohno I, Gukovsky I, Go VLW, Pandol SJ, Gukovskaya AS. Ellagic acid induces apoptosis through inhibition of nuclear factor κB in pancreatic cancer cells. World J Gastroenterol 2008; 14(23): 3672-3680
- URL: https://www.wjgnet.com/1007-9327/full/v14/i23/3672.htm
- DOI: https://dx.doi.org/10.3748/wjg.14.3672


