Copyright
©2008 The WJG Press and Baishideng.
World J Gastroenterol. Jun 21, 2008; 14(23): 3650-3661
Published online Jun 21, 2008. doi: 10.3748/wjg.14.3650
Published online Jun 21, 2008. doi: 10.3748/wjg.14.3650
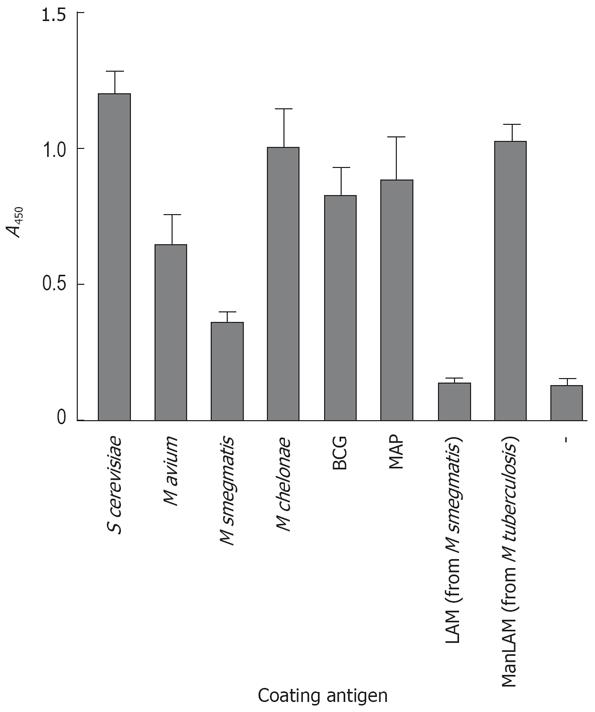
Figure 1 Reactivity of Galanthus nivalis lectin (GNL) with mycobacterial lysates and purified LAM or ManLAM.
ELISA plates were coated with yeast mannan, mycobacterial lysates, purified LAM or ManLAM or coating buffer alone without antigen (-), and binding of biotinylated GNL to these antigens assessed by further incubation with peroxidase-coupled streptavidin followed by TMB substrate reaction. Shown are mean values ± SE of 3 individual experiments.
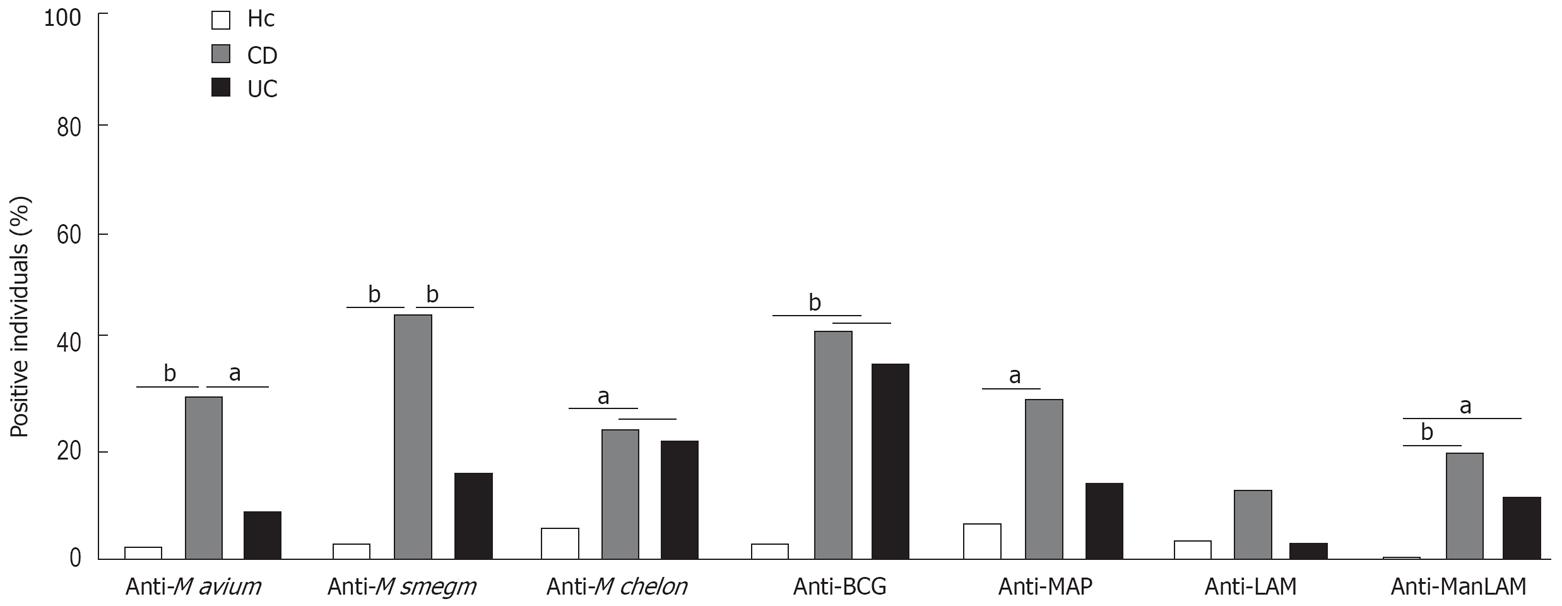
Figure 2 Determination of anti-mycobacterial serum IgG in IBD and healthy controls.
ELISA for different mycobacterial lysates and purified LAM or ManLAM were performed with sera from 105 CD patients, 45 UC patients and 35 controls. A negative to positive discrimination level was defined by a cut-off value representing the average of all A450 values from the healthy controls (excluding the clearly positive individuals with an A450≥ 0.3) plus 3 standard deviations. With these cut-off values, individuals positive for antibodies against the various mycobacterial antigens were identified and are shown as a percent of the total population. Asterisks indicate significant differences between the populations. aP < 0.05, bP < 0.01.
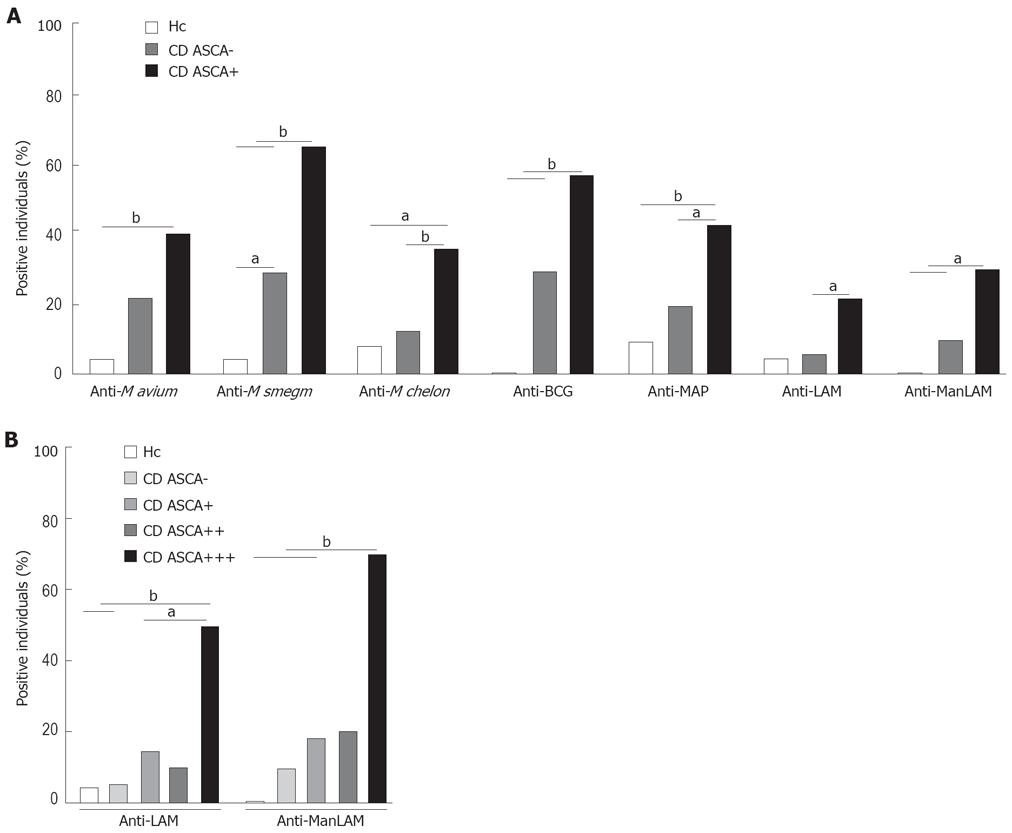
Figure 3 Association of anti-mycobacterial IgG with ASCA.
CD patients were grouped according to their ASCA status and their anti-mycobacterial IgG were determined in comparison with healthy controls (n = 25). A: ASCA- (n = 42), extinction values at 450 nm below the cut-off as determined by routine diagnostics (3 standard deviations above the average of 10 negative control sera); ASCA+ (n = 48) extinction values above the cut-off. According to the legend of Figure 1, percentages of IgG-positive individuals per group were determined for each antigen. B: ASCA-positive CD patients were further grouped according to the levels of ASCA and compared to healthy controls and UC patients. ASCA+ (n = 28), A450 clearly above, but less than double the cut-off value; ASCA++ (n = 10), A450 2 to 3 times higher than the cut-off value; ASCA+++ ( = 10), A450 higher than 3 times the cut-off value. According to legends of Figures 1 and 2A, percentages of anti-LAM and anti-ManLAM IgG-positive individuals in each group were determined. Asterisks indicate significant differences between the groups. aP < 0.05, bP < 0.01.
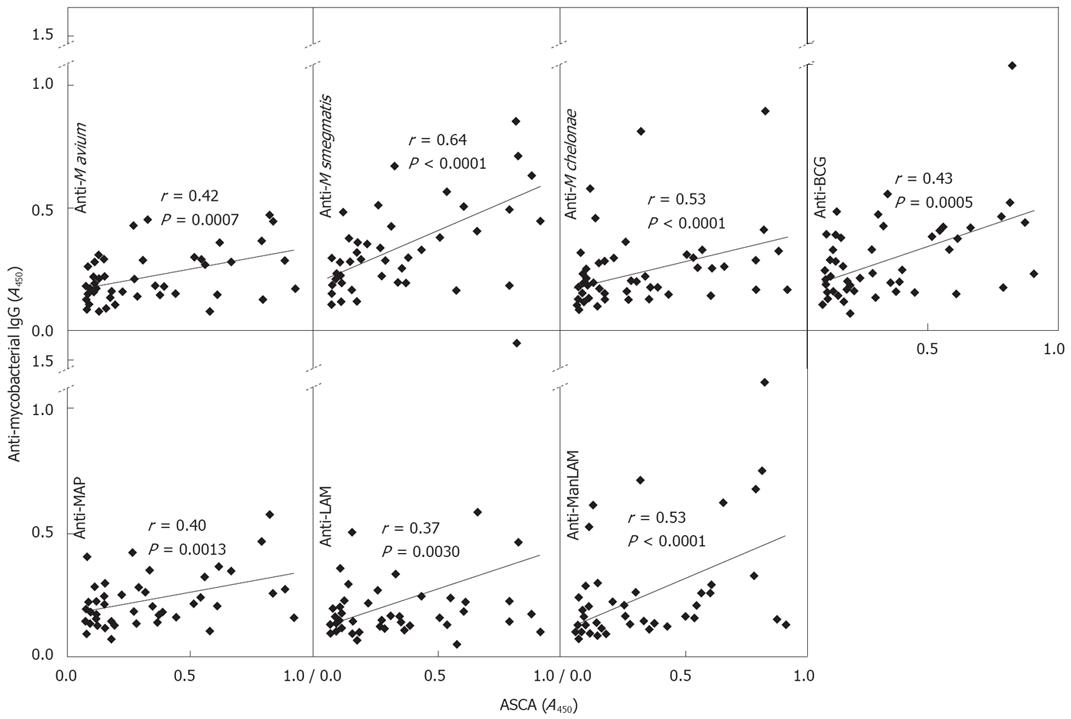
Figure 4 Correlation of ASCA with anti-mycobacterial IgG titers.
Sera from 60 CD patients were randomly chosen and used for determination of ASCA titers and anti-mycobacterial IgG levels in the same experiment. Each dot represents one serum sample with the A450 obtained in the ASCA-specific ELISA (x-axis) and that obtained with ELISA specific for IgG against different mycobacterial lysates or purified LAM or ManLAM (y-axis).
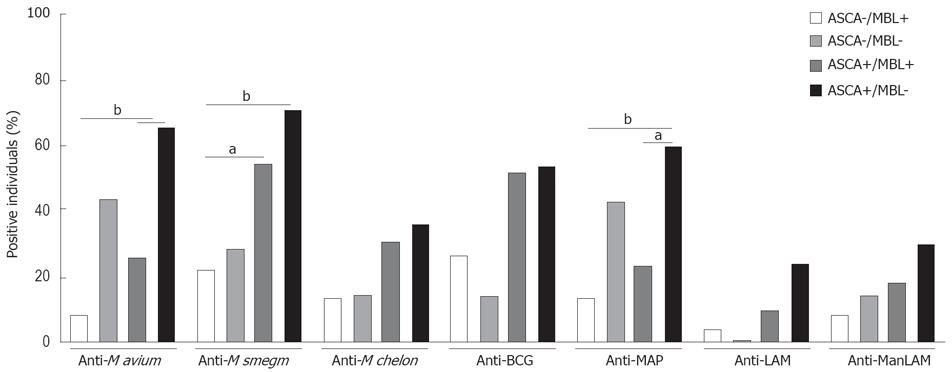
Figure 5 ASCA-positivity and MBL-negativity synergistically associate with anti-mycobacterial seroreactivity.
CD patients’ sera were grouped according to their ASCA and MBL status. ASCA-negative and ASCA-positive patients were separated into MBL-expressers (> 500 ng/mL, n = 23 and 39, respectively) and MBL-low/deficient (≤ 500 ng/mL, n = 7 and 17, respectively) individuals. From each group, average IgG levels against mycobacterial lysates or purified LAM or ManLAM ± SEM were determined. Percentages of individuals per group with anti-mycobacterial IgG titers above the cut-off levels are shown. Significant differences are marked with asterisks. aP < 0.05, bP < 0.01.
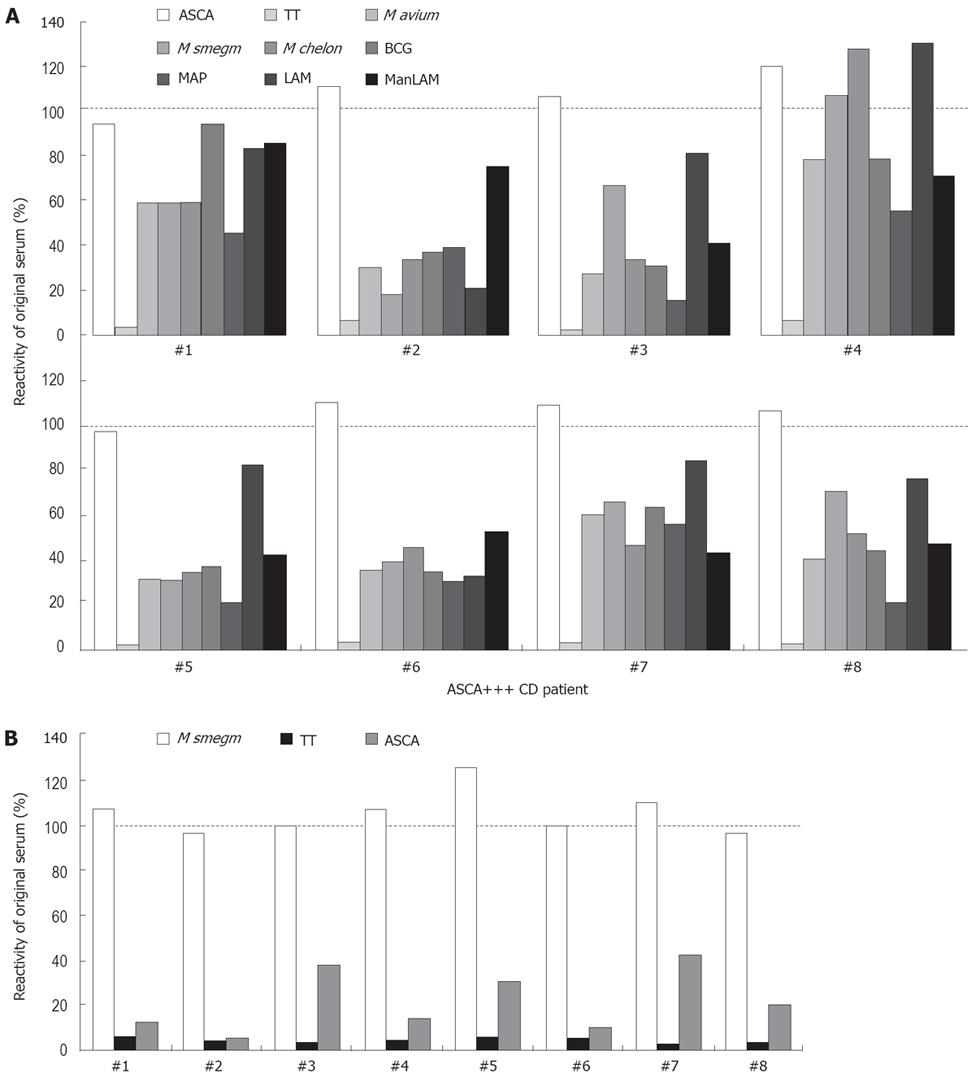
Figure 6 ASCA strongly cross-react with mycobacterial antigens in a subgroup of ASCA-positive CD patients.
A: Eight sera from highly ASCA-positive CD patients were incubated with membrane sections of yeast mannan Western blots containing the ASCA-reactive material, and bound antibodies were eluted. Eluted antibodies were titrated to yield comparable extinction values in the ASCA ELISA as with the original serum (approx. 100%, empty columns) and used at the corresponding dilution to assess reactivities against mycobacterial antigens. As a specificity control for affinity purification, eluted antibodies were also tested in a tetanus toxoid (TT) ELISA. B: The same 8 patients’ sera were also affinity purified on nitrocellulose membranes decorated with M smegmatis lysate. In analogy to A, eluted antibodies were adjusted for equal reactivity with M smegmatis as the original sera (approx. 100%, empty columns) and tested at the corresponding dilution for reactivities against yeast mannan and TT.
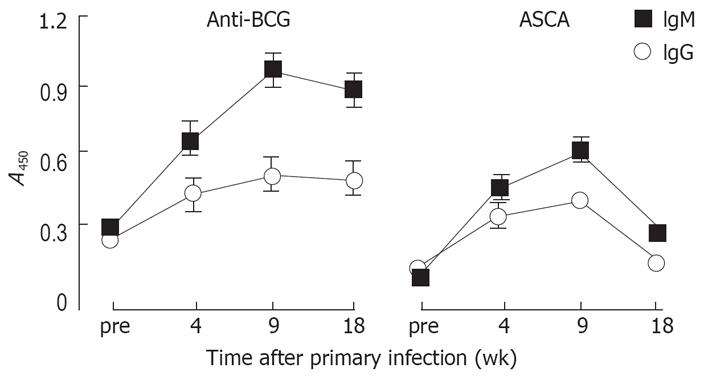
Figure 7 Antibody response of mice infected with M bovis BCG.
C57BL/6 mice were intravenously infected with 107 viable M bovis BCG and the infection repeated after 5 wk. Serum was prepared from blood samples collected before infections, 4 wk after primary infection and 4 wk and 13 wk after secondary infection. Serum samples were tested for the presence of IgM (filled squares) and IgG (empty spheres) antibodies specific for M bovis BCG (left panel) and for S cerevisiae mannan (right panel). Results are shown as average A450 values of 4 animals ± SE.
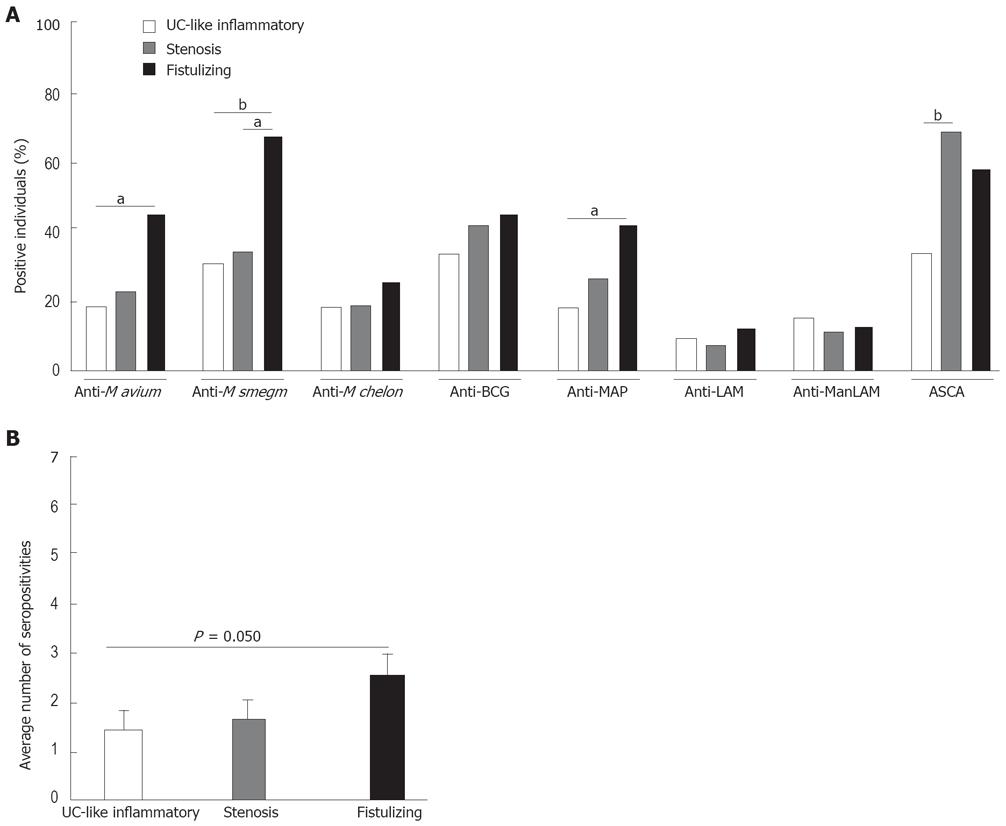
Figure 8 Correlation of distinct anti-mycobacterial seroreactivities with disease phenotype.
A total number of 89 CD patients were classified according to the Vienna criteria into UC-like (purely inflammatory) disease or complicated disease either with stenoses or fistulizing. A: The percentages of individuals per group with A450 values above the cut-off are shown for IgG against each mycobacterial antigen; B: The average number of different mycobacterial antigens against which an individual patient expresses IgG is indicated for each group. aP < 0.05, bP < 0.01.
-
Citation: Müller S, Schaffer T, Schoepfer AM, Hilty A, Bodmer T, Seibold F. Partial overlap of anti-mycobacterial, and anti-
Saccharomyces cerevisiae mannan antibodies in Crohn’s disease. World J Gastroenterol 2008; 14(23): 3650-3661 - URL: https://www.wjgnet.com/1007-9327/full/v14/i23/3650.htm
- DOI: https://dx.doi.org/10.3748/wjg.14.3650


