Copyright
©2008 The WJG Press and Baishideng.
World J Gastroenterol. Jun 14, 2008; 14(22): 3484-3489
Published online Jun 14, 2008. doi: 10.3748/wjg.14.3484
Published online Jun 14, 2008. doi: 10.3748/wjg.14.3484
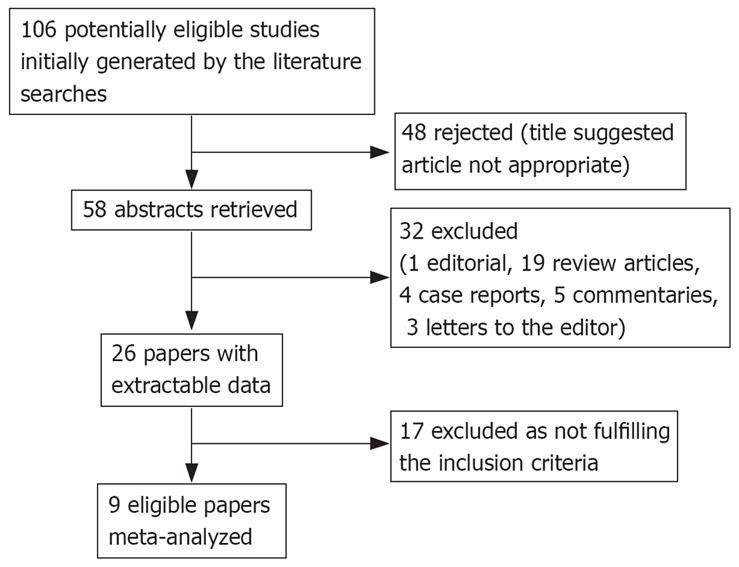
Figure 1 Flow diagram of the studies identified in this meta-analysis.
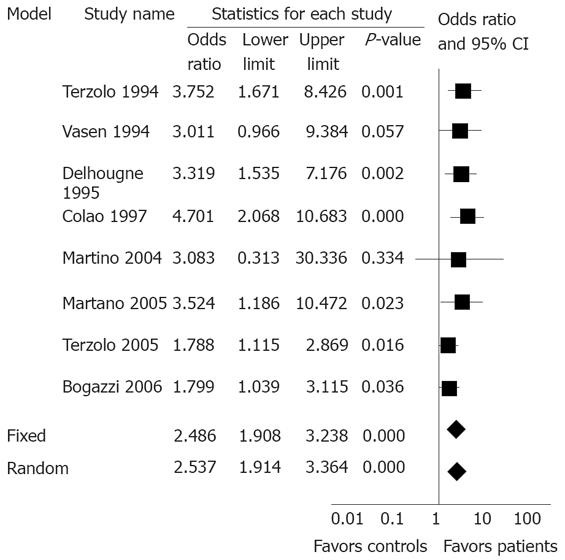
Figure 2 Forest plot showing individual and pooled ORs (95% CIs) and P values in studies comparing the colon adenoma prevalence in acromegaly patients and controls.
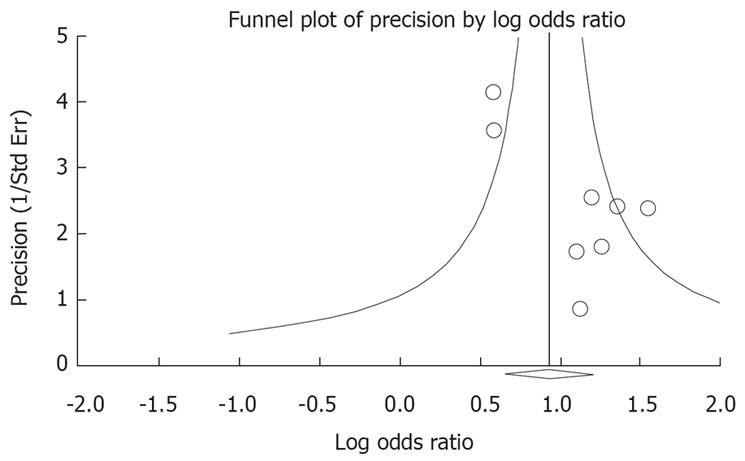
Figure 3 Funnel plot of selected studies examining colon adenoma prevalence in acromegaly patients and controls.
No evidence of publication bias found (P = 0.711, by adjusted rank correlation test). Similarly no evidence of publication bias was found for the other colon neoplasias studied, i.e. colon hyperplastic polyps and colon cancer (see results, Table 2).
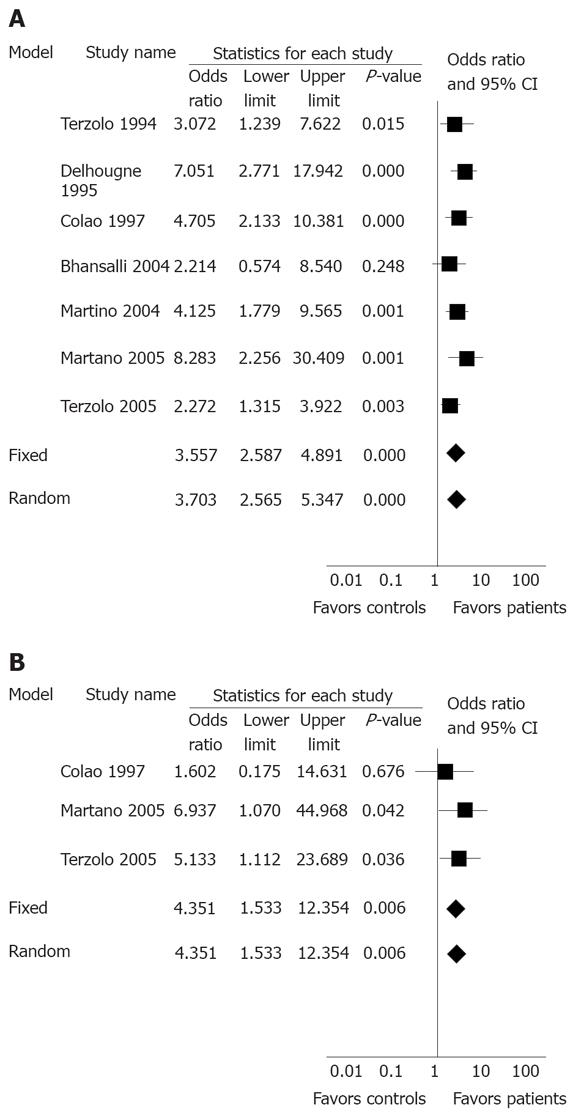
Figure 4 Forest plot showing individual and pooled ORs (95% CIs) and P values in studies comparing the colon hyperplastic polyp prevalence (A) and the colon cancer prevalence (B) in acromegaly patients and controls.
- Citation: Rokkas T, Pistiolas D, Sechopoulos P, Margantinis G, Koukoulis G. Risk of colorectal neoplasm in patients with acromegaly: A meta-analysis. World J Gastroenterol 2008; 14(22): 3484-3489
- URL: https://www.wjgnet.com/1007-9327/full/v14/i22/3484.htm
- DOI: https://dx.doi.org/10.3748/wjg.14.3484


